11 Best Tools to Monitor and Debug JavaScript in 2026
JavaScript is one of the most widely used programming languages for creating dynamic, interactive websites. However, there may be instances where a function is not operating as intended because of a coding error while creating JavaScript projects. Therefore, the majority of developers hunt for JavaScript debugging tools to avoid problems and identify errors before execution.
Although debugging is a difficult endeavor, you can discover several tools available that will assist you in identifying errors and bugs at various stages of development. These well-known debugging tools' primary function is to locate the errors' causes and identify, examine, and correct them.
You need a trustworthy JavaScript debugging tool that gives you confidence so you can launch codes fearlessly and solve problems more quickly. You can also set breakpoints and look at variables while the code is running with a debugger.
Thankfully, many JavaScript debugging tools are available, so solving problems is simple.
We will cover the following:
Monitoring Tools
There are a variety of monitoring tools available to help businesses track their performance and identify areas that need improvement. The right monitoring tools can give you the insights you need to see how your business is doing, what areas need improvement, and where you might be able to save money.
But with so many monitoring tools on the market, how do you know which ones are right for your business?
We’ll take a look at some of the most popular monitoring tools and help you decide which ones are right for you.
#1 Atatus
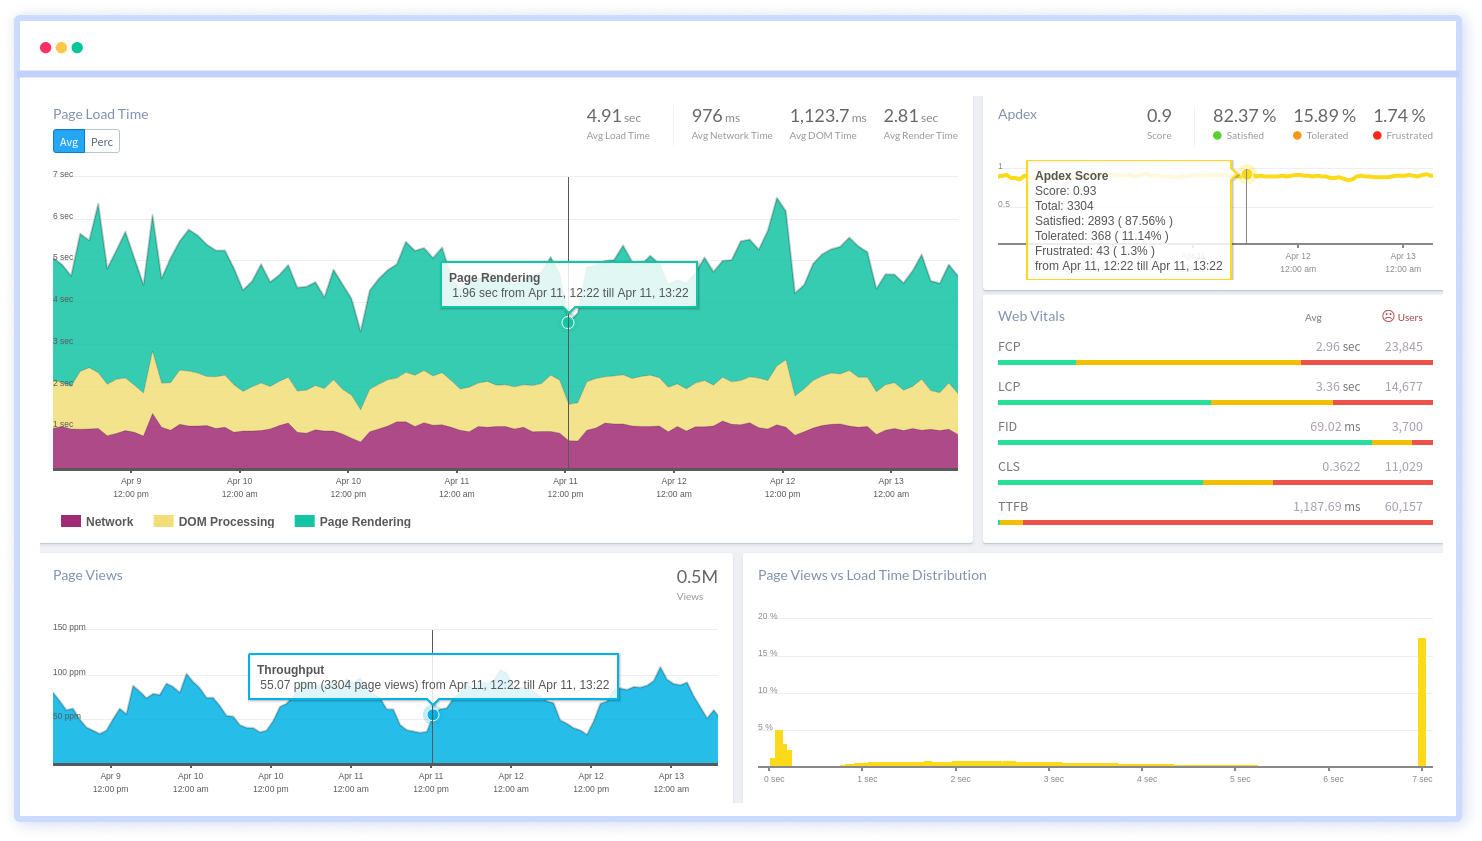
Atatus provides JavaScript error and performance monitoring which help you get complete visibility into your JavaScript errors and performance issues that are impacting your end-user experience. You can fix critical issues sooner with in-depth data points that help you analyze and resolve issues quickly.
You will gain insights into why your customers were affected by bad front-end performance and slow page load. Then you can inspect individual users having poor experiences due to slow pages, JavaScript exceptions, or failing AJAX calls.
Using Atatus, you can quickly see how the network or geographical region affects your end users' experience. Session traces provides a waterfall view of the session to identify slow JavaScript assets, long load times, and errors.
Each JavaScript error is recorded with a complete stack trace and the relevant line of source code is underlined to help with bug fixes. Your minified code is automatically translated into the original source line, resulting in the crash using source mapping.
You can see user actions, console logs, and all JavaScript events to help you resolve the JavaScript error. You will also get alerts for errors and exceptions via Email, Slack, PagerDuty, or using webhooks.
You may observe the duration of each route change. Additionally, you can look into the AJAX breakdown of the route change, the slow routes breakdown with trace, and the JavaScript SPA response times. You will receive a thorough overview and information about how it affects your end-user experience.
Features:
- Complete stack traces and error occurrence data
- Complete visibility into end-user experience
- Easy to set up
- Error reporting and feedback
- Integrates well with popular tools
- Monitor, troubleshoot, and optimize JavaScript
- No code changes required
- Sends real-time alerts through Slack
- Understanding the complex performance issues
Atatus provides a free 14-day trial period with unlimited access to all features with no credit card required policy. We offer APM at $0.07/month, RUM at $1.96/month, Infra at $0.014/month, Log at $2/month, Synthetic at $1.5/month, and Analytics at $1/month. You can also contact us for a custom plan with premium support.
#2 Sentry
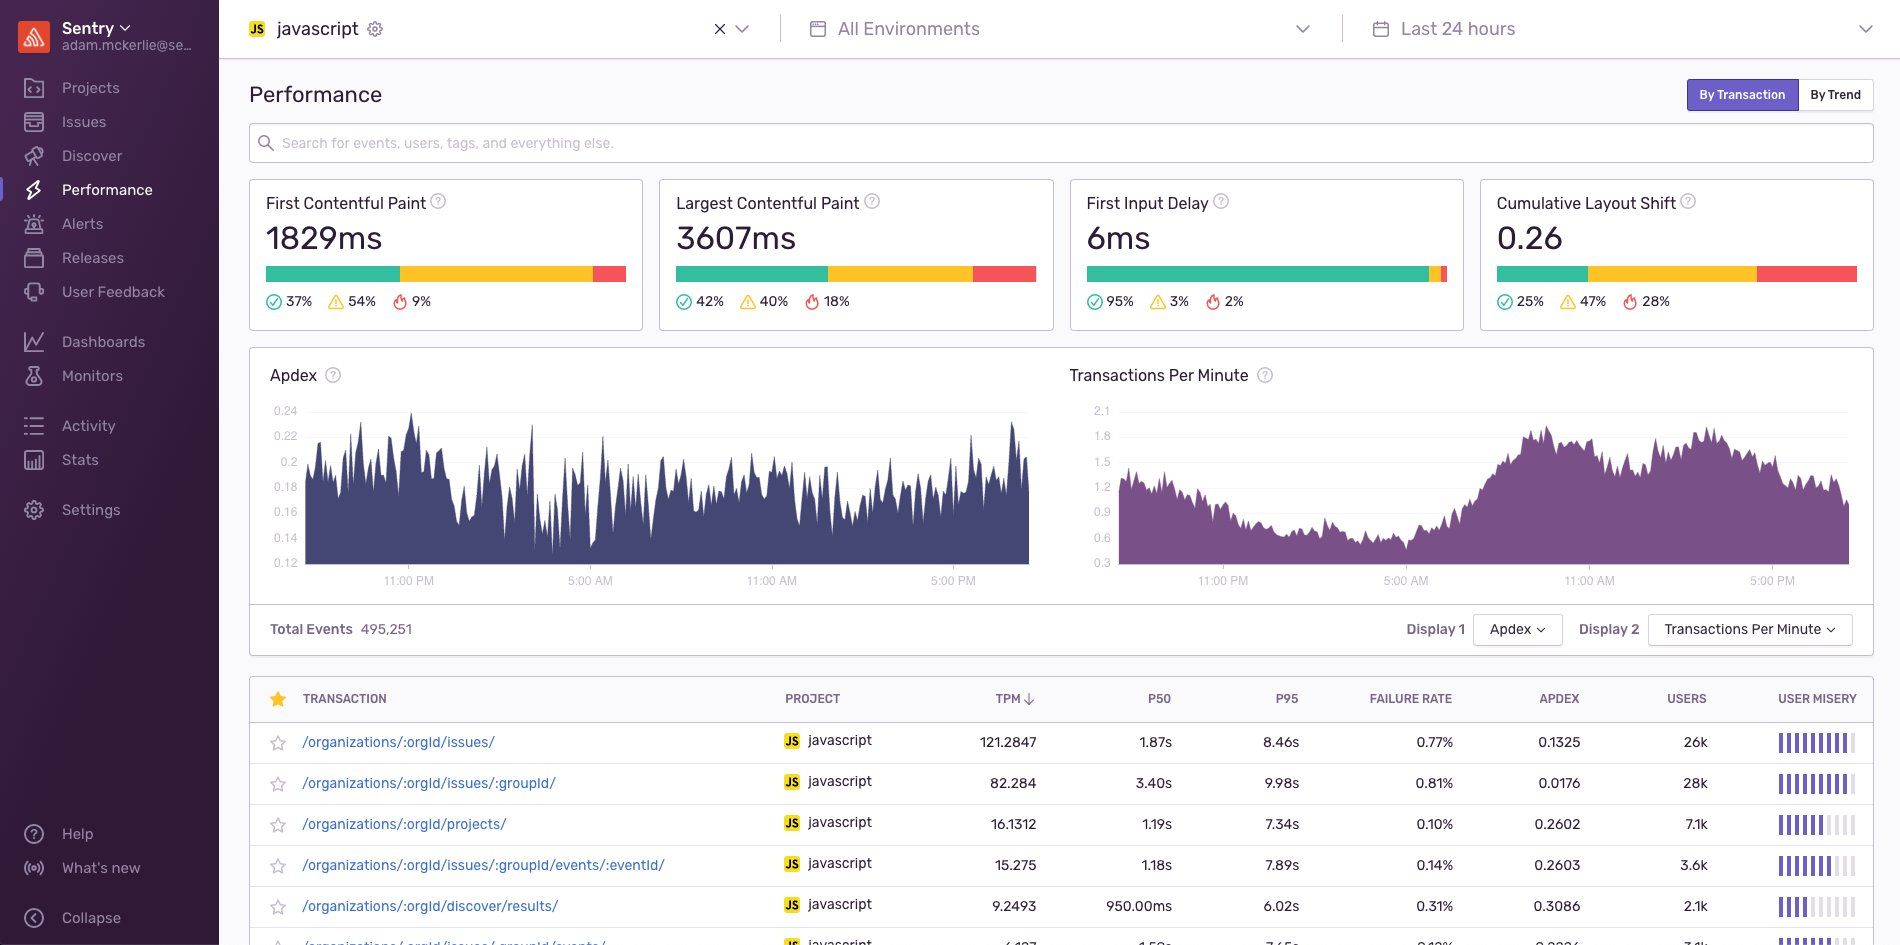
Sentry is a performance tracking and error analysis tool that can identify and fix JavaScript errors. The service collects your issues into a searchable list and enables you to pinpoint specific sections of your code that make it simpler to duplicate errors.
By enabling you to identify odd readouts immediately, performance monitoring tools can aid in diagnosing issues in your development projects.
A stack tracing tool also simulates your development environment so that you can troubleshoot errors as they are found and pinpoint the locations of issues in the code.
A collection of JavaScript monitoring tools from the Sentry can connect to your runtime environment and handle the labor-intensive debugging tasks for you.
Sentry for JavaScript provides you with the complete context in the form of complete stack traces, support for source maps that synchronize your code, and direct integration with your source code management tool to assist you in locating questionable contributions.
The device, operating system, and browser of your users are also provided on the Issue Details page of Sentry, giving you a complete insight into the circumstances surrounding your JavaScript incident.
Features:
- Bug tracking
- Fault aggregation workflows
- Free with premium options
- Log data insights
- Performance monitoring
The main features of Sentry are completely free to use with a limited user capacity. Upgrade to the Team package for $26/month to improve the algorithms for error detection, or to the Business package for $80/month to expand the scope of the error insights.
The Team and Business editions also come with a free trial. Get in touch with Sentry directly for enterprise-size services. You can also get information regarding thorough platform error monitoring and cross-project analytics.
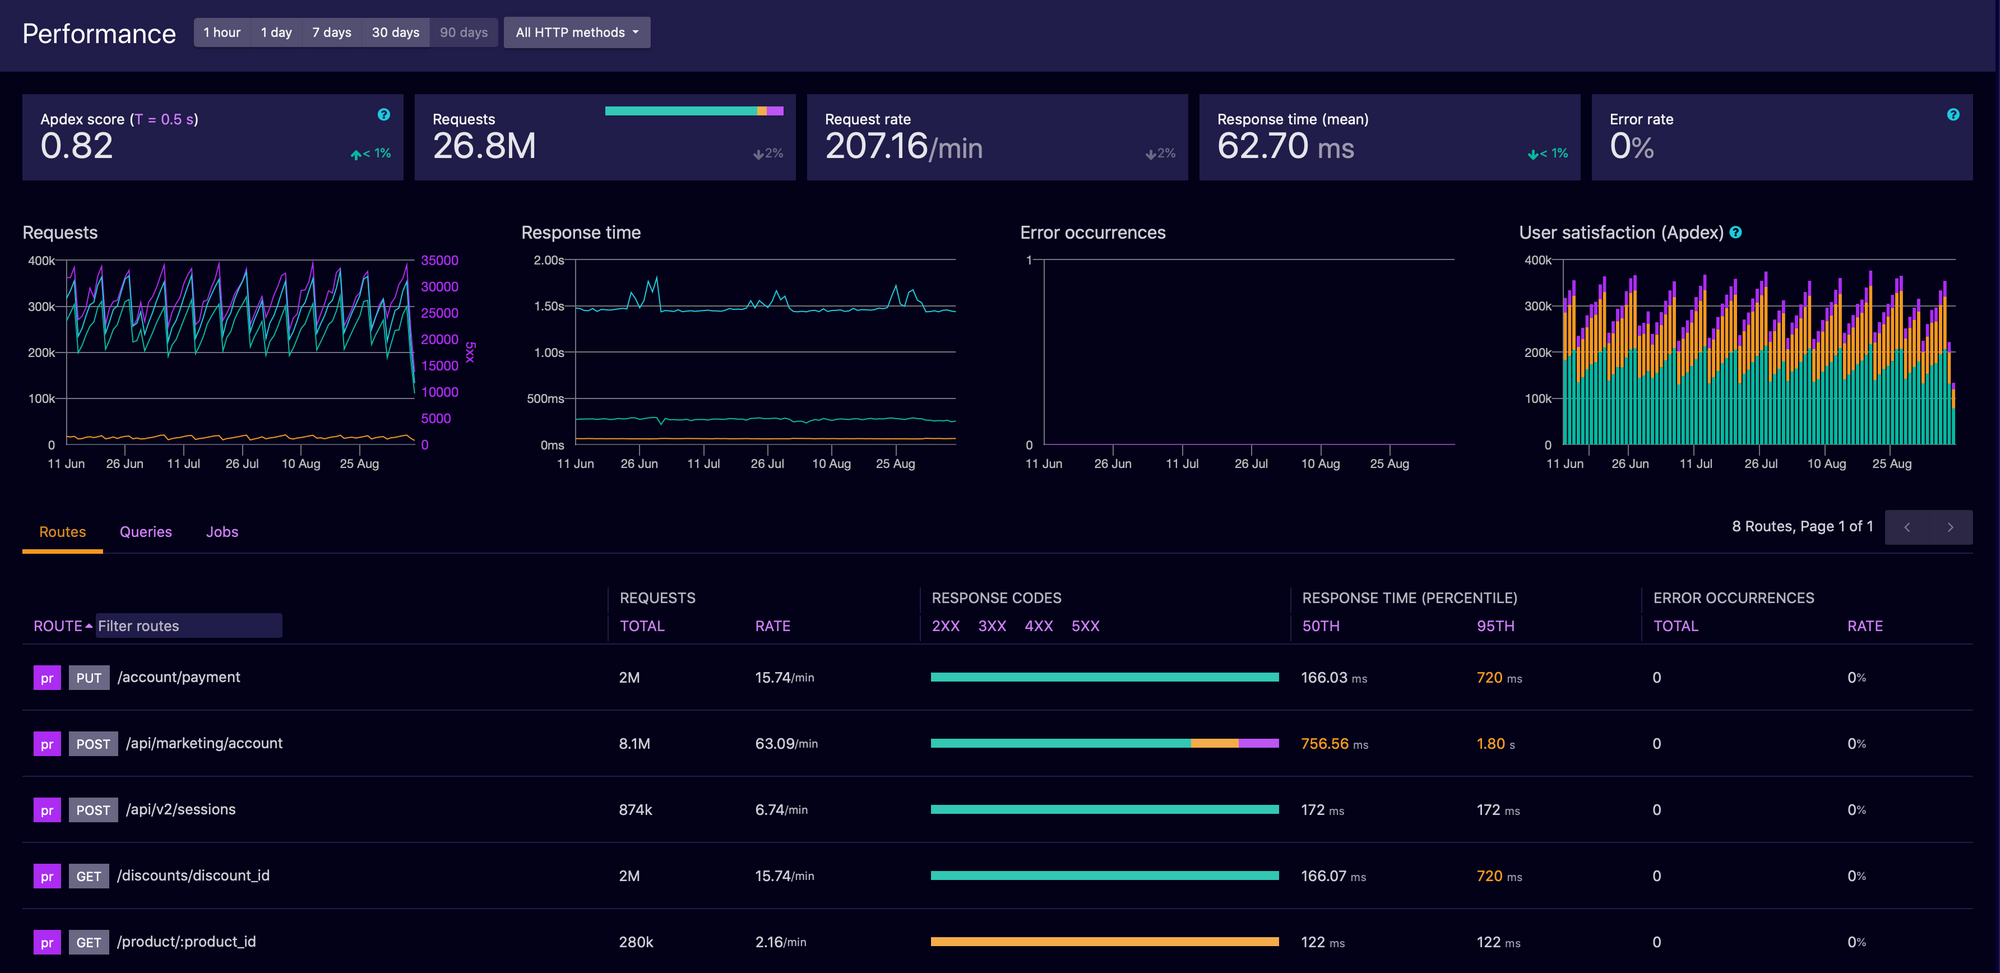
#3 Raygun
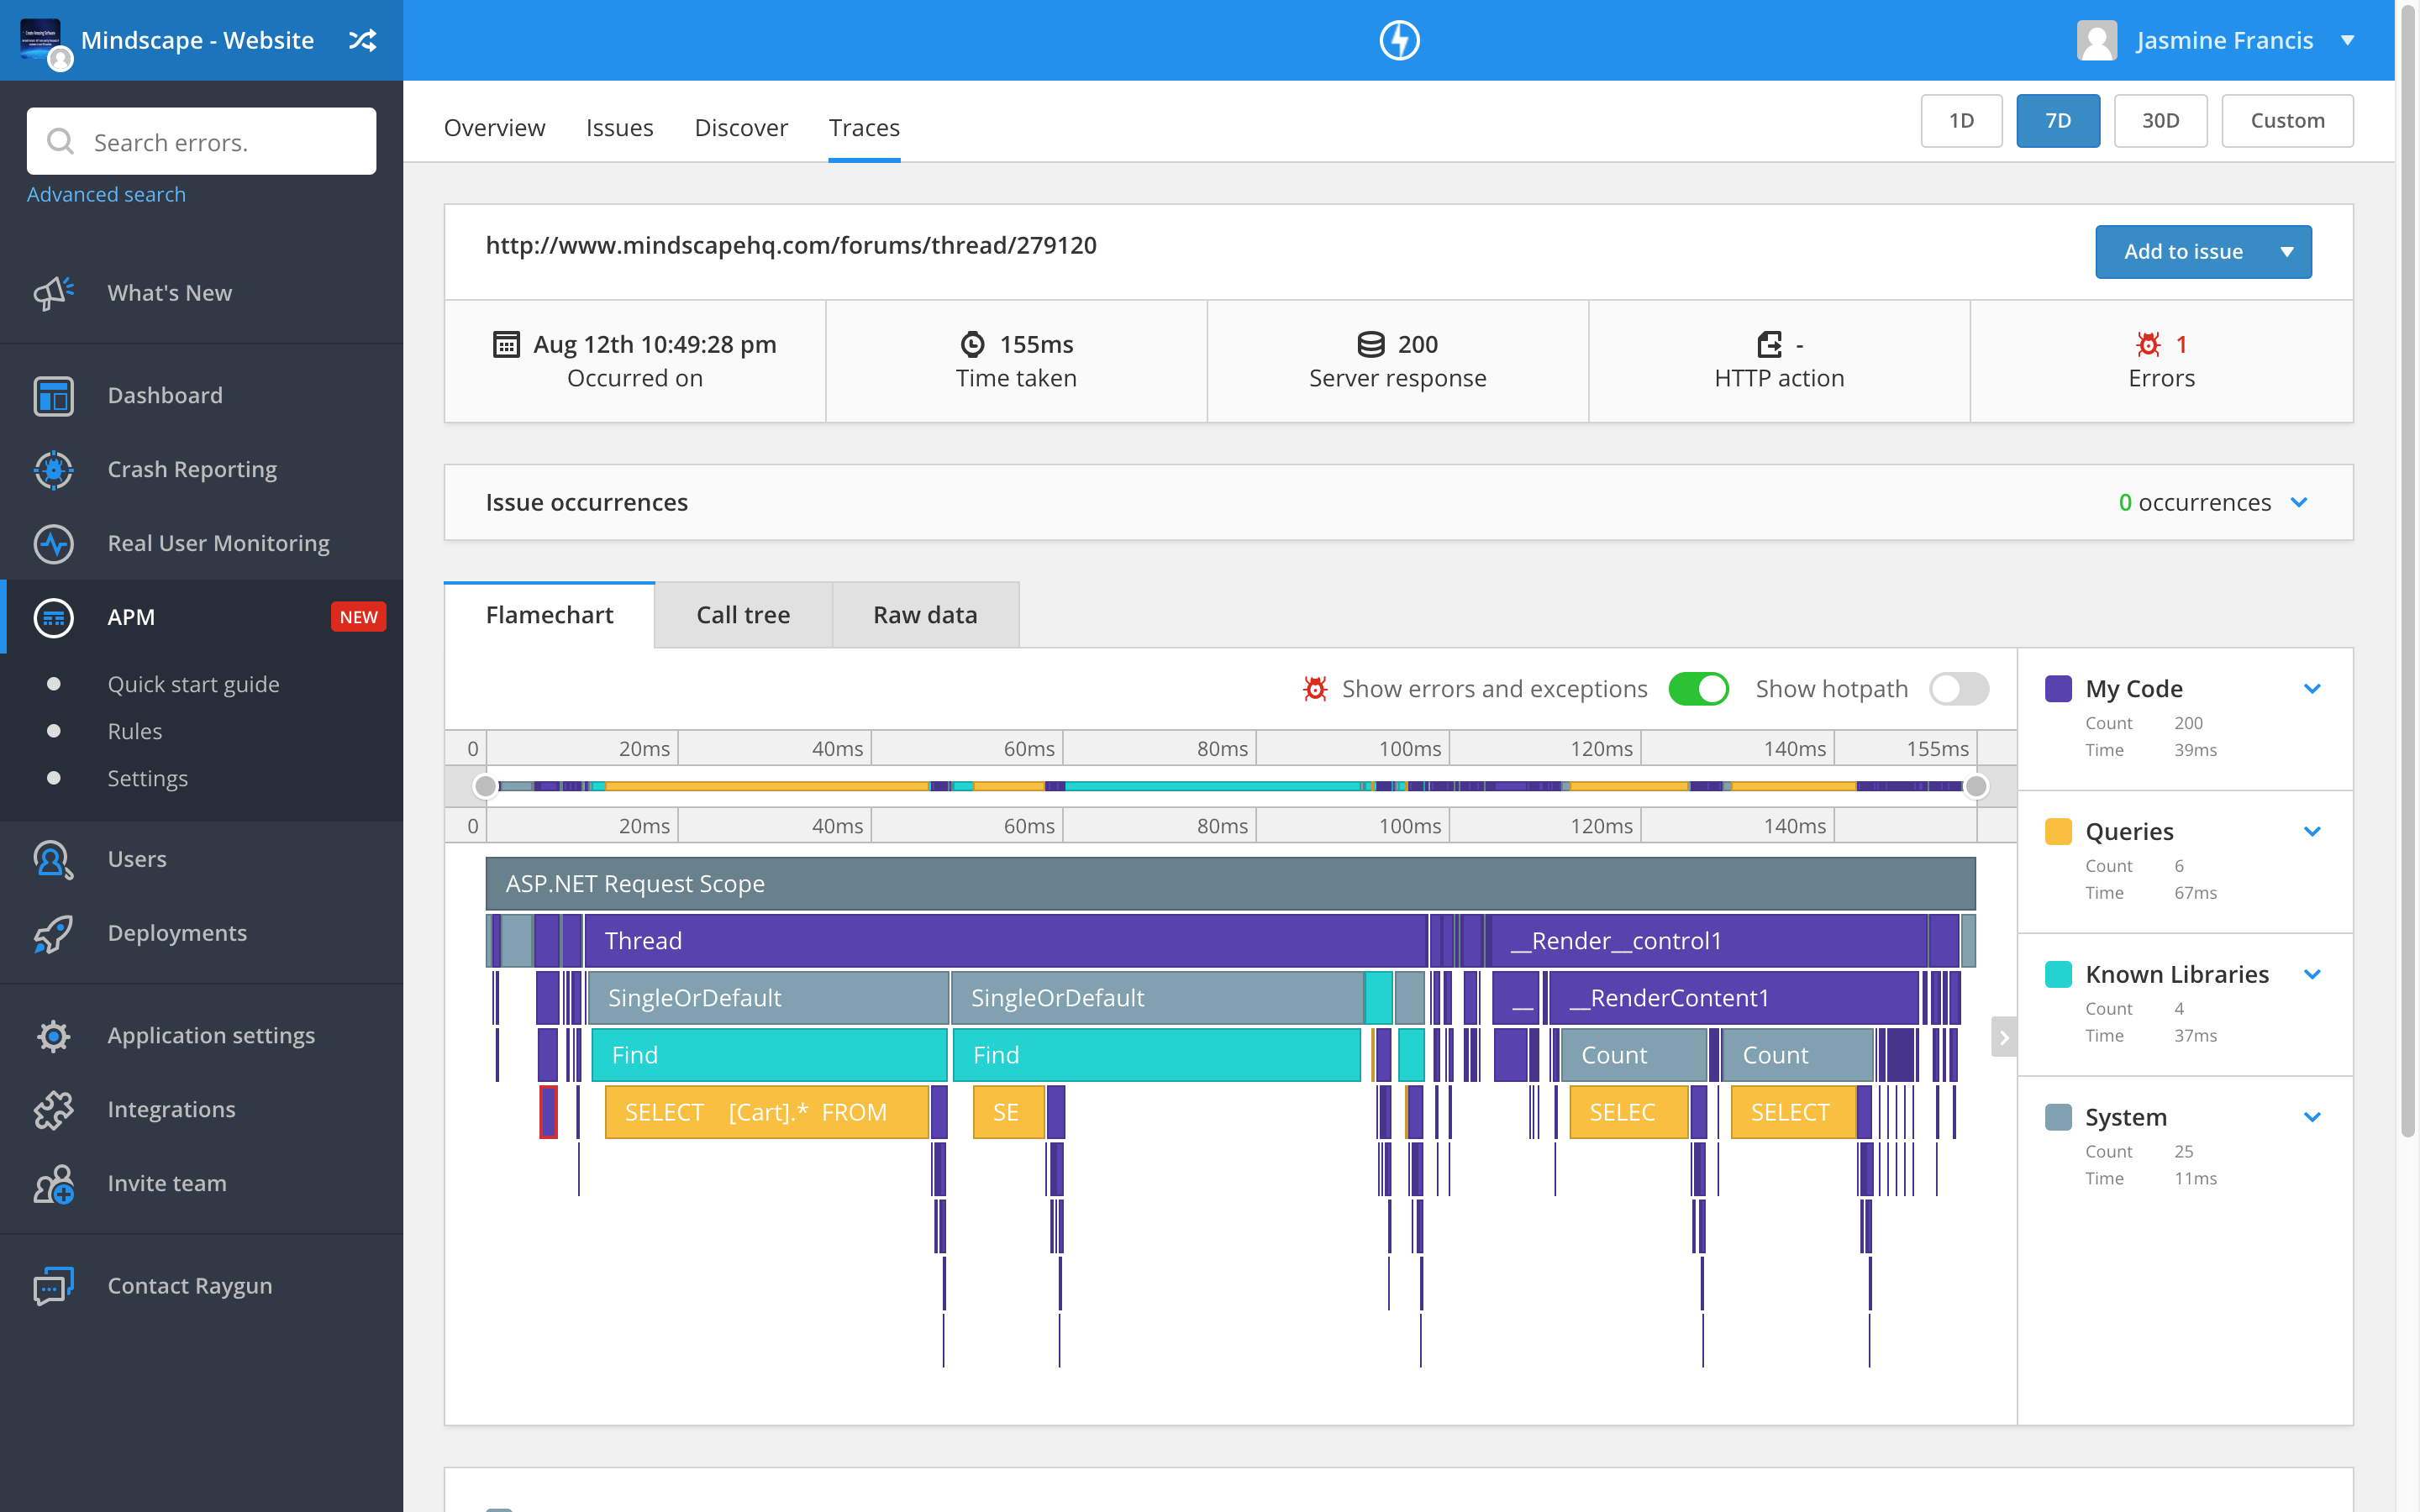
Raygun is a cloud-based platform that offers performance monitoring, crash reporting, and bug feedback for your JavaScript and other web and mobile applications.
With Raygun, you can keep an eye out for performance issues and JavaScript errors that could be degrading the user experience. To facilitate accurate crash reporting and bug feedback, Raygun also aggregates user data.
For both web and mobile applications, Raygun offers you real-time application performance-related issues. Additionally, it collects metrics on user satisfaction, keeps track of errors and crashes, and offers a code-level analysis of any downtime.
You can deploy Raygun combined with RUM and Crash reporting to have a client-focused monitoring solution with full observability.
Features:
- Crash report diagnostics
- Customizable purchase options
- Error reporting and feedback
- Inbuilt bug-fixing information
- User Monitoring
The solution is divided into 3 main services, each of which can be tested out on the website without cost. The Application Performance Monitoring and Real User Monitoring subscriptions, which start at $8 per month, will also be beneficial for your monitoring requirements.
The Error Monitoring & Crash Reporting application costs $4 per month and contains the appropriate JavaScript debugging tools. The cost of each product is also scalable based on the desired capacity, often in increments of 10,000 units.
#4 Airbrake
Airbrake is an error monitoring tool that offers provides continuous monitoring of your entire application stack with real-time alerts. The platform was created with developers in mind and includes support for languages like JavaScript.
The main feature of Airbrake is its quick, lightweight installation and seamless integration. For better bug notifications and workflow management, the error reporting tools integrate Slack, Trello, Github, etc., and offer fast notifications.
Additionally, the breadcrumbs and code snapshot capabilities make it simpler to mitigate vulnerabilities, and the user monitoring function gives you detailed information about the individuals who are finding your bugs.
Airbrake notifiers are agentless and serverless, support more than 50 languages, frameworks, and libraries, install quickly, and have little to no effect on the speed of your code or application.
Features:
- CI/CD integration
- Deployment tracking
- Error and performance monitoring
- Mitigation tools
- Multi-language
All of the functionality of the product is accessible for a 30-day free trial. The product itself is also separated into pricing tiers that determine capacity. For instance, the Tier 1 package, which costs $19 per month, supports 25k errors. The Tier 4 subscription costs $299 per month and supports up to 1 million errors.
#5 Rollbar
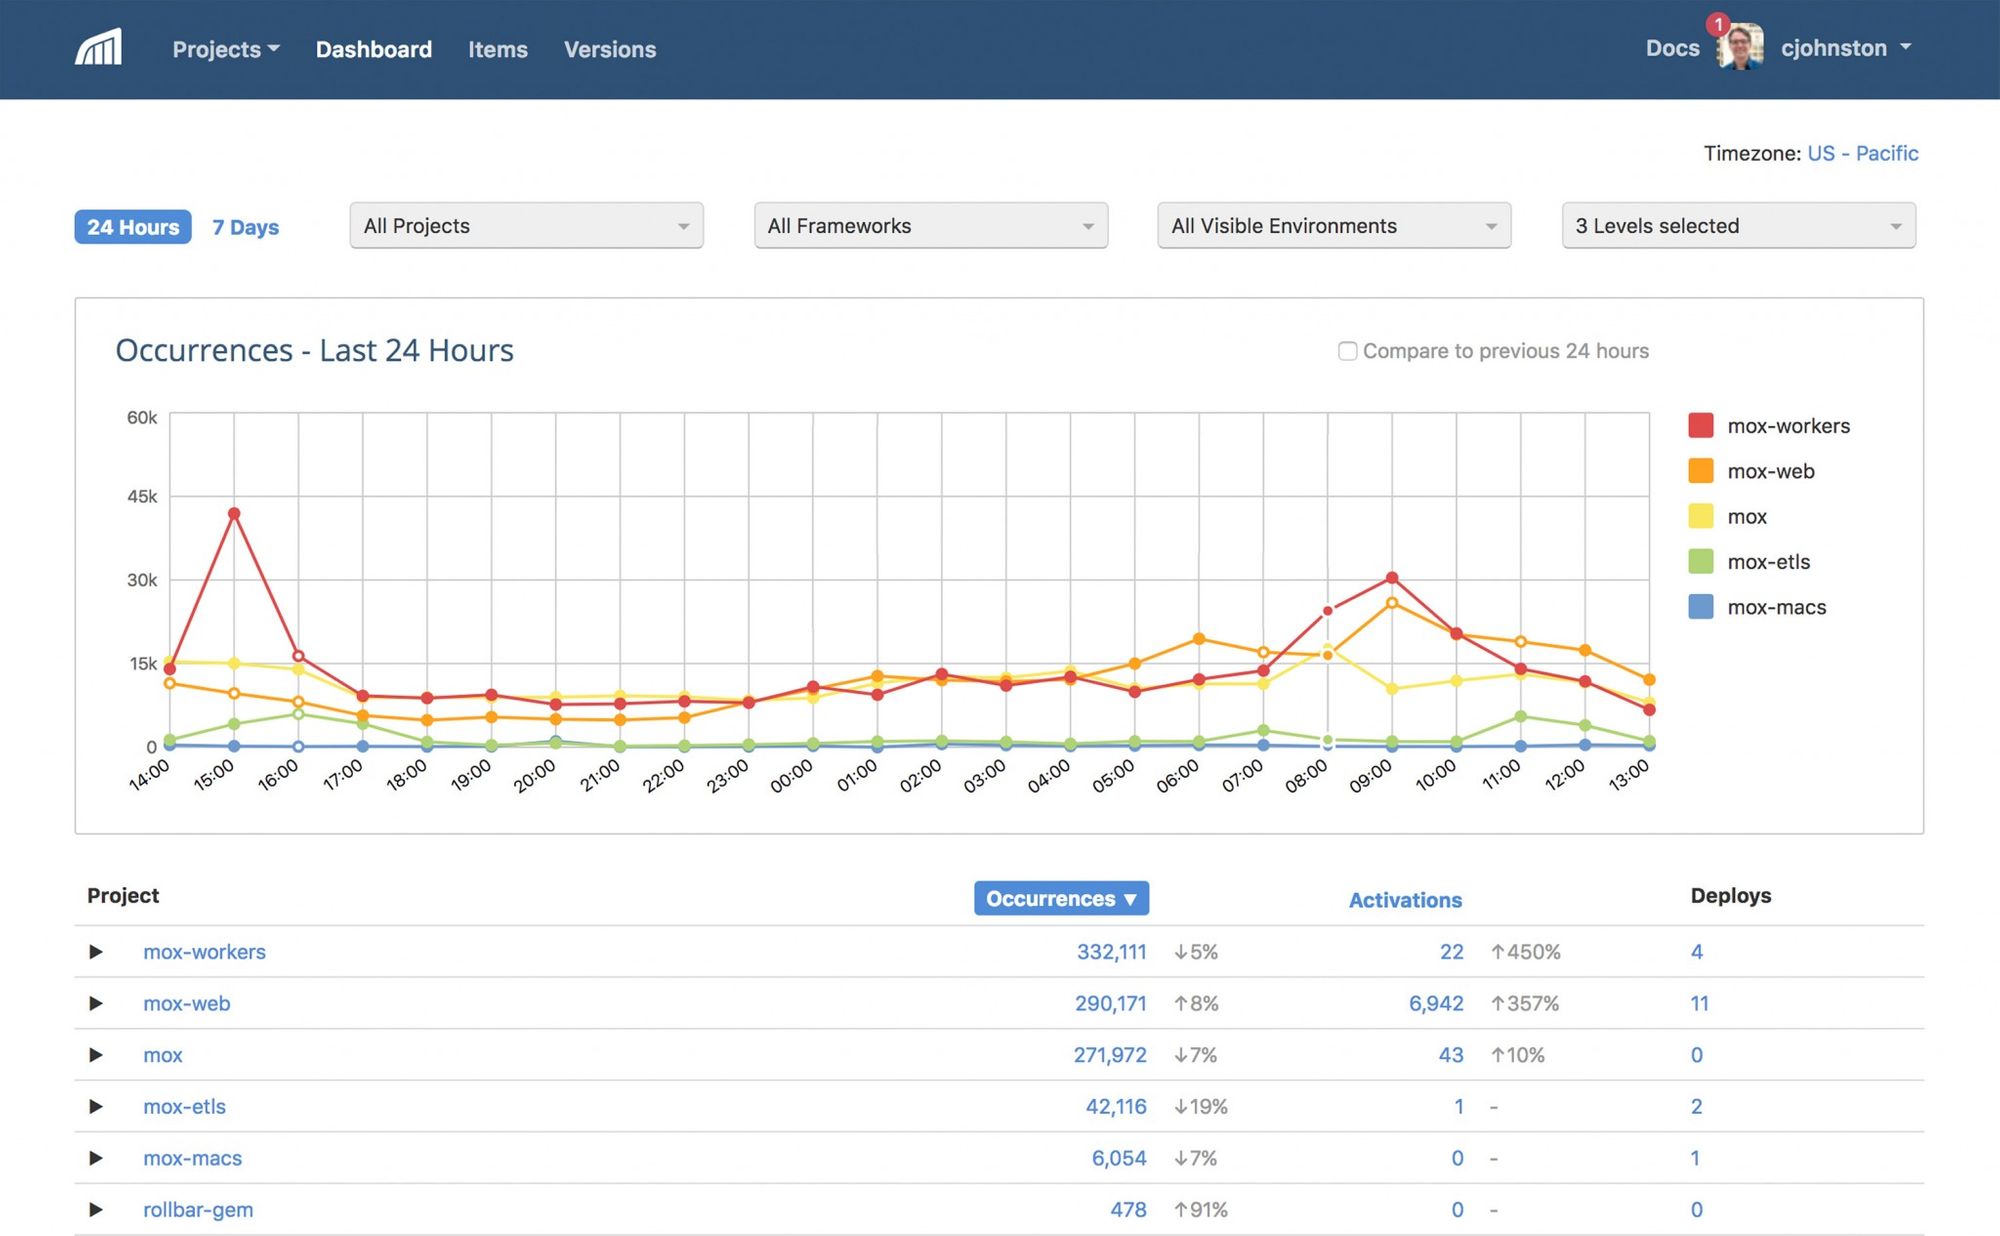
Rollbar is a unique commercial JavaScript debugging and monitoring tool with the main objective of assisting software development teams in producing high-quality products.
Rollbar offers continuous deployment monitoring, fault aggregation, exception reporting, and real-time error reporting for developers. With Rollbar, it serves as your security blanket by spotting errors before they are seen by your users.
JavaScript errors are monitored throughout the software development process, and you will be informed of their location and a suggested resolution. All errors come with thorough information to aid with impact assessment and prioritization.
Additionally, rollbar automatic issue tracking and workflow trigger aid in preventing the unintentional distribution of applications and codes that contain known and unfixed bugs.
Using workflow triggers and automated issue tracking, you can prevent accidentally shipping projects that contain known but unfixed issues. The solution comes with a selection of notification options for prompt and accurate issue reporting as well as the capability to intelligently categorize bug reports for simpler reading.
Features:
- Bug notification tools
- Bug report management
- Error tracking and aggregation
- Free with premium options
- Workflow/VCS integration
Rollbar has enough fundamental functionality to get you started, especially if you're working in a small development team, and it's free for up to 25,000 error events.
The premium plans comprise the Essentials plan, which has a monthly fee of $21 and covers up to 50,000 error incidents. The Advanced plan supports a multi-project feed with combined monitoring and up to 100k error occurrences.
#6 Bugsnag
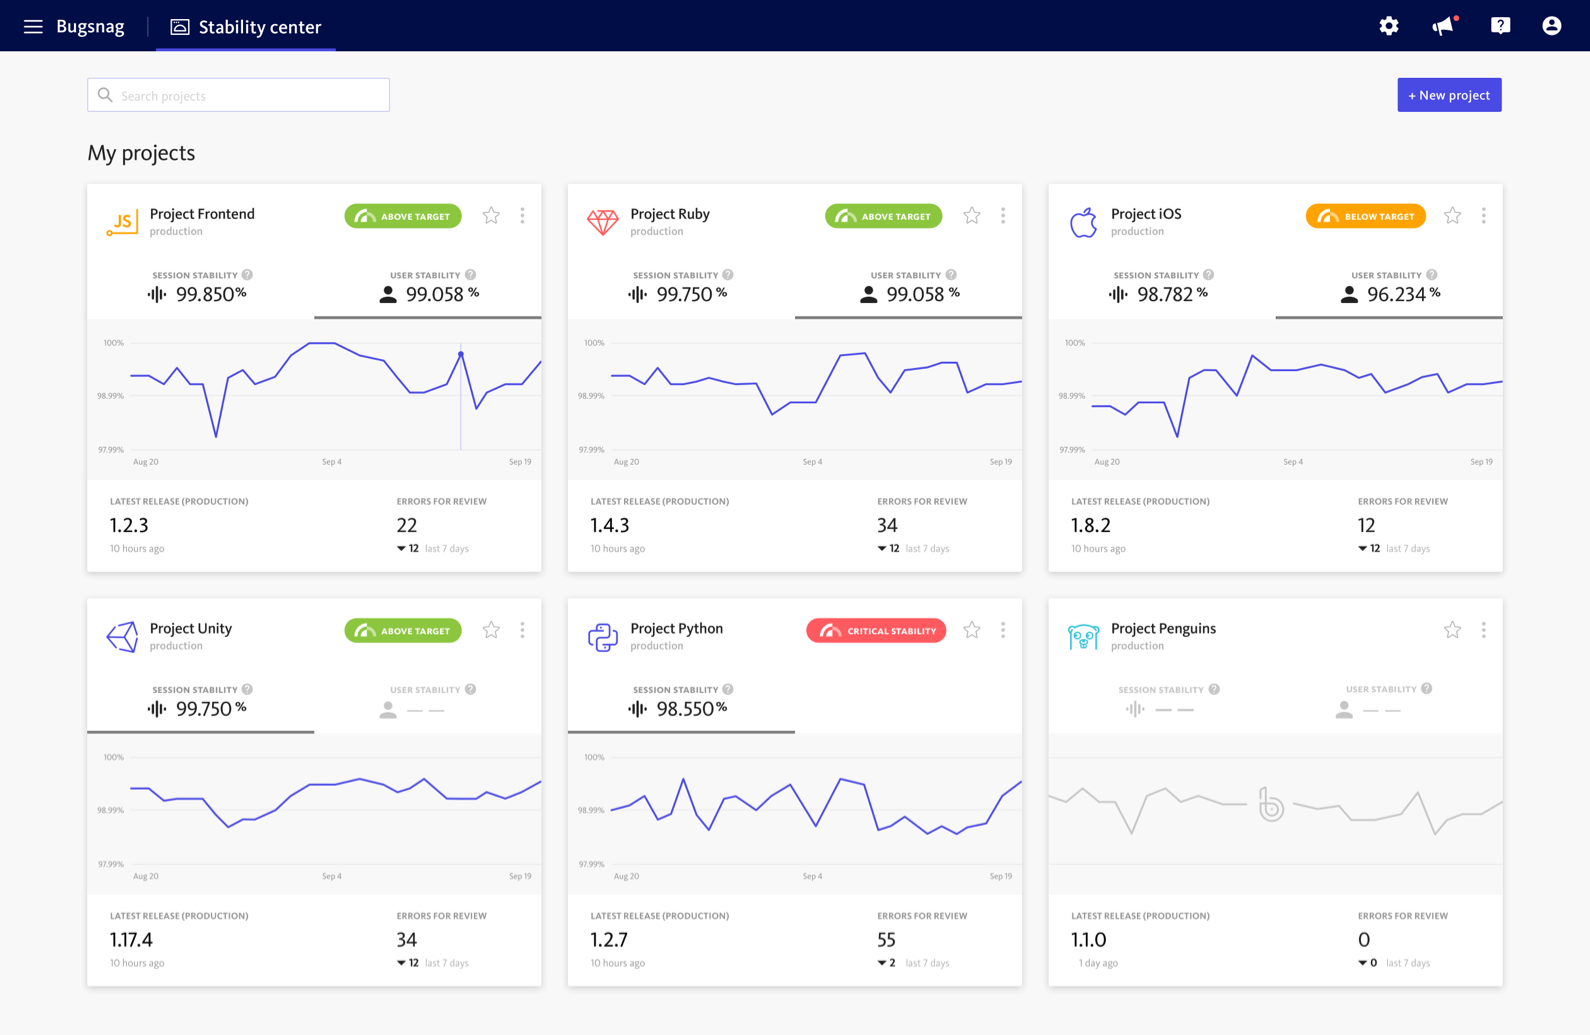
Bugsnag offers to monitor and debug JavaScript applications. It provides cross-browser monitoring and automatically identifies script issues, and error grouping.
React, Vue, and Angular are three JavaScript frameworks that are supported along with error-reporting libraries. These libraries hook into the frameworks' error handlers and report particular data.
Additionally, for browser, OS, user, and other filters, Bugsnag provides multi-dimensional filtering capabilities. Furthermore, it provides automatic diagnostics, stack tracing, source mapping, breadcrumb gathering, and version benchmarking. Both SaaS and self-hosted deployment options are available from Bugsnag.
It includes plugins for React, Vue, Angular, Express, Restify, and Koa as well as Node.js and React Native, which all instantly identify JavaScript issues in the browser. You will receive real-time error notifications, comprehensive diagnostic reports, and cross-platform error detection for both handled and unhandled issues.
Features:
- Custom filters
- Error grouping
- Error status and actions
- Feature flags & experiments
- Pivot table
- Releases & versions
- Search & segmentation
- Single sign-on (SSO)
Bugsnag provides a free 14-day trial period with unlimited access to all standard features. Bugsnag offers only one option, Pro, which costs $59 per month. You can also contact them for an enterprise plan with premium support.
#7 GlitchTip
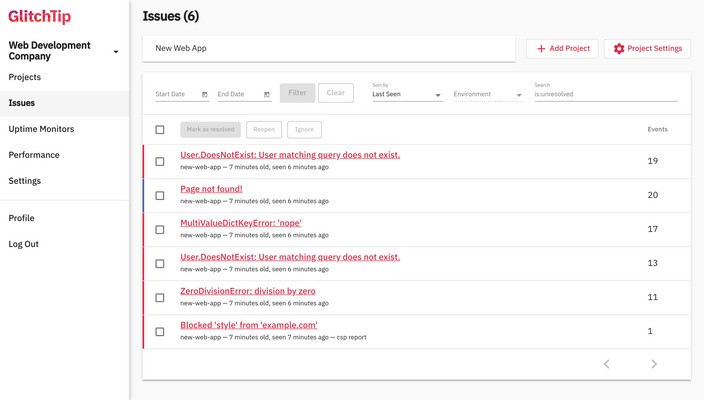
GlitchTip is an open-source bug-reporting tool that collects and displays problem reports in a readable, fixable format. Although it still functions with Sentry's open SDK, the solution appears to have been created in response to Sentry's decision to stop supporting open-source software.
The tool is open-source so you can host it locally, but the company also offers hosting options. Additionally, it outperforms competitive products because of its open-source nature, which gives it a wider user base than other competitive products. Although GlitchTip is still in its infancy, it could be the perfect solution for small businesses or low-budget projects that demand open-source.
Performance monitoring is no longer in beta for GlitchTip. With the use of an open-source sentry SDK client, application performance can now be tracked. GlitchTip will categorize the transactions in your JavaScript app (such as HTTP requests, background processes, and database calls) and allow you to see which ones are taking the longest to complete.
Future improvements will make it simpler to view a transaction's specifics and filter on "spans," which will let customers see crucial statistics like their slowest database queries.
Features:
- Bug aggregation
- Integration with Sentry SDK
- Performance monitoring
- Self-hosting options
GlitchTip is open-source and totally free when self-hosted. Additionally, their hosted platform is free to use for up to 1000 events. In addition to the free hosted option, they also provide services for small, medium, and large businesses.
The Small package, which supports up to 100k events, costs $15 per month. The Medium package, which supports up to 500k events, costs $50 per month. The Large package, which supports up to 3 million events and costs $250 a month, is the last option.
JavaScript Debugging Tools
JavaScript debugging tools are essential for any software developer or engineer. They help us find and fix errors in our code, so that our programs can run correctly. There are many different JS debugging tools available, and each has its own strengths and weaknesses.
Let's take a look at some of the most popular JavaScript debugging tools, and see how they can help us find and fix errors in our code.
#1 JS Bin
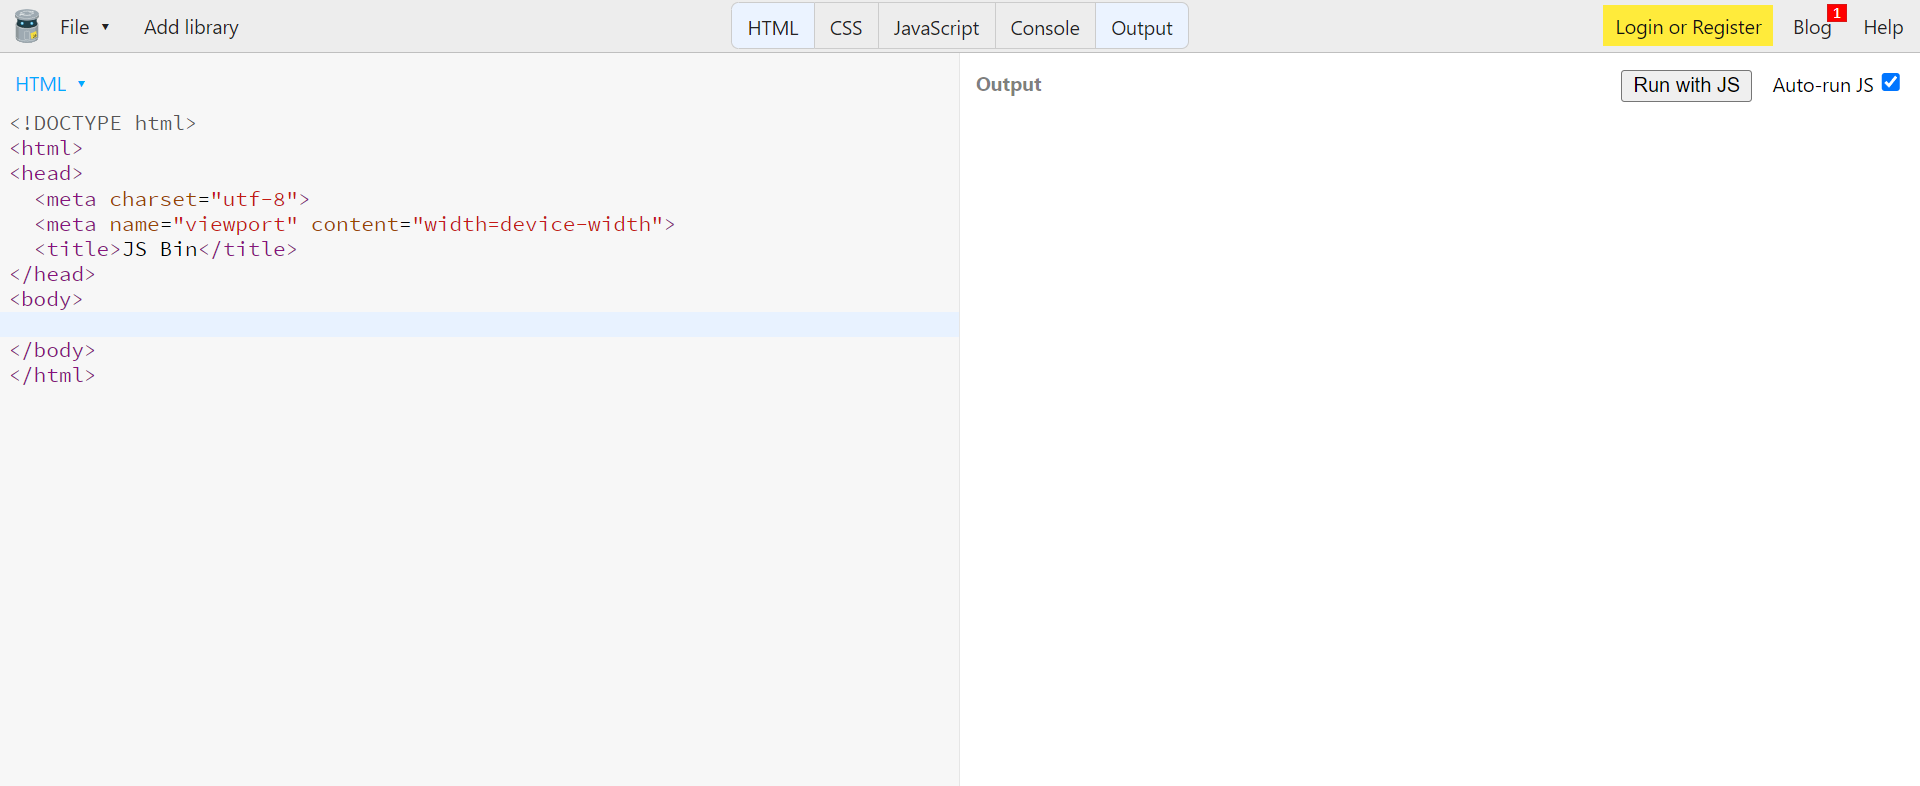
A simple and cost-free JavaScript debugging tool is JS Bin. It offers few functions, though, and has no reliable monitoring capabilities. However, for small or solitary JavaScript developers who only need to rapidly verify their code, this tool is perfect due to its simplicity, debugging capabilities, and lack of associated fees.
It was created primarily to assist JavaScript and CSS users in testing code snippets in a context and debugging the code together on the JS Bin website. One of the best JavaScript collaborative debugging tools available is JS Bin.
You can test and troubleshoot scripts side by side with other users. You and anyone watching your bin will be able to see the output being generated in real-time as you type into one of the editor "panels."
The tool's collaborative features let several developers work together on the same code. However, technically speaking, unless you pay a price for a "private bin," your code is available to everyone. The project is totally open-source and relies on donations and Pro subscriptions for the majority of its funding.
Features:
- Collaborative features
- Dropbox backup sync
- GitHub exporting tools
- JavaScript debugging suite
- Templating features
JS Bin is a totally free and open-source tool. A Pro subscription is offered for $126 per year or $16 monthly. Any capacity restrictions are removed with the Pro edition, and private workspaces for secure collaboration are also added.
#2 ESLint
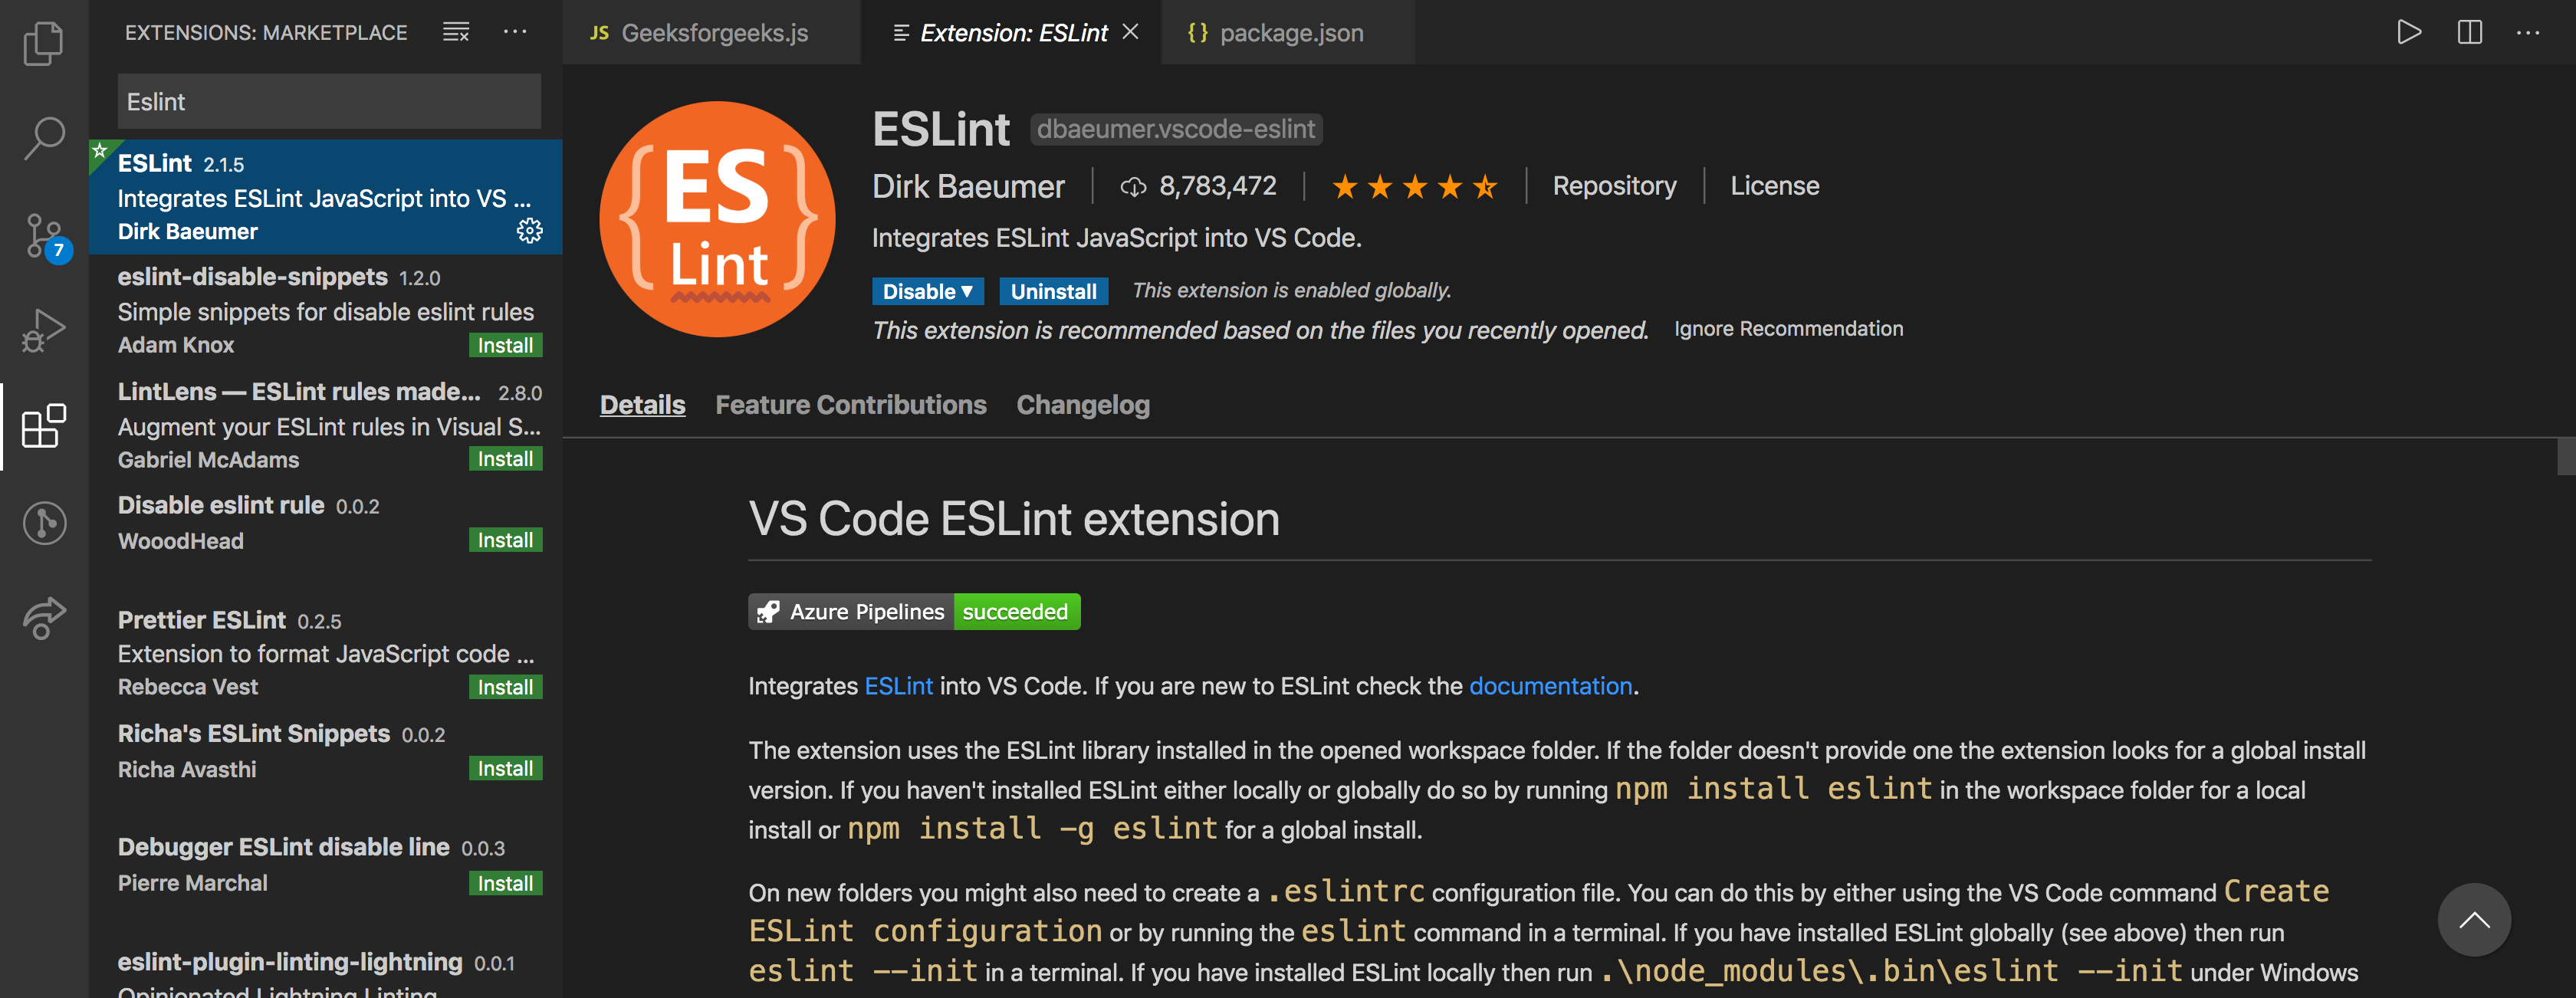
ESLint is an open-source tool to identify and correct errors in your JavaScript code. As its name suggests, ESLint is a JavaScript linting tool—a static code analysis tool—that is used to highlight coding errors, bugs, stylistic errors, and suspicious constructs. To make code more dependable and prevent problems, ESLint addresses both coding style and quality issues.
ESLint is the most popular JavaScript linter as of 2021. ESLint was primarily developed to enable developers to design their own linting rules. It is intended to have fully pluggable and adjustable rules.
It is a powerful JavaScript linter that scans your code as you type to find syntax errors and catch typos. This tool removes some of the frustrating, simple, and difficult-to-find problems like typos and bracket errors.
Features:
- Avoids finding and replacing problems and complications
- Built into most text editors to integrate
- Enables the preprocessing of your code
- Provides the flexibility
- Statistically analyzes
- Supports custom parsers
- Works well on Windows, Mac, and Linux
ESLint is an open-source project that aids in identifying and resolving issues with JavaScript code. ESLint can help your code live its best life whether you're writing JavaScript in the browser or on the server, with or without a framework.
#3 Chrome Developer Tool
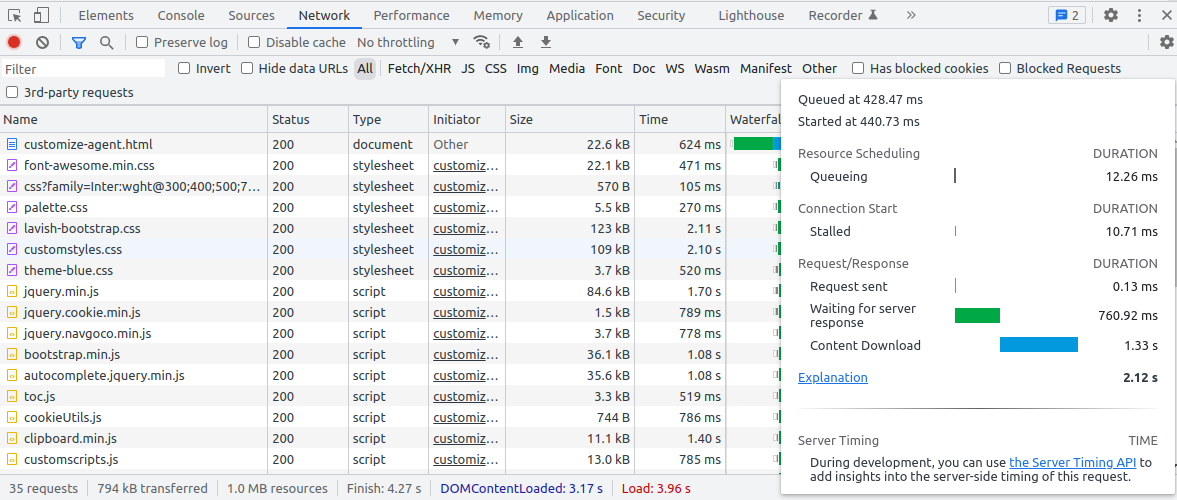
The Chrome Developer Tool is another powerful tool for finding bugs. Many developers use it to inspect JavaScript and debug code that is running remotely or locally in Google Chrome.
It provides a variety of web development tools that are useful for examining cookies, errors, missing features, and the responsiveness and layout performance of the site.
The Chrome development tools' best features were previously incorporated into the browser. As a result, all of its tools are still available, just not as a separate plugin. Free-to-use software called the Chrome Developer Tool runs tests step-by-step to find problems and fix errors.
Features:
- Allows debugging worker threads
- Allows developers to pause code execution
- Analyze the site’s responsiveness
- Debug code running locally or remotely
- Easy to search and access pages
- Enables developers to visualize different aspects
- Track web pages and make changes
It is totally free. There is no charge for using it. You can view and debug JavaScript in Chrome's developer tools by pressing Shift-Ctrl-I.
#4 Selenium
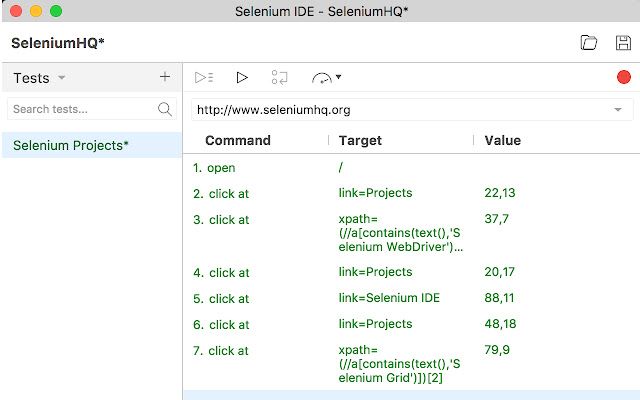
Selenium is an open-source testing framework that assists you in lowering the number of bugs by automating JavaScript web testing. Selenium offers a simple framework with no user interface and needs proficient underlying programming skills.
Web automation testing, a development IDE for test scripts, and a central management hub are Selenium's three primary features. Various CI/CD solutions come fully integrated and with all necessary features for free.
Features:
- Browser interaction record-and-playback
- Development IDE
- Multi-environment management
- Open-source and free
- Scripted web automation testing
Selenium can be downloaded for free. The web automation testing toolkit Selenium Webdriver includes JavaScript functionality. Selenium IDE's script creation platform supports Chrome, Firefox, and Edge, which also integrates with browsers.
The management and multi-environment orchestration platform, Selenium Grid, must be deployed on a central server to function. Selenium Grid is not required for your CI/CD pipeline, but it will probably be beneficial for the entire integration.
Conclusion
A large number of web apps and websites currently use JavaScript, one of the most widely used scripting languages. Testing the code, spotting errors, and fixing them as soon as possible are vital because it plays a crucial role in the performance and dependability of an application.
Developers switch to monitoring and debugging tools for your JavaScript project to find and fix code errors and other issues. Make sure to verify that the tool includes clever debugging facilities and error-reporting features before choosing one for your project.
- Atatus
- Sentry
- Raygun
- Rollbar
- Airbrake
- ESLint
- Bugsnag
- Chrome Developer Tools
- JS Bin
- Selenium
- Glitchtip
Error detection and correction are made simple by the tools mentioned above. We sincerely hope that this has helped you choose the best tool for your business.
Monitor Your Entire Application with Atatus
Atatus is a Full Stack Observability Platform that lets you review problems as if they happened in your application. Instead of guessing why errors happen or asking users for screenshots and log dumps, Atatus lets you replay the session to quickly understand what went wrong.
We offer Application Performance Monitoring, Real User Monitoring, Serverless Monitoring, Logs Monitoring, Synthetic Monitoring, Uptime Monitoring, and API Analytics. It works perfectly with any application, regardless of framework, and has plugins.

Atatus can be beneficial to your business, which provides a comprehensive view of your application, including how it works, where performance bottlenecks exist, which users are most impacted, and which errors break your code for your frontend, backend, and infrastructure.
If you are not yet an Atatus customer, you can sign up for a 14-day free trial.
#1 Solution for Logs, Traces & Metrics
![]() APM
APM
![]() Kubernetes
Kubernetes
![]() Logs
Logs
![]() Synthetics
Synthetics
![]() RUM
RUM
![]() Serverless
Serverless
![]() Security
Security
![]() More
More

![Application Performance Monitoring (APM) Guide: Monitor and Optimize Application Performance - [2026 Update]](/blog/content/images/size/w960/2025/10/APM-GUIDE---Monitor-and-Optimize-Application-Performance.png)