9 Top Frontend Application Monitoring Tools to Catch Errors in 2025
Most developers are familiar with the concept of tracking an application's performance. We've all had to undertake our performance debugging at some point. It typically occurs when there is a significant problem with potential cost or user impact. We don't take the time to examine the application's performance in various scenarios till after that.
Of course, you can and should monitor various components of the application separately. Most people divide an application's frontend and backend components, so we'll do the same to save time. Frontend application monitoring and the tools you can use to do it will be the main topics of this article.
To help you in getting started, we've analyzed some of the top frontend application monitoring SaaS below.
Frontend Application Monitoring
The process of tracking errors, resolving them, and maintaining the functionality of web applications is the main goal of frontend application monitoring. It's done to improve user experience by getting rid of any errors that can hurt your application.
Errors can be caught early on, making them simple for your developers to fix. They can then work on debugging and improving the code after that.
Application performance monitoring, or APM, places less focus on server-client communication and more on the user experience. While both are important to monitor, a strong user experience depends on understanding how users interact with your application, which brings me to my next point.
Frontend monitoring tools make it simple and thorough to keep an eye on your applications.
#1 Atatus

Atatus is an observability solution that can monitor deployments, performance, and application errors. It offers end-to-end solutions and is a simple, lightweight tool you can set up and use it right way. As soon as your application encounters an issue, it immediately provides you with an alert.
You will receive a complete picture of all performance metrics necessary to build high-quality, dependable software. You can able to identify who, when, and what triggered the performance bottleneck as soon as an issue emerges.
Real User Monitoring enhances end-user performance by detecting and resolving challenging frontend performance issues like slow page loading, delayed static assets, and ajax queries. You can keep track of and fix issues that affect your customers' experience.
It keeps track of the functionality of your applications and is alerted when there are issues with the user interface. Scores from the Apdex (Application Performance Index) can be used to evaluate user satisfaction as well as frontend and backend performance.
It resolves availability or performance issues before they affect your users. You can send and receive alerts and notifications using any of the several notification channels that Atatus provides.
Features:
- Flexible
- Full transaction diagnostics
- Error Tracking with stacktrace
- Real-time monitoring
- Root-cause diagnosis
- Trace for individual transactions
- Graphs in real-time with Google’s core web vitals
We provide a 14-day no-credit-card free trial. APM plans begin at $0.07 per month, RUM plans at $1.96 per month for 10K views, Log monitoring plans at $2 per month, and Synthetic plans at $1.5 per month.
#2 Sentry
Sentry alerts you when your application crashes or runs slowly and provides performance data, allowing you to delve down into the areas that need your attention. You would fix the issue that ultimately would have resulted in the error rather than the error itself.
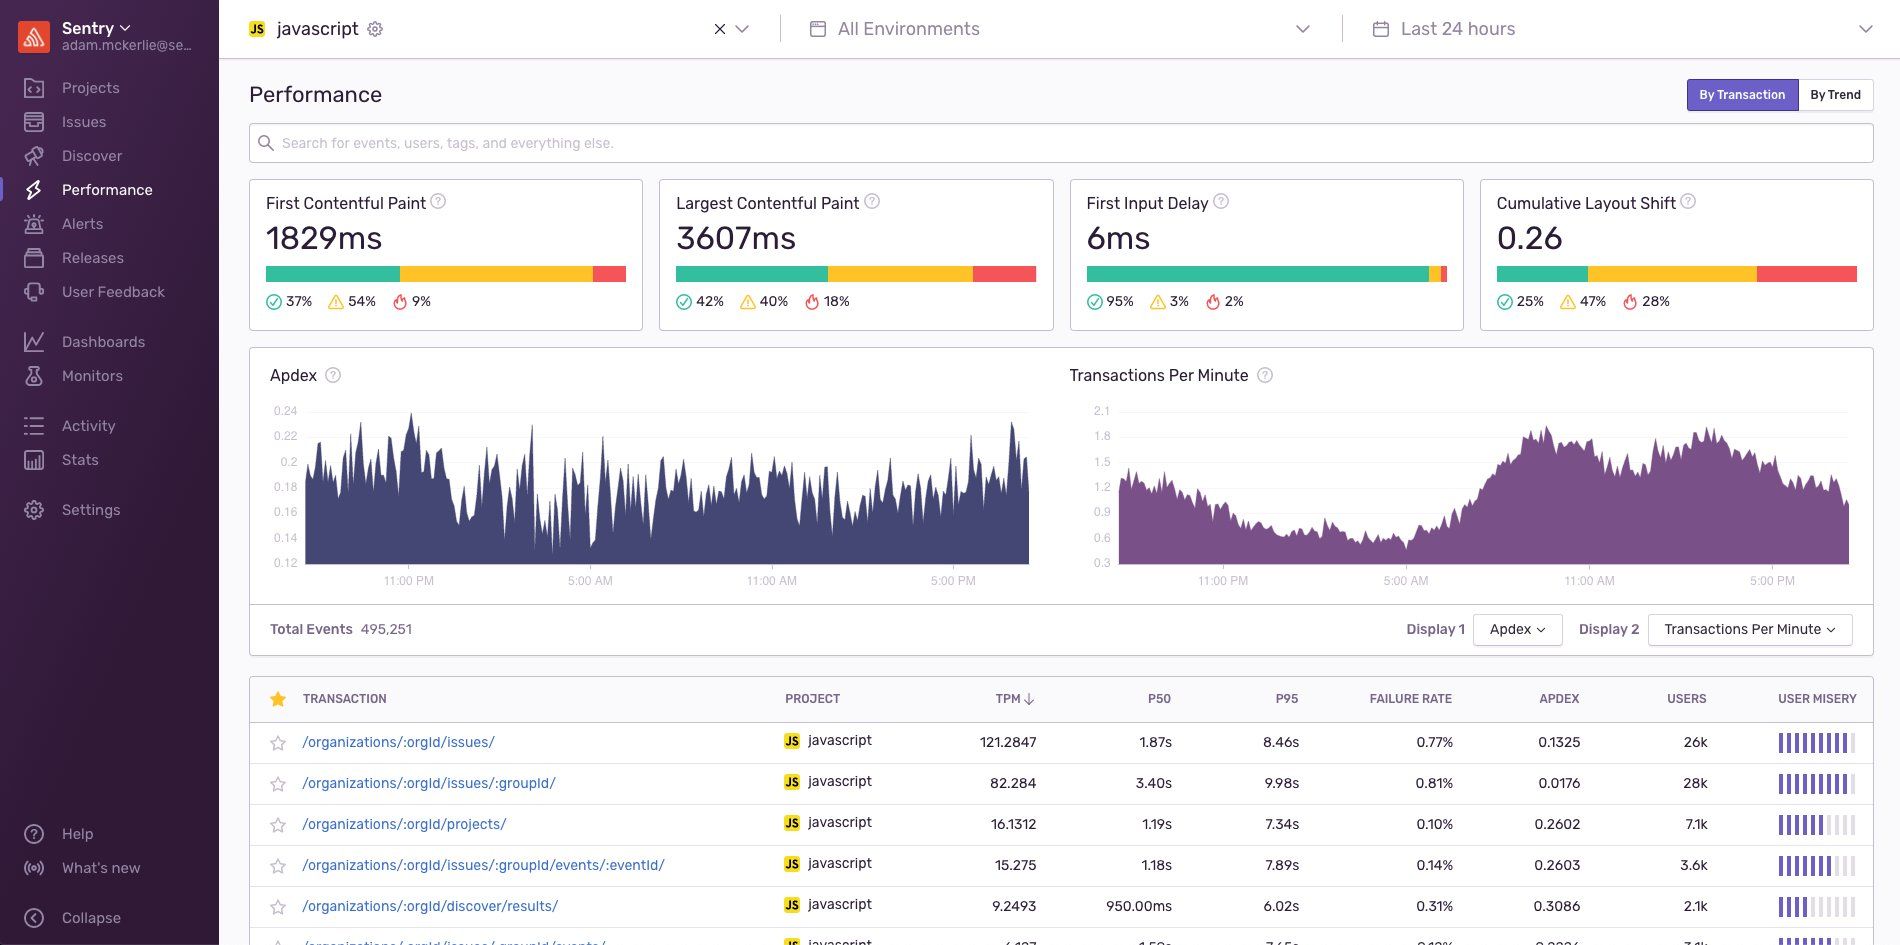
The Apdex score, which is the ratio of both acceptable and satisfactory response times compared to all response times, is displayed in the performance view, which allows you to see how many transactions are being triggered, how long they take, and how many there are overall.
Sentry lacks a server-specific logs integration even though it supports server-side programming languages. You can examine a breakdown of all the resources connected to various transactions by drilling down on them.
This is not a deal-breaker for the majority of people. However, if you're searching for an end-to-end monitoring solution, you might wish there were more options available.
Features:
- Easy installation
- Uses Google’s Web vitals
- Transaction tracing
The most interesting element of Sentry is that it offers a free developer edition that includes the release tracking capability and supports all languages. There are paid versions with additional capabilities for teams ($26 per month), businesses ($80 per month), and enterprises ($customizable).
#3 LogRocket
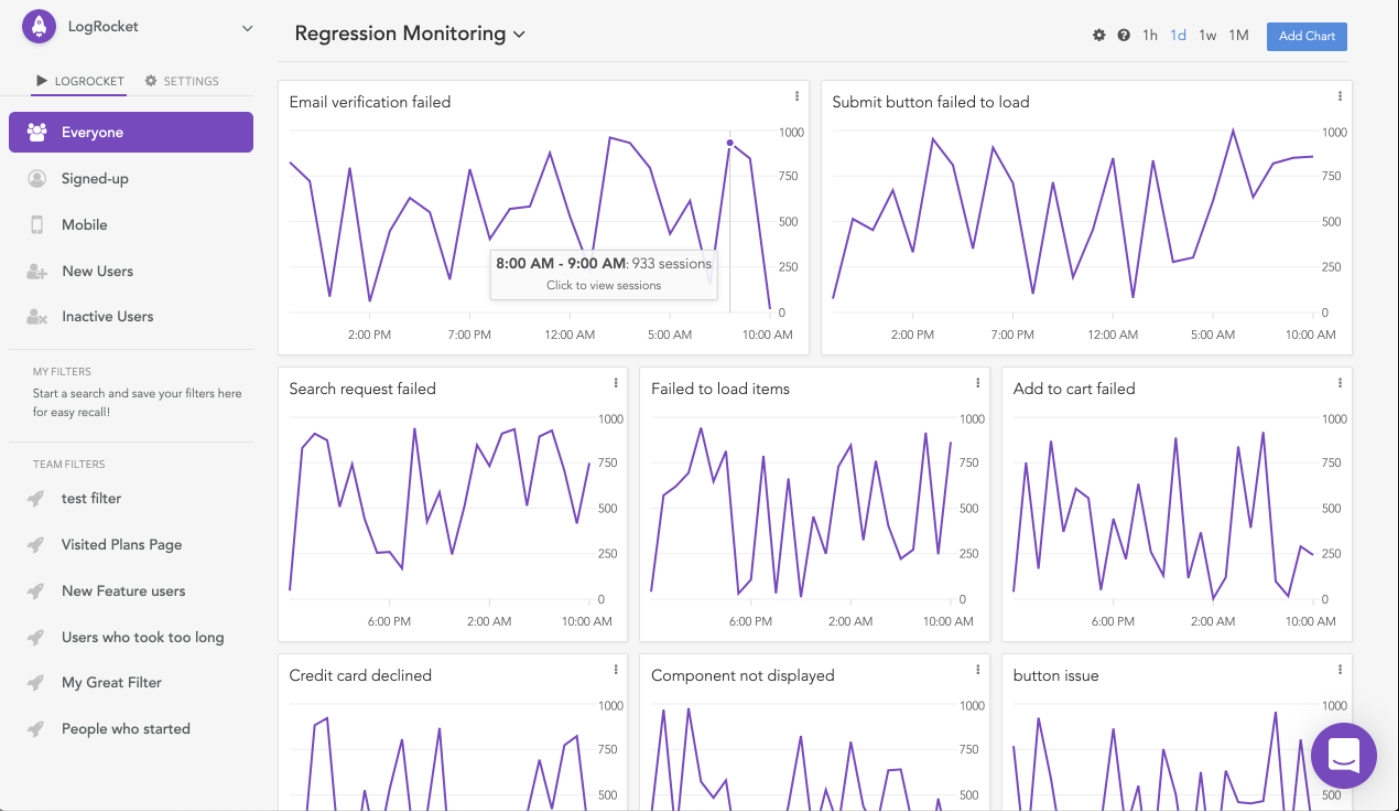
LogRocket enables you to rewind user sessions so you can see a replica of everything your users are seeing in real-time. Therefore, if your user encounters any issues, you can address them right away without requesting logs or screenshots.
Along with JavaScript errors and console logs, you can also look at the state and activities that took place at a certain moment. It displays the problematic bugs and errors as well as how to correct them.
You can track IP addresses and user agents for each session with LogRocket, which helps determine what browser users are using and diagnose issues particular to that browser. Custom properties can be added to logs, enabling the creation of user-value pairs that provide more information about users and sessions.
Within an hour, you can start running LogRocket on your servers or through Google Cloud Platform, Amazon Web Services, or Microsoft Azure. They provide SDKs for many technologies and enable interaction with tools like Salesforce, JIRA, Zendesk, GitHub, and more.
Features:
- DOM elements
- Intercom and Zendesk support
- Video playback
There are three plans available to pick from if you want to start using LogRocket: developer, team, and professional. The team subscription costs 99 USD per month for 10000+ sessions, while the developer plan is free and enables 1,000 sessions per month and 30-day data retention. You can adjust the features in the professional plan by your demands.
#4 Sematext
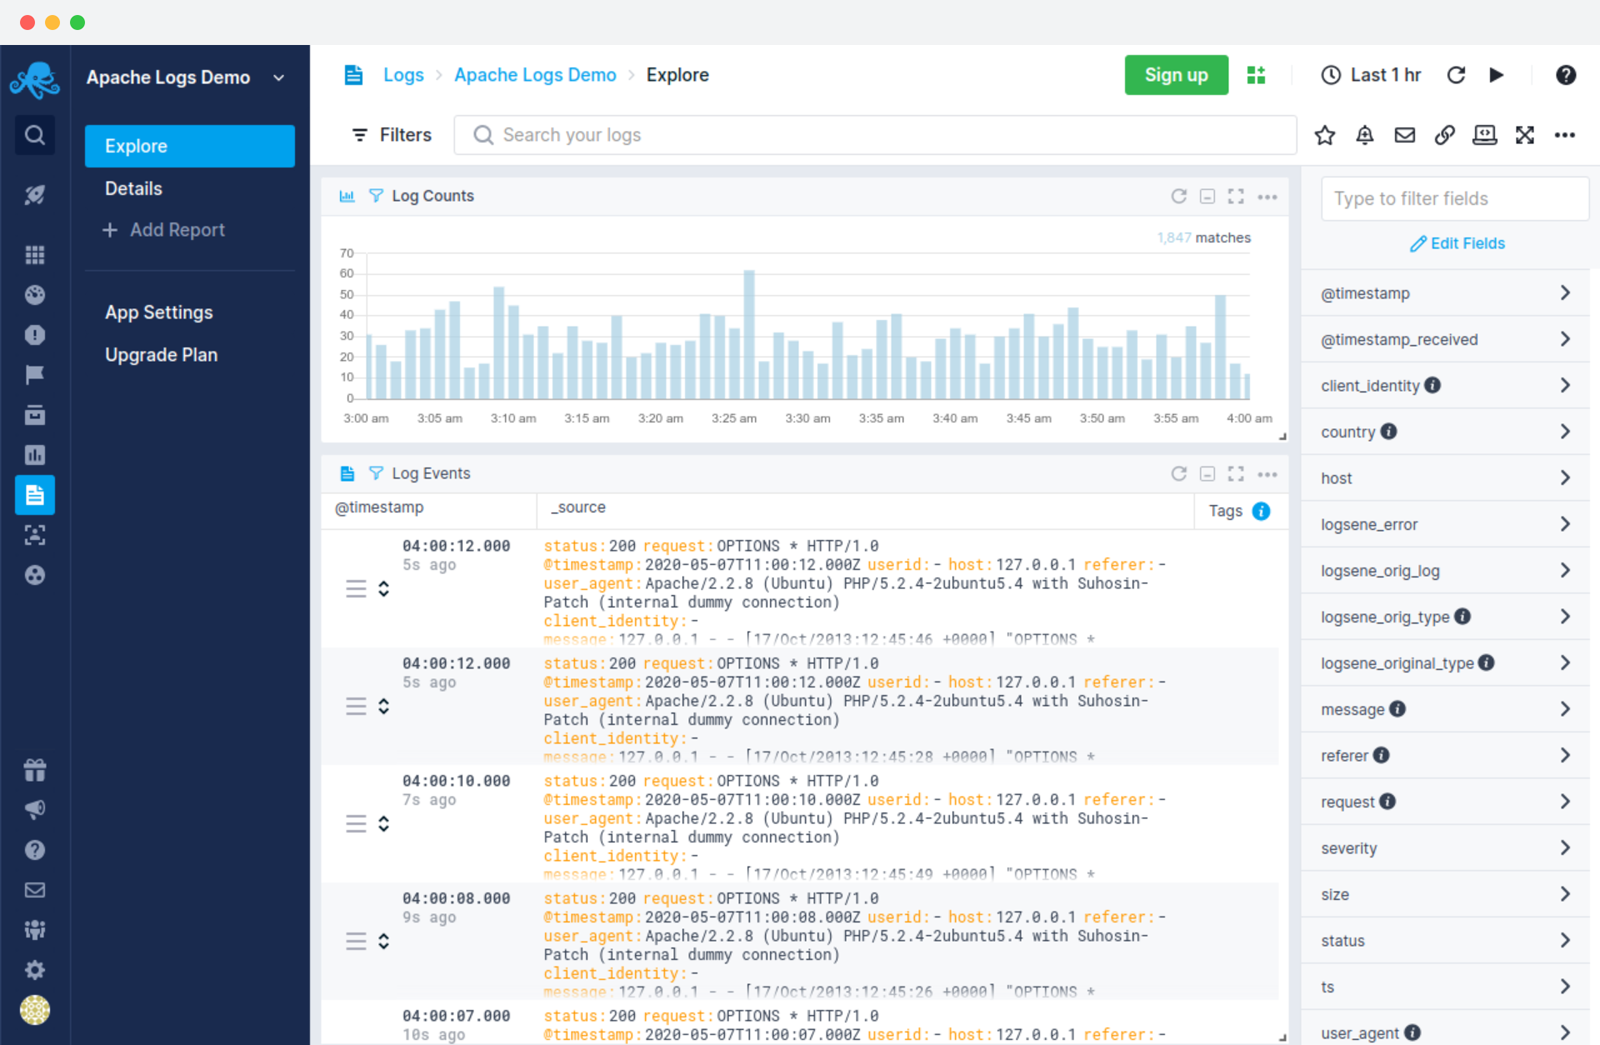
Another useful frontend monitoring tool is Sematext Cloud. It provides a wide range of tools to help you in performance and availability monitoring, issue debugging, and keeping a close eye on your infrastructure.
Using the synthetic monitoring tool, you can design complex monitors for each of your resources. Additionally, each resource has a pinging frequency range of 10 minutes to an hour from multiple locations. Your website's loading times, error rates, SSL certificates, API availability, and other metrics will be reported.
Furthermore, with the addition of Sematext Experience, Sematext is now your go-to tool for reports on the experience and satisfaction of your users as well as for providing important details about how your website or application is performing in various locations, various devices, or with various connection speeds.
Sematext has two solutions built specifically for frontend performance monitoring, but one of its key differentiators is that it also has Sematext Logs. When you are attempting to troubleshoot the various performance issues and errors you could run into, this is helpful.
Features:
- Real-time alerts
- Support for all major frameworks
- Well documented
Sematext is a must because it offers a 14-day trial, monthly pricing that starts at $9 for Sematext Experience, $29 for Synthetics, and a pay-as-you-go option that costs as little as $2 per monitor.
#5 Pingdom
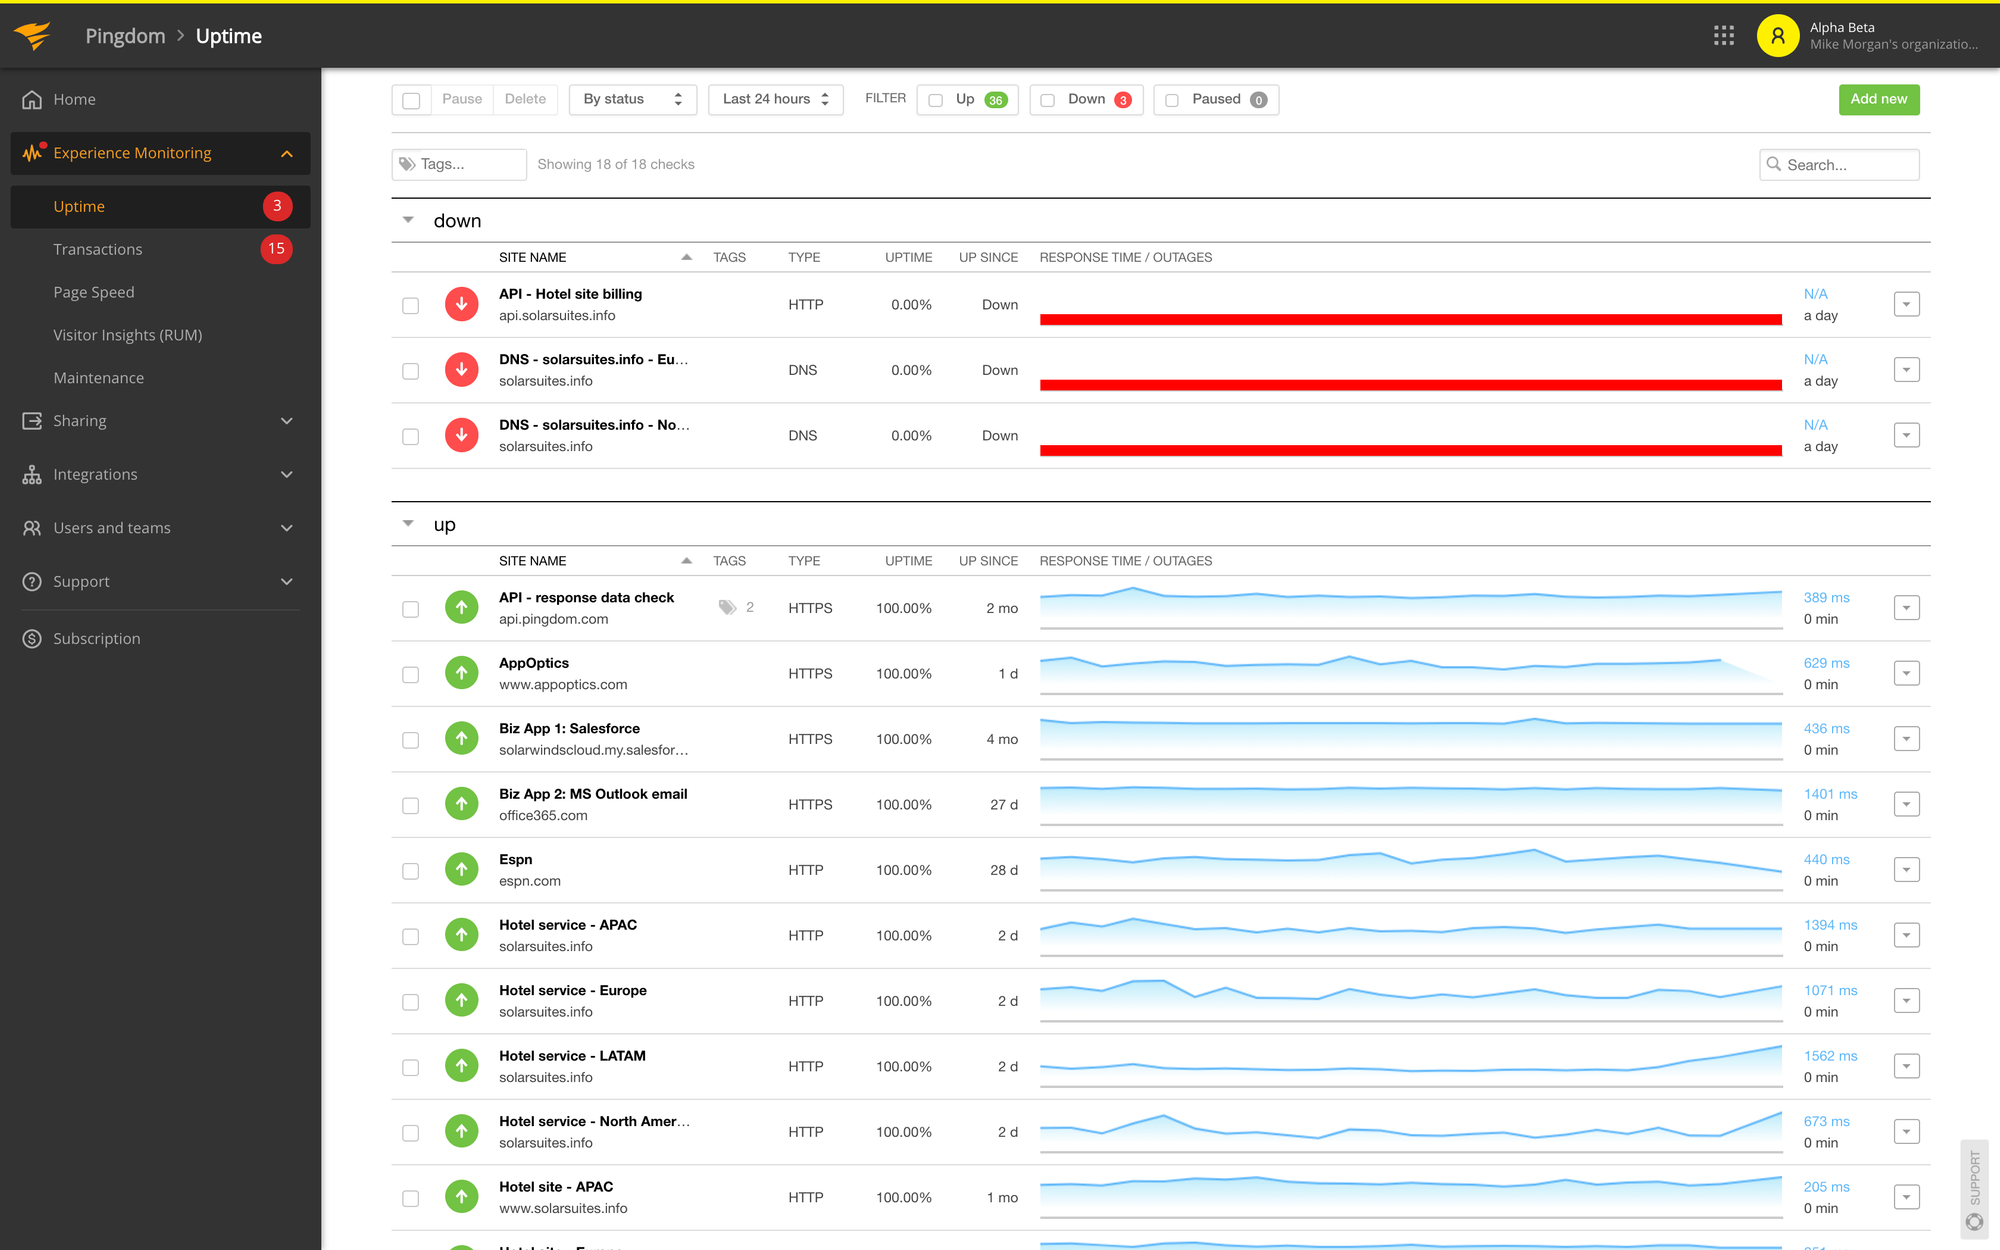
Pingdom is an uptime monitoring service with a variety of features, including SSL monitoring, uptime monitoring, real-user monitoring, and many others. Pingdom will alert you if a service interruption or degradation is using a configurable alerting system.
You can find out how long it takes for a page or resource to fully load using the uptime monitoring view. If an error happens, you can use their incident reports manager to go into the transaction and find the issue's source.
Pingdom will notify you anytime something goes wrong. You can choose who receives these alerts and how many times you want to be reminded, and you can customize them. Assigning the appropriate individual to the job will go much more quickly as a result. You can arrange recurring reports on the condition of your website.
When it comes to performance data, the page speed section is where you should turn to get all the specifics you need about your websites, such as load time, page size, number of requests, and a performance score that will give you a quick overview of how well it is performing overall.
Features:
- Real user monitoring
- SMS and email notifications
- Customizable alerts
Pingdom offers a 14-day free trial and pro plans with up to 10 uptime monitors, 1 advanced monitor, and 50 SMS notifications for $15 per month for synthetic monitoring and $15 per month for real user monitoring of 100K page visits.
#6 Site24x7
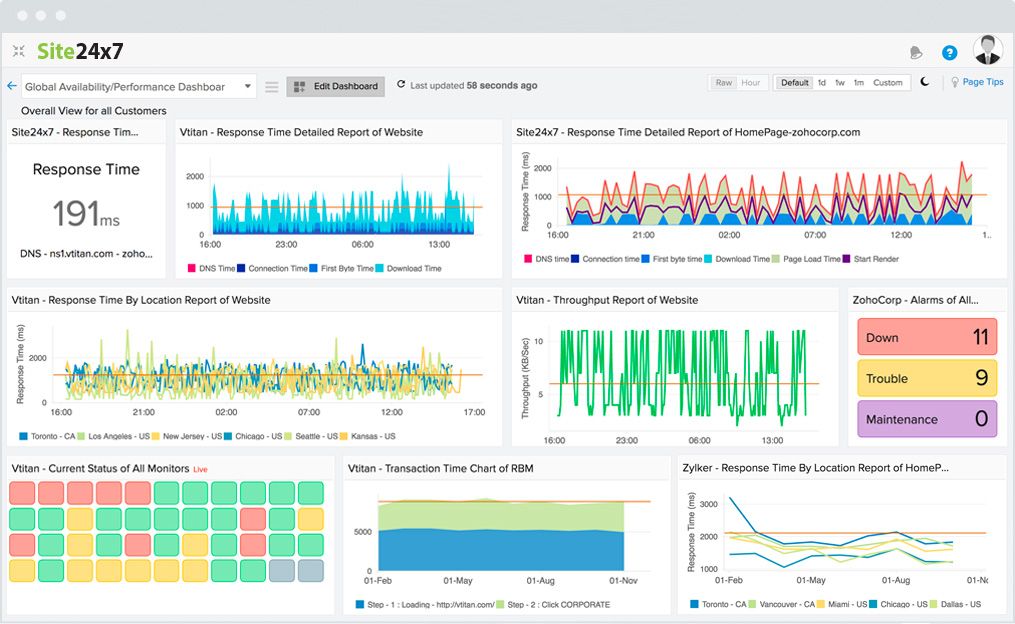
A different option to see how your project or application performs in the real world is Site24x7.
Site24x7, which describes itself as a solution for availability and user experience monitoring, has a good number of cool features, including server monitoring, cloud management, RUM, and more.
When it comes to frontend performance monitoring, Site24x7 has a web section where you can set up monitors for your websites or APIs. These monitors will ping the resource you choose to gather information about its availability, response time, downtimes, etc.
Additionally, Site24x7 will keep track of SLA compliance in their REST API section, which is helpful. This view provides information on throughput and reaction times, as well as a breakdown of your availability and response times by location and history of all breakdowns.
Additionally, Site24x7 keeps track of the expiration of your domain, SSL, and TLS certificates and notifies you anytime one of them does.
Features:
- API transaction monitoring
- Real user monitoring
Site24x7 offers a 30-day trial period without requesting a credit card and offers four options with monthly prices ranging from $10 to $499.
#7 Raygun
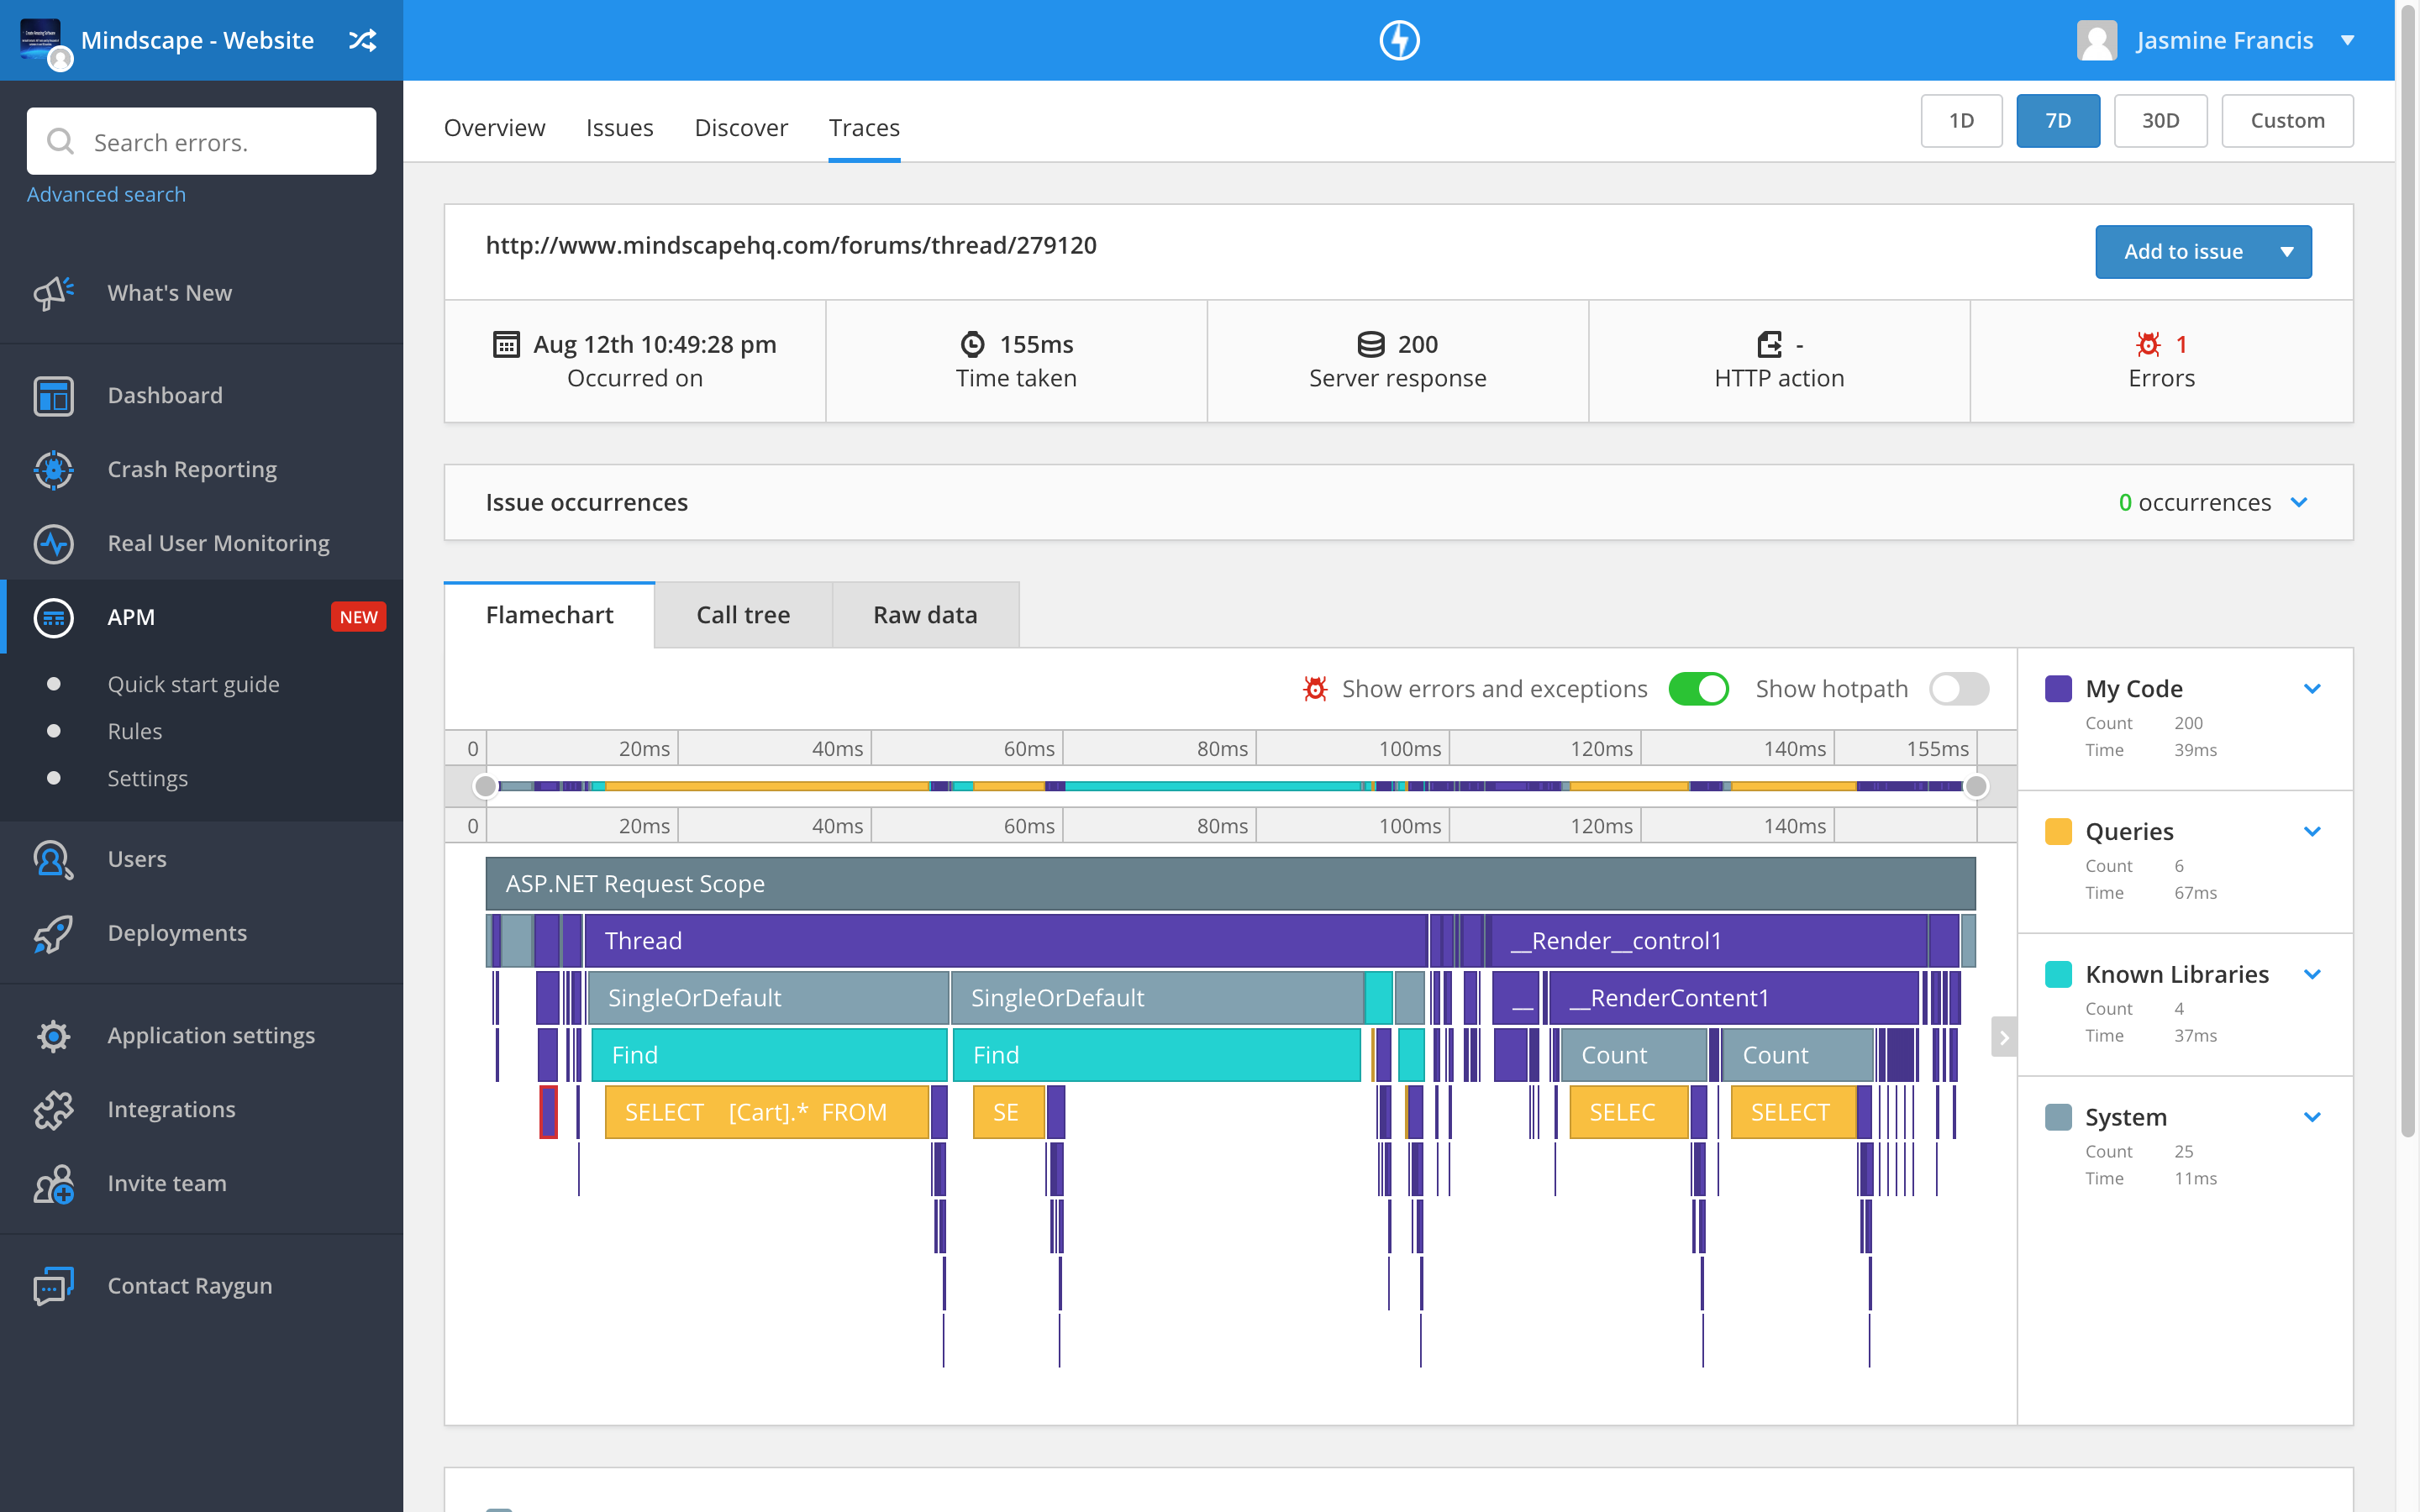
With Raygun, you can find useful information from your website and use it to identify and fix performance bottlenecks. This will improve frontend performance and make it simple to diagnose poor user experience.
Raygun's real user monitoring platform will be your primary tool for identifying frontend issues if your goal is to solve performance issues with the software. By gathering data on things like page speed, load times, the number of current sessions, and active users, their lightweight JavaScript SDK keeps an eye on every aspect of your website.
A thorough resource waterfall for each page load shows you how each asset is broken down and how it affects frontend performance. The performance issues can then be extrapolated, giving you a better idea of how to address them.
Although Raygun lacks a log management system, the Error view does offer information such as the whole stack trace, environment, browser, OS, host, and more.
Features:
- Real user monitoring
- User-friendly application
- 3rd party integrations
APM, which starts at $8/month and includes 10K traces, Real User Monitoring, which starts at $8/month and includes 10K sessions, and Error Monitoring and Reporting, which costs $4/month. Additionally, you can use their 14-day free trial to try out all of their features.
#8 AppSignal
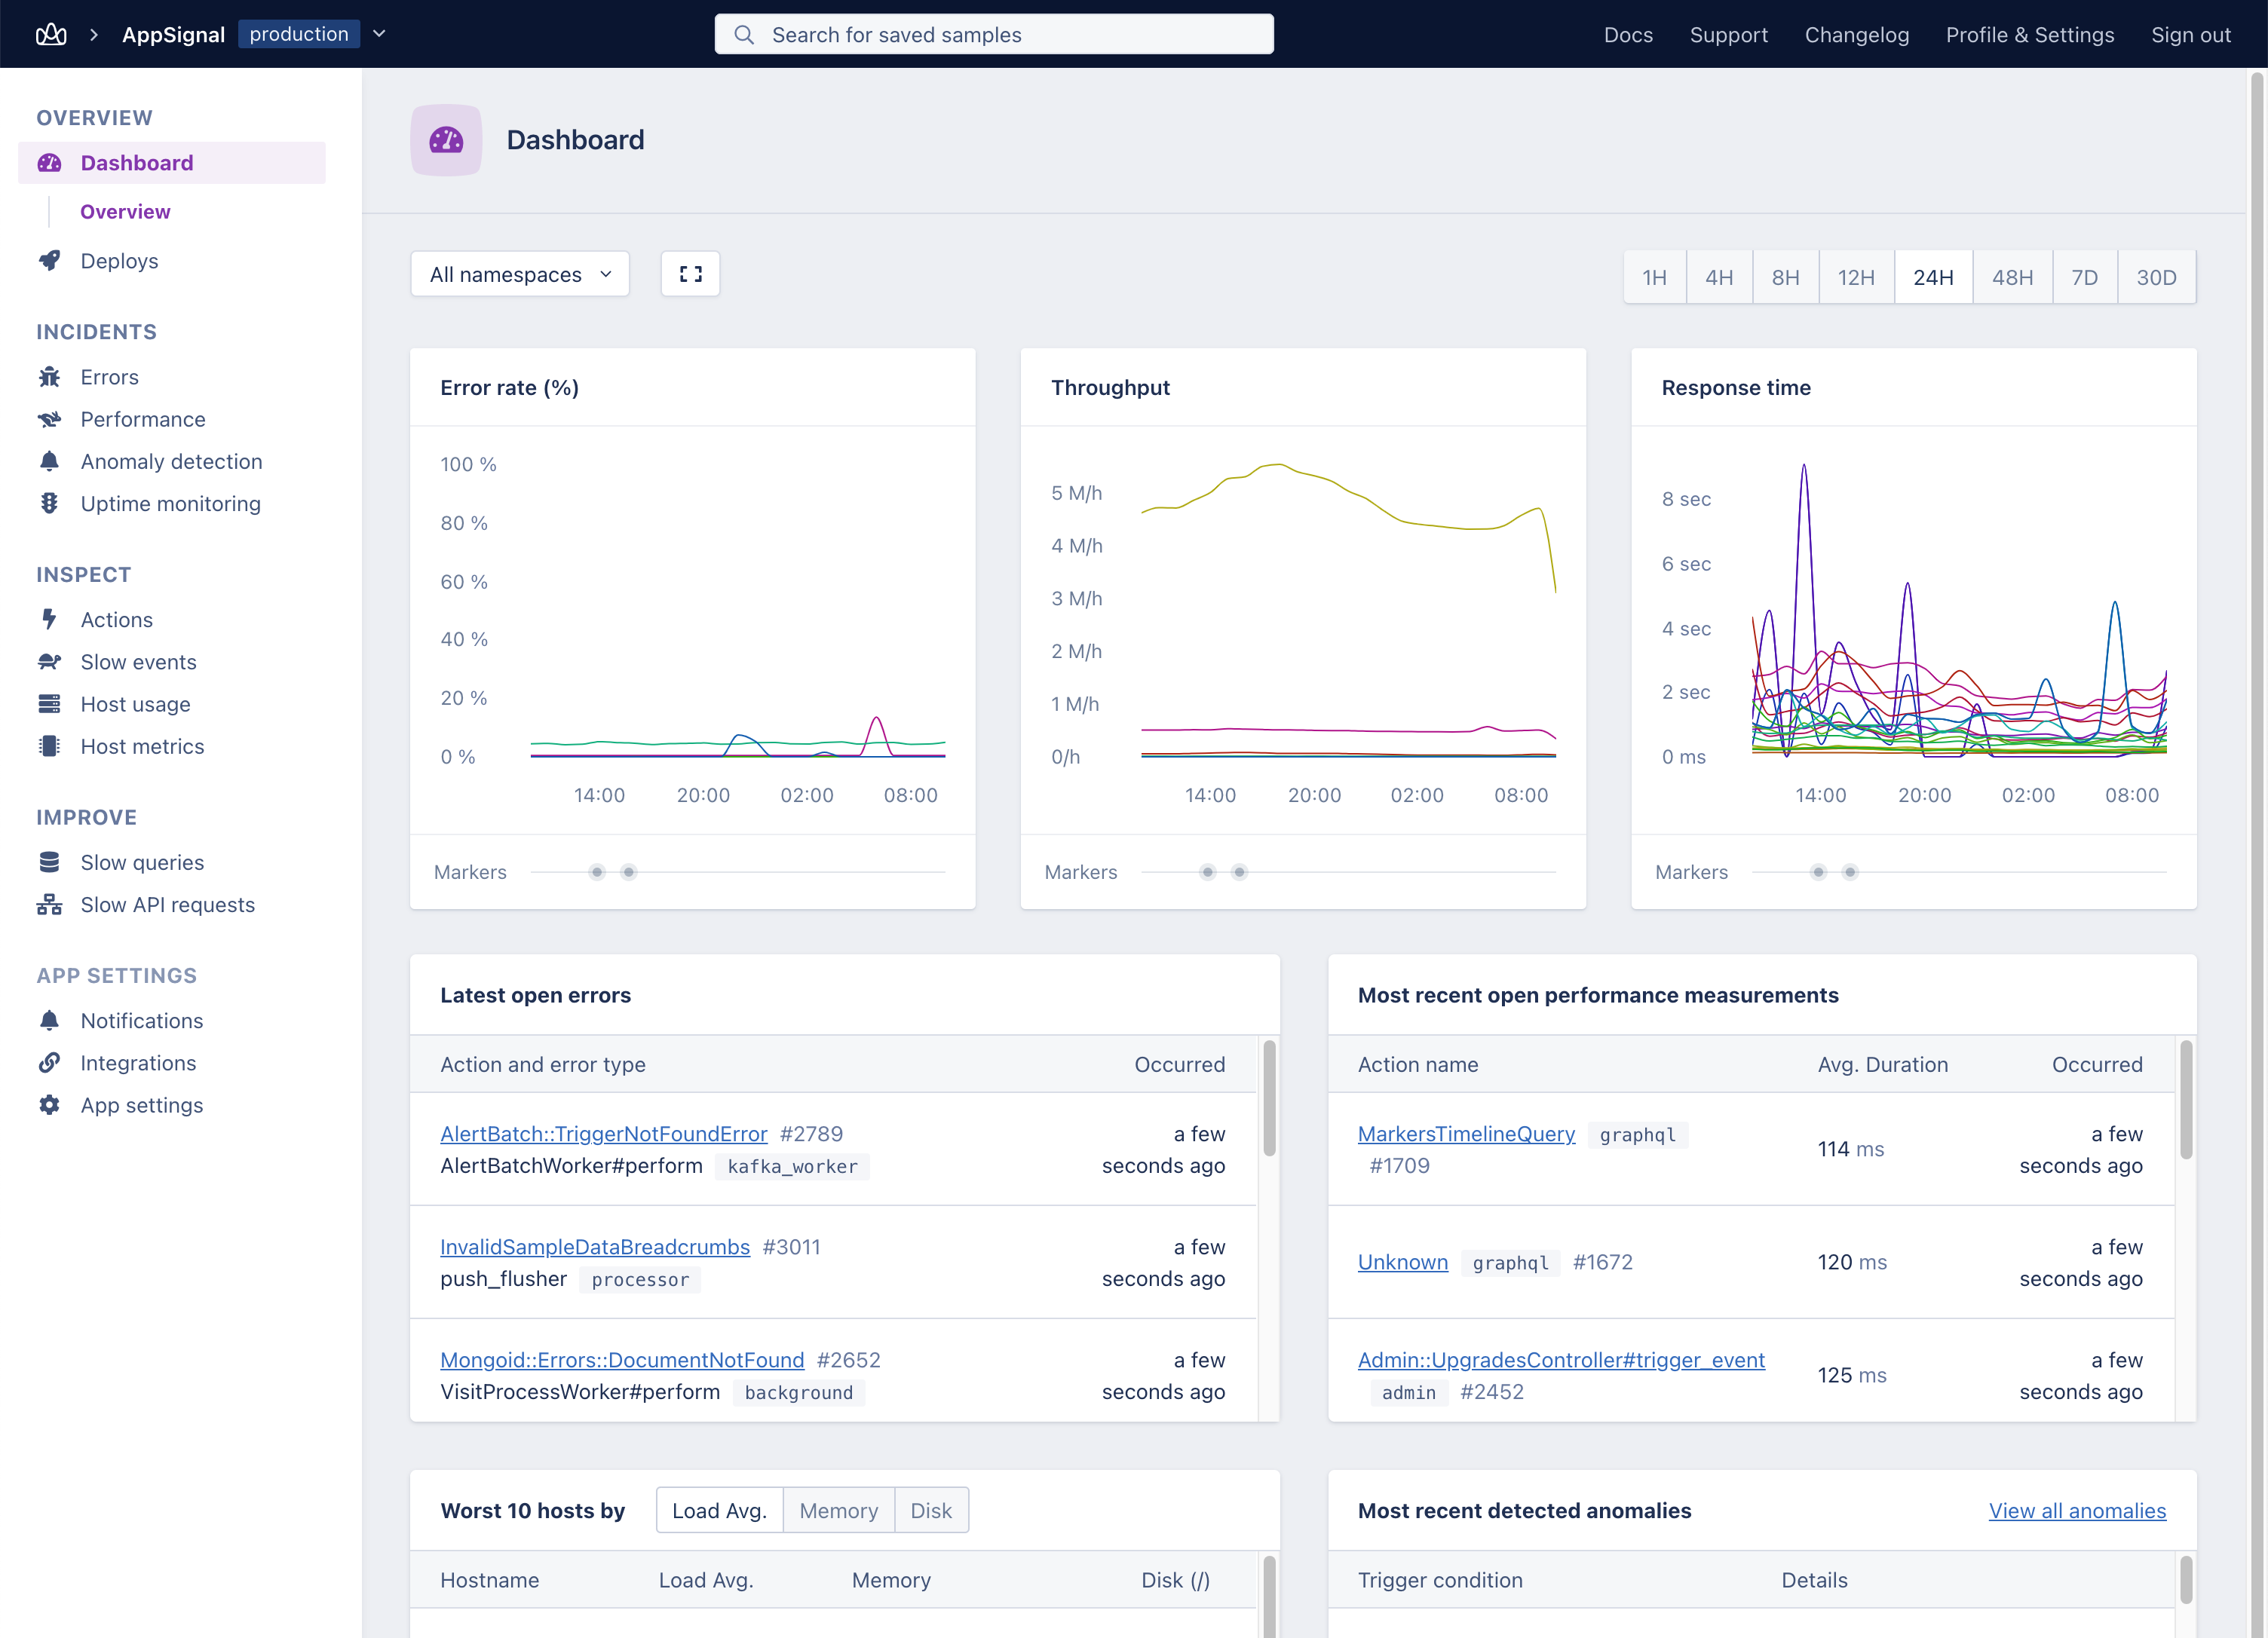
AppSignal is a tool that gives you information about your performance for both the frontend and background tasks, as well as host monitoring, error tracking, and the ability to gather application data. You can monitor payload sizes, database queries, revenue, and many other metrics with readily customized dashboards.
The lightweight Rust-powered agent makes installing AppSignal a breeze. It tracks the performance of your applications and presents a concise description of the events. Along with an Event Timeline that gives specifics on what the code is doing, you'll also see information like network traffic, memory allocation, and CPU usage.
It has an anomaly detection system with a few built-in alerts that go out whenever something isn't quite functioning as it should. This is helpful if you're just starting and don't know what to look for or if you're working hard and have a lot to remember.
Although AppSignal is simple to use and set up, it does not include advanced logging or infrastructure monitoring, which raises several important issues. All of your frontend performance information will be visible, but just half of the whole picture will be visible.
Features:
- Anomaly detection
- Out of the box alerts
- Easy installation
AppSignal offers a 30-day trial and fair pricing depending on requests, with prices starting at $19 per month for 250K requests and up to $2249 per month for 2500M requests.
#9 Rollbar
For frontend, backend, as well as mobile applications, Rollbar is an agentless error monitoring tool. By setting up automated issue tracking in Rollbar and assigning to owners directly, errors can be immediately reported as tickets in tools like Jira.
The developers can solve critical errors affecting customers that occur at low starting frequencies but are otherwise challenging to notice due to Rollbar's real-time feed of defects.
Rollbar offers AI-assisted workflows that let developers fix issues right away before they have an impact on users. It displays information on the number of customers affected by the issue, the platforms or browsers that are affected, whether similar errors have happened in the past and whether a fix is already available.
To decrease noise, the automation-grade grouping tool automatically groups related errors. To keep the alerts relevant, the grouping rules can be simply modified, or errors can be manually combined.
Features:
- Bug tracking and monitoring
- Discover in real-time
- Automate error response
The four pricing options offered by Rollbar are free, essential, advanced, and enterprise. The free version of the software includes 5000 free error events each month, while the other categories allow you to customize your product to meet your needs.
Conclusion
Since your applications are the link to your customers and your growth, it is important to keep them under control. Therefore, you must offer the greatest service if you want to build a loyal clients.
In the field of web development, bugs and errors are a constant source of debate for web developers. Therefore, we have compiled some of the top frontend monitoring tools below.
You can increase the performance of your application with the help of these frontend monitoring tools. Additionally, they'll keep your software free of bugs and errors.
Atatus Real User Monitoring
Atatus is a scalable end-user experience monitoring system that allows you to see which areas of your website are underperforming and affecting your users. Understand the causes of your front-end performance issues and how to improve the user experience.
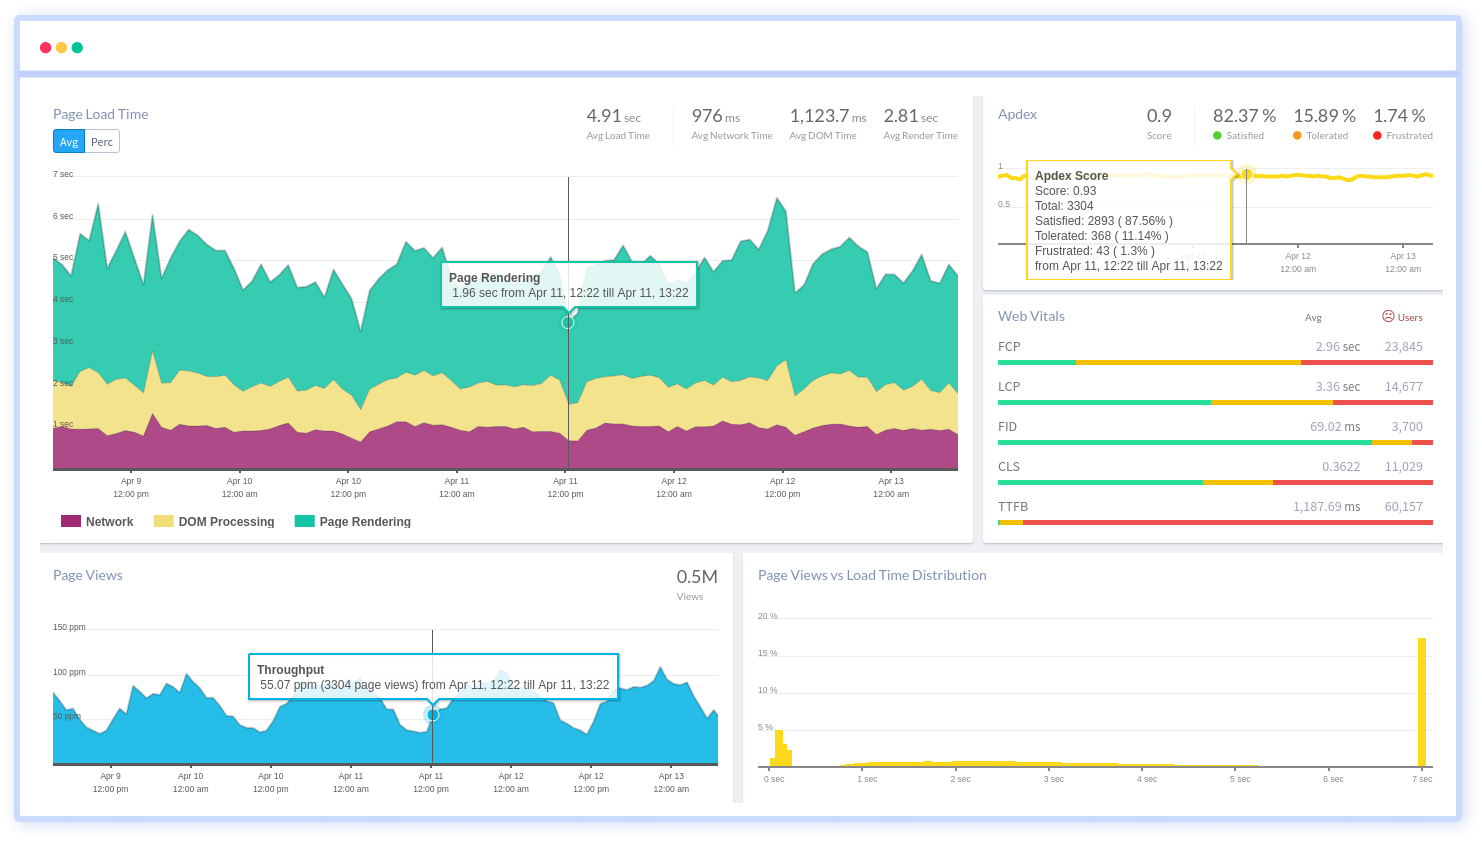
By understanding the complicated frontend performance issues that develop due to slow page loads, route modifications, delayed static assets, poor XMLHttpRequest, JS errors, and more, you can discover and fix poor end-user performance with Real User Monitoring (RUM)
You can get a detailed view of each page-load event to quickly detect and fix frontend performance issues affecting actual users. With filterable data by URL, connection type, device, country, and more, you examine a detailed complete resource waterfall view to see which assets are slowing down your pages.
#1 Solution for Logs, Traces & Metrics
![]() APM
APM
![]() Kubernetes
Kubernetes
![]() Logs
Logs
![]() Synthetics
Synthetics
![]() RUM
RUM
![]() Serverless
Serverless
![]() Security
Security
![]() More
More