Unified Multi Cloud Monitoring for AWS, Azure & GCP
Stop juggling cloud consoles. Atatus gives your team complete multi cloud visibility including metrics, distributed traces, logs, and Kubernetes observability, correlated in one platform with real-time alerts and root cause analysis.
71%
Faster MTTR across cloud incidents
5x
Reduction in cross-cloud debugging time
94%
Fewer missed production issues
10mins
Average time to first multi-cloud insight
End-to-end monitoring across every cloud you run
Atatus ingests metrics, logs, and distributed traces from every cloud provider and every layer of your stack including AWS, Azure, GCP, Kubernetes, containers, and microservices into a single observability platform with fully correlated context.
One dashboard for every cloud workload you run
Atatus consolidates metrics, logs, and distributed traces from AWS, Azure, GCP, and Kubernetes into a single multi-cloud observability platform. Whether your workload lives in EC2, Azure VMs, GKE pods, or bare-metal, you see everything in one place with full contextual correlation.
- Monitor AWS, Azure, GCP, Kubernetes, and container workloads from one unified dashboard
- Correlate cloud infrastructure metrics, application performance, logs, and traces in real time
- Eliminate blind spots across microservices, databases, serverless functions, and network layers
Multi-Cloud Monitoring That Goes Beyond the Alert
Other tools alert you that something broke across your cloud environments. Atatus shows you exactly where, in which cloud, why, and what changed without switching dashboards or writing manual correlations.
Connect all your clouds in minutes, not days
One agent monitors cloud VMs, containers, and Kubernetes nodes across providers. Integrate with AWS CloudWatch, Azure Monitor, and Google Cloud Monitoring in minutes with no complex setup.
Complete telemetry with under 1% overhead
Collect infrastructure metrics, traces, and logs across your multi-cloud stack without performance impact. Trace every request and search every log with complete visibility and no sampling gaps.
Intelligent alerting that understands your cloud patterns
Atatus detects abnormal behavior across AWS, Azure, and GCP using workload patterns instead of static thresholds. Get alerts for real issues, not routine autoscaling metric spikes.
Predictable pricing, no cloud data tax
Transparent pricing that scales with your team, not data volume. Monitor metrics, logs, and traces across AWS, Azure, and GCP without worrying about ingestion limits or surprise overage costs.
Everything in one view. Nothing to correlate manually.
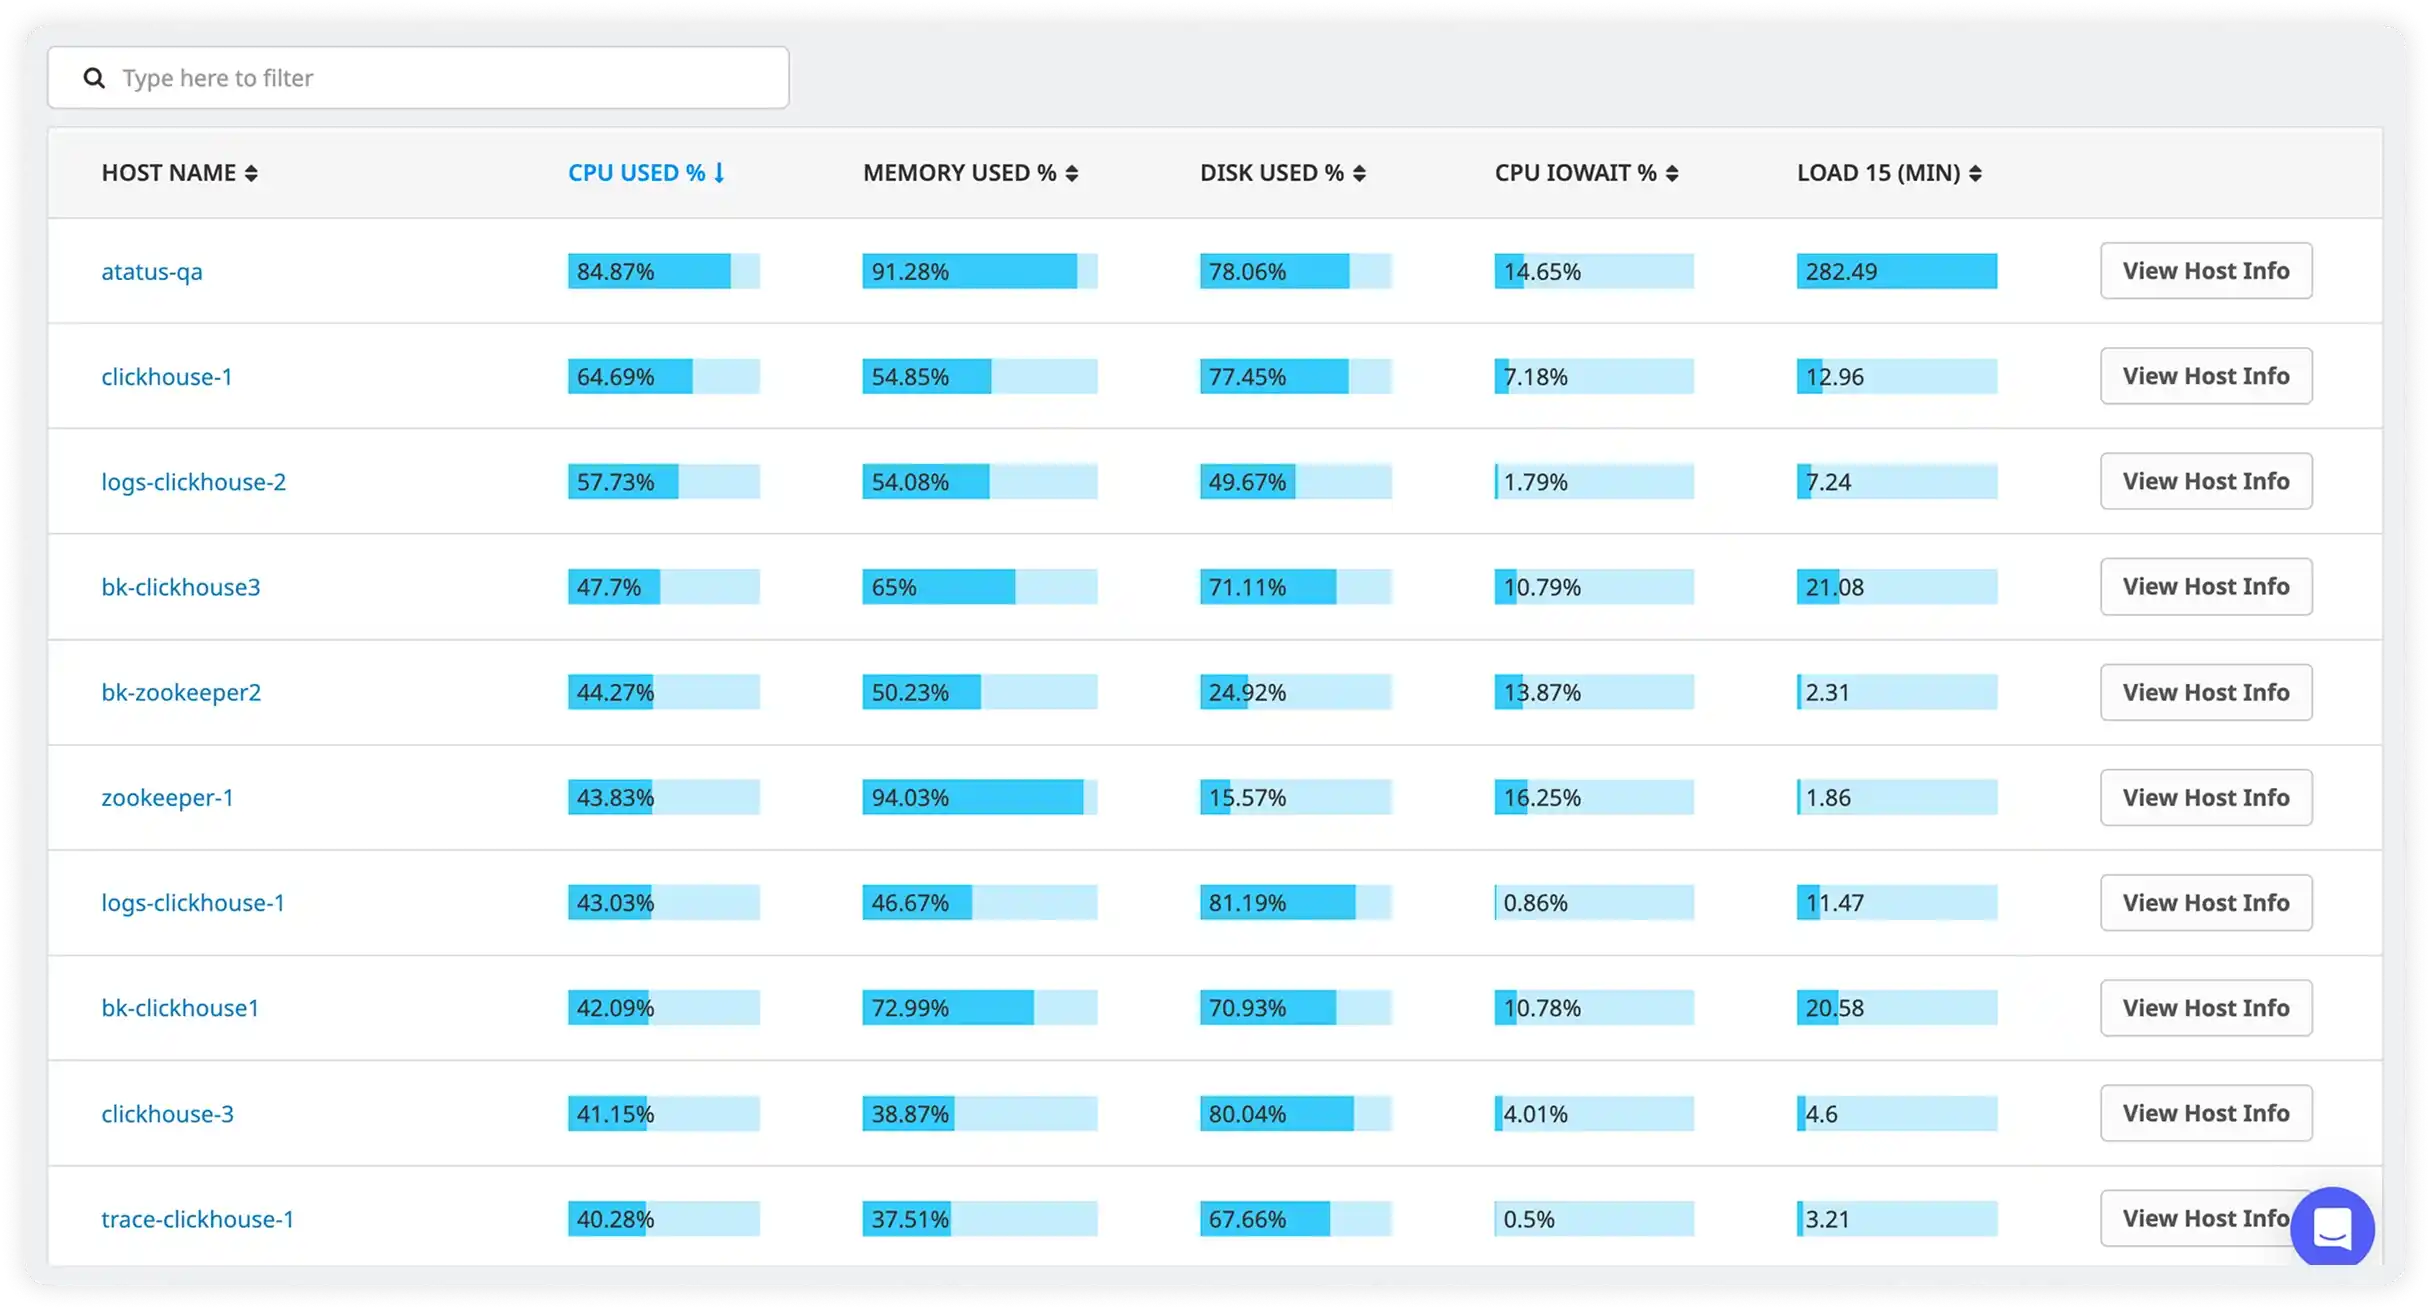
Unified Multi-Cloud Infrastructure Dashboard
Stop toggling between AWS Console, Azure Portal, and GCP Dashboard. Atatus pulls CPU, memory, disk, and network metrics from all three cloud providers into one normalized view with cross-cloud tagging so you can group workloads by service, region, or team regardless of which provider hosts them.
Cross-Cloud Request Tracing with OpenTelemetry
When a slow transaction touches an AWS Lambda, an Azure App Service, and a GCP Cloud Run instance in a single user journey, Atatus stitches every hop into one trace. See exactly where latency was introduced and which cloud environment owns the bottleneck without manually correlating provider-specific logs.
Per-Provider Cost-to-Performance Visibility
Know whether your AWS spend is delivering better performance than your Azure equivalent. Atatus correlates infrastructure cost signals with latency, error rate, and throughput metrics across providers, so your cloud architects can make placement decisions backed by real performance data, not estimates.
Multi-Cloud Log Correlation Without ETL
Logs from AWS CloudWatch, Azure Log Analytics, GCP Cloud Logging, and your application runtimes land in one searchable store automatically. No log forwarders to maintain per provider, no schema mapping required. Query across clouds in a single search, with trace context attached to every line.
Kubernetes Fleet Monitoring Across All Managed Services
Whether your clusters run on EKS, GKE, or AKS, Atatus monitors them as a unified fleet. Compare pod resource efficiency, node utilization, and deployment health across cloud providers side by side and catch quota or scaling issues on any cluster before they affect users.
Multi-Cloud Incident Response from One Alert
When an alert fires, Atatus already knows which clouds are involved. Navigate from the alert directly to the affected service's trace, the correlated log stream, and the infrastructure health across every provider in the incident without leaving the platform or opening a second console.
Plugs into your existing cloud stack
No rip-and-replace required. Atatus connects to the cloud providers, infrastructure tools, and alerting systems your team already relies on.
Unified Observability for Every Engineering Team
Atatus adapts to how engineering teams work across development, operations, and reliability.
Developers
Trace requests, debug errors, and identify performance issues at the code level with clear context.
DevOps
Track deployments, monitor infrastructure impact, and understand how releases affect application stability.
Release Engineer
Measure service health, latency, and error rates to maintain reliability and reduce production risk.
Powering better performance
for modern teams
Feedback from teams improving monitoring and debugging workflows
"Solid Product even better support", The integration path is incredibly simple/easy and the overall interface is very intuitive. That said, I had a handful of odd use cases that the support team was incredibly responsive in helping me work through.

Wes D
Site Reliability Engineer