{
  "eventType":
    "user.session.start",
  "outcome":
    { "result": "SUCCESS" },
  "actor": { "alternateId":
    "maya@acme.io" },
  "client": { "ipAddress":
    "203.0.113.24" }
}Every user action. Every change. All in one place.
Atatus collects audit logs from Linux hosts, Kubernetes clusters and 37 cloud, identity, DevOps and security integrations, maps them to the same fields, and lets your team search every action in one place.
37 integrationsLinux audit logs and syslogKubernetes audit logsGDPR ready
01 / One shape
Every source, the same fields.
Pick a field and see where it comes from in each raw event.
Sample events · the highlighted value becomes the field below
{
  "eventName": "ConsoleLogin",
  "userIdentity": {
    "type": "IAMUser",
    "userName": "sam" },
  "responseElements": {
    "ConsoleLogin": "Success" },
  "sourceIPAddress":
    "198.51.100.7"
}{
"verb": "create",
"objectRef":
{ "resource": "pods" },
"user": { "username":
"ci-deployer" },
"sourceIPs": ["10.0.4.12"]
}type=USER_AUTH msg=audit(1729606931.204:812): acct="admin" exe="/usr/sbin/sshd" addr=203.0.113.24 res=failed
2026-10-22T14:02:11+00:00
web-01 sshd[812]:
Failed password for invalid
user admin from 203.0.113.24
port 52144 ssh2
02 / Filters
Ask with a filter.
Type a filter or pick one. Mistakes are caught before you search.
2 of 16 events match
| Source | Action | User | Source IP | Outcome |
|---|---|---|---|---|
| okta | user.session.start | sam@acme.io | 203.0.113.24 | FAILURE |
| okta | user.authentication.auth_via_mfa | sam@acme.io | 10.0.2.17 | FAILURE |
| okta | user.session.start | maya@acme.io | 203.0.113.24 | SUCCESS |
| okta | policy.lifecycle.update | admin@acme.io | 10.0.3.40 | SUCCESS |
| cloudtrail | ConsoleLogin | root | 198.51.100.7 | Success |
| cloudtrail | ConsoleLogin | sam | 203.0.113.24 | Failure |
| cloudtrail | AttachRolePolicy | ci-bot | 10.0.8.21 | Success |
| cloudtrail | AttachUserPolicy | ci-bot | 10.0.8.21 | Success |
| cloudtrail | PutBucketPolicy | ci-bot | 10.0.8.21 | Success |
| kubernetes | create pods | ci-bot | 10.0.4.12 | |
| kubernetes | get secrets | system:anonymous | 192.168.4.20 | |
| kubernetes | create pods/exec | sam | 192.168.4.31 | |
| runtime-security-agent | USER_AUTH | admin | 203.0.113.24 | fail |
| runtime-security-agent | USER_AUTH | root | 203.0.113.24 | fail |
| runtime-security-agent | USER_AUTH | deploy | 10.0.2.9 | success |
| runtime-security-agent | USER_CMD | deploy | 10.0.2.9 | fail |
Try one
The same language writes detection rule queries and searches the signals list.
03 / Connect
Pick a source. Connect in two steps.
Each form asks for the fields its setup guide lists.
04 / Investigate
Follow one actor across every tool.
Pick a user or an IP and see what it did in each source, in order.
sourceIP:203.0.113.24Okta
GitHub
CloudTrail
Kubernetes
Linux
Linuxfailure1 of 6
USER_AUTH fail · admin
- host
- web-01
- userName
- admin
- auditdResult
- fail
- program
- sshd
05 / In the product
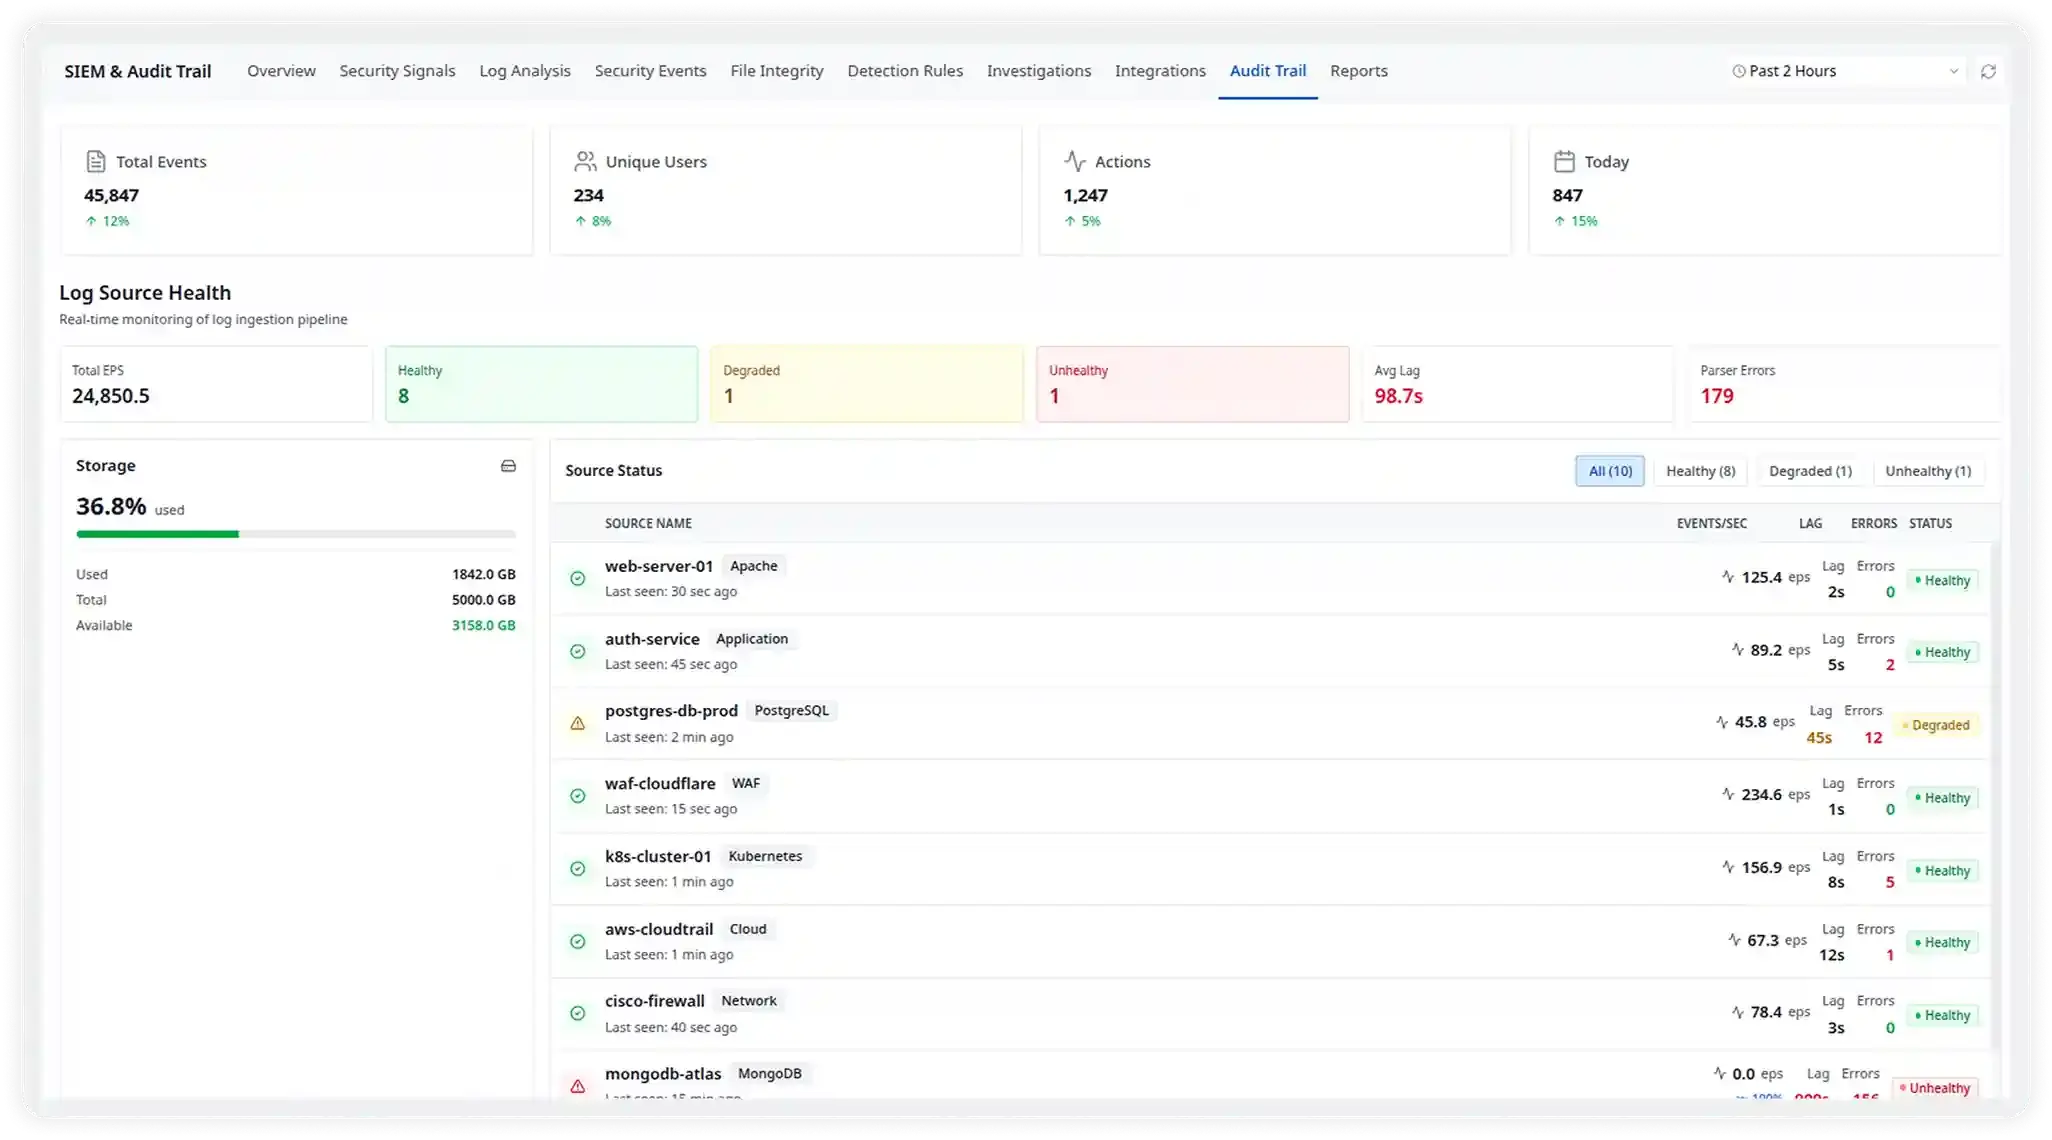
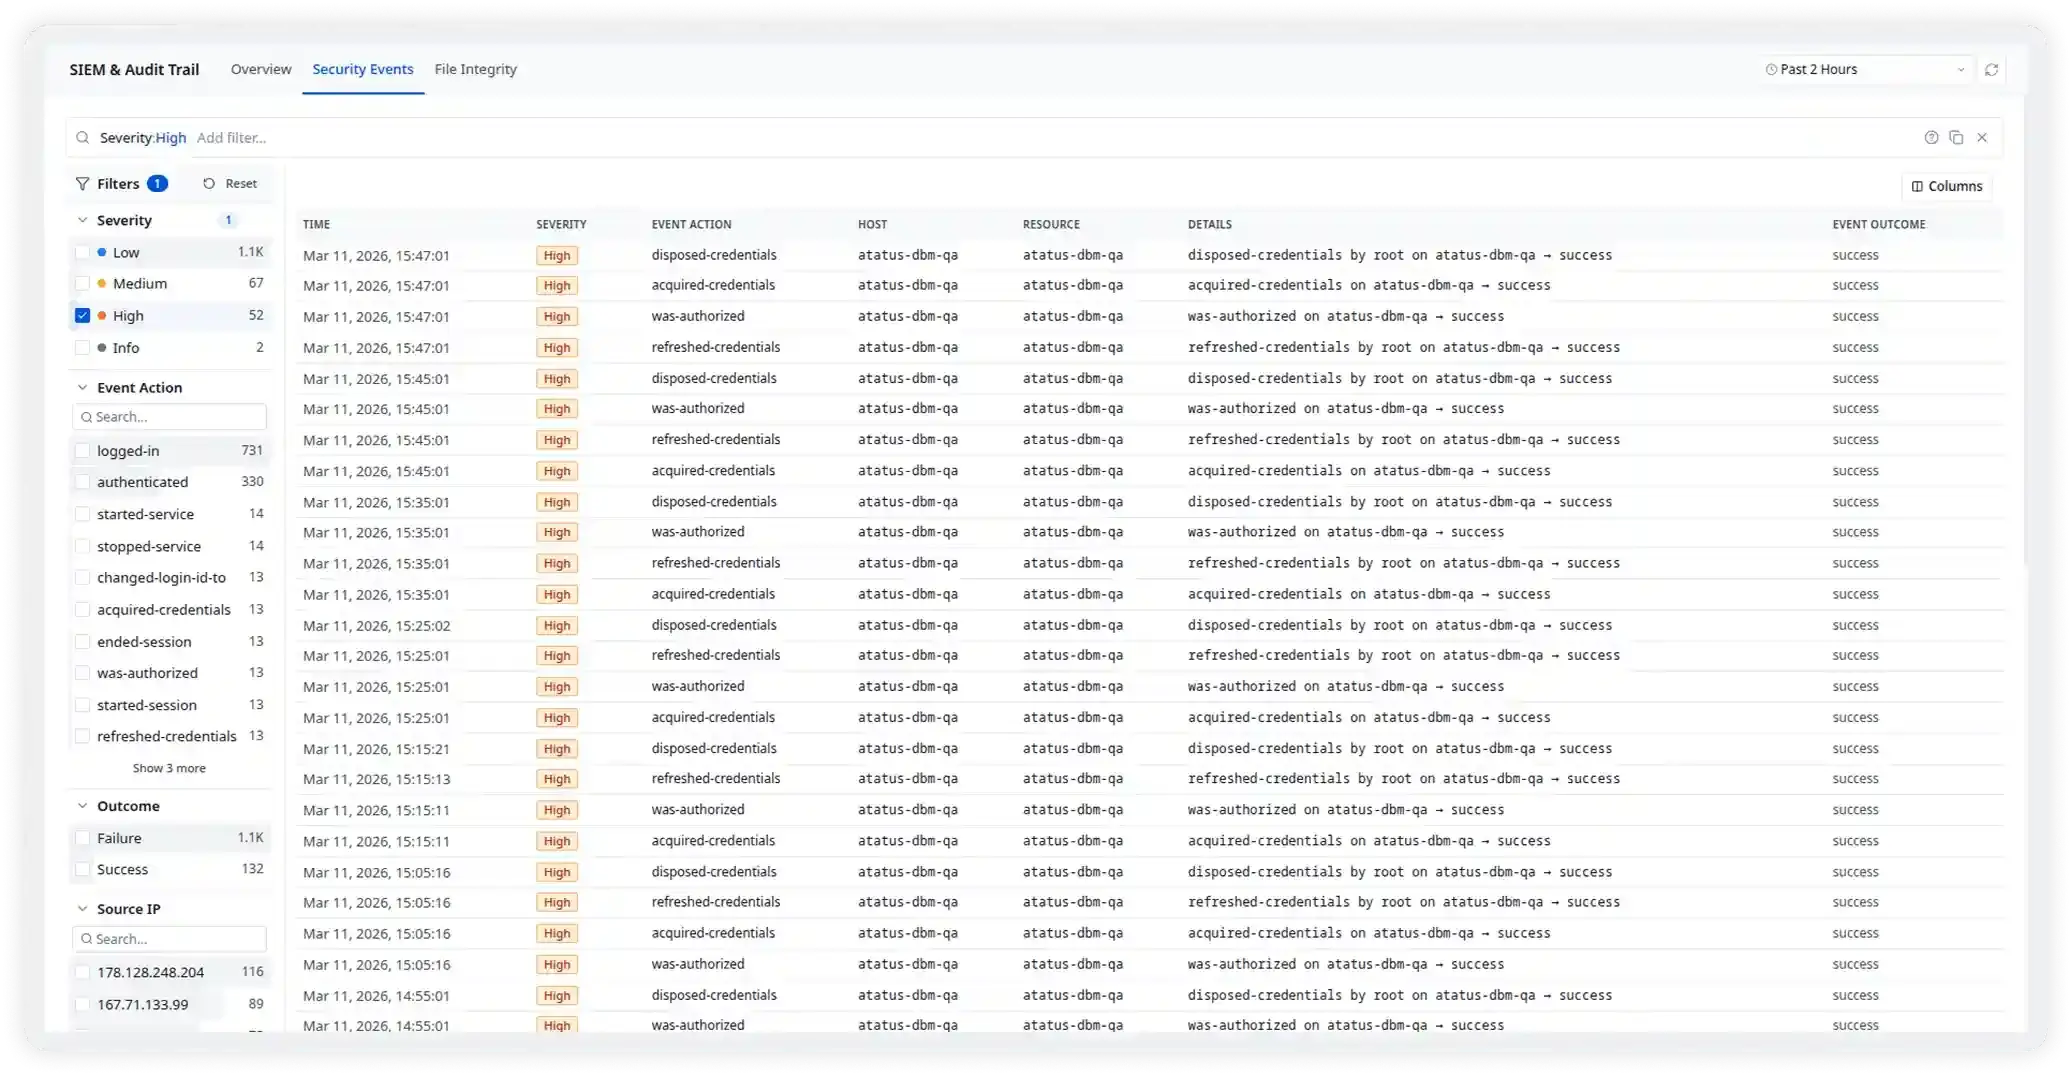
Security Logs, screen by screen.
Real screens from the Atatus app.
FAQ
Questions about security logs
Pricing, deployment, data and the agent. If something is missing, a person will answer it on a demo call.
Start from what you know, such as a user, a source IP or a host, and filter the events in Security, Cloud SIEM, Audit Logs by it, for example sourceIP:203.0.113.24 or userName:sam*. Events from every connected source use the same fields, so Okta logins, CloudTrail API calls, Kubernetes API requests and Linux audit records line up in one list, in time order.
Partly. The infra agent's MySQL module collects the MySQL error and slow query logs, and the PostgreSQL module collects the logs PostgreSQL writes, including statements if you turn on statement logging in PostgreSQL. For a full record of who ran which query, turn on your database's own audit logging and point the agent at that log file.
Yes, on the systems you connect. Linux audit logs record logins, sudo use, executed commands and changes to identity files such as /etc/passwd. Kubernetes audit logs record every API request with the user, the resource and the time. File integrity monitoring records each change to watched files with the user and the process. Changes in AWS, GitHub or Okta come in through their integrations, and you can send audit events from your own app with the Log Ingest API.
Access in Atatus is set per account. Each user has a role in each account, Owner, Admin or User, and an owner can create sub-accounts. Send finance or HR systems to their own account and invite only the people who should see them.
Yes. The Windows Event Log module in the Atatus infra agent 4.1.0 or later forwards system, security and application events to Atatus Log Management, next to your Linux and application logs.
They are separate views. Logs Monitoring collects, stores and searches your application and infrastructure logs. Audit logs from Linux, Kubernetes, file integrity monitoring and the security integrations land in Security, Cloud SIEM, Audit Logs, where detection rules evaluate them and turn matches into signals. For Linux syslog you choose: lines become security events by default, and siem: false keeps them as ordinary searchable logs.
Collect audit logs from your cloud, identity and DevOps tools and query them with the same fields.
- SaaS
- On-premises
- Hybrid
- BYOC
- No per-user pricing
Compare Atatus with Splunk · Sumo Logic