See Every Service. Trace Every Failure. Fix It Fast.
Atatus Service Map automatically builds a live topology of your entire distributed system with every service, every dependency, and every health signal without manual diagrams.
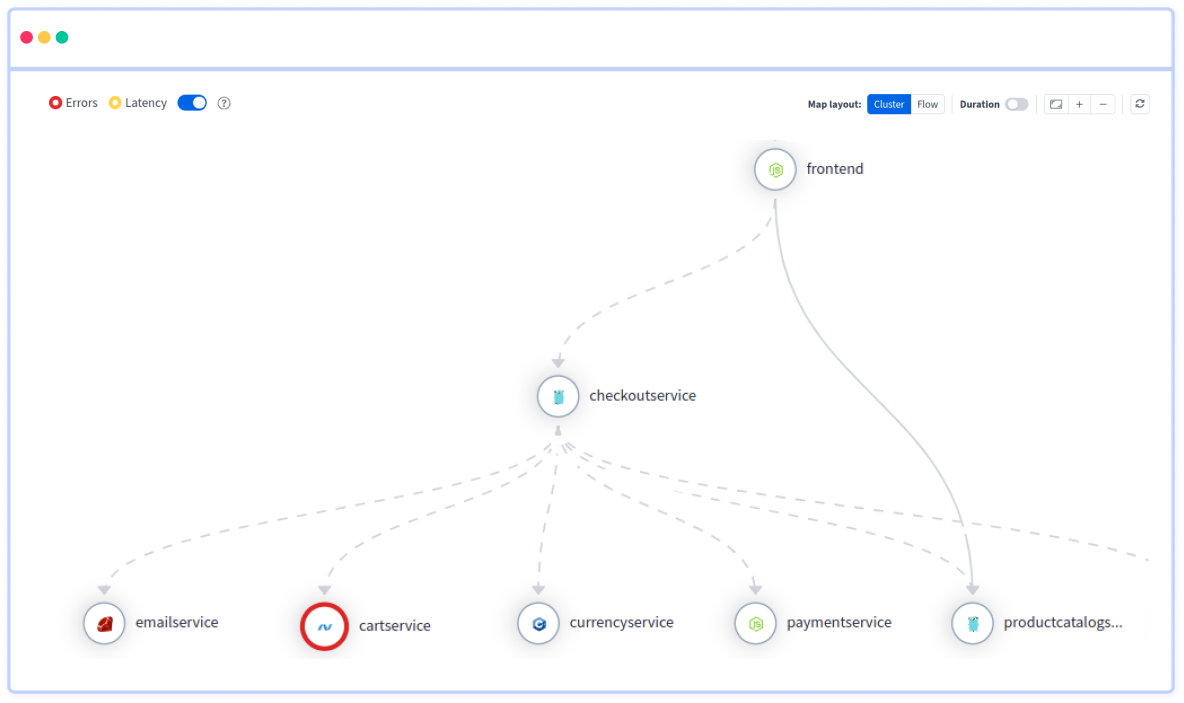
Every service. Every dependency.
Built from the traces you already send. Switch the layout, click a node, isolate a service.
Every call, by endpoint.
Expand a service to see which transaction calls which database, queue, cache, LLM or external API.
| Transaction SERVICE · JAVA | p95 | postgresqlDatabase system | stripe-apiExternalReq | kafkaMessaging system | redisCache | openaiLLM provider |
|---|---|---|---|---|---|---|
POST /checkout | 412 ms | |||||
GET /orders/:id | 88 ms | |||||
order.created | 6 ms |
- Relation
- CALLS
- Line
- grey, solid
The root cause, on the map.
A problem points to the entity that caused it and the ones it affected. Open the drawer to see why.
Red line: root cause · amber dotted: evidence · sample data
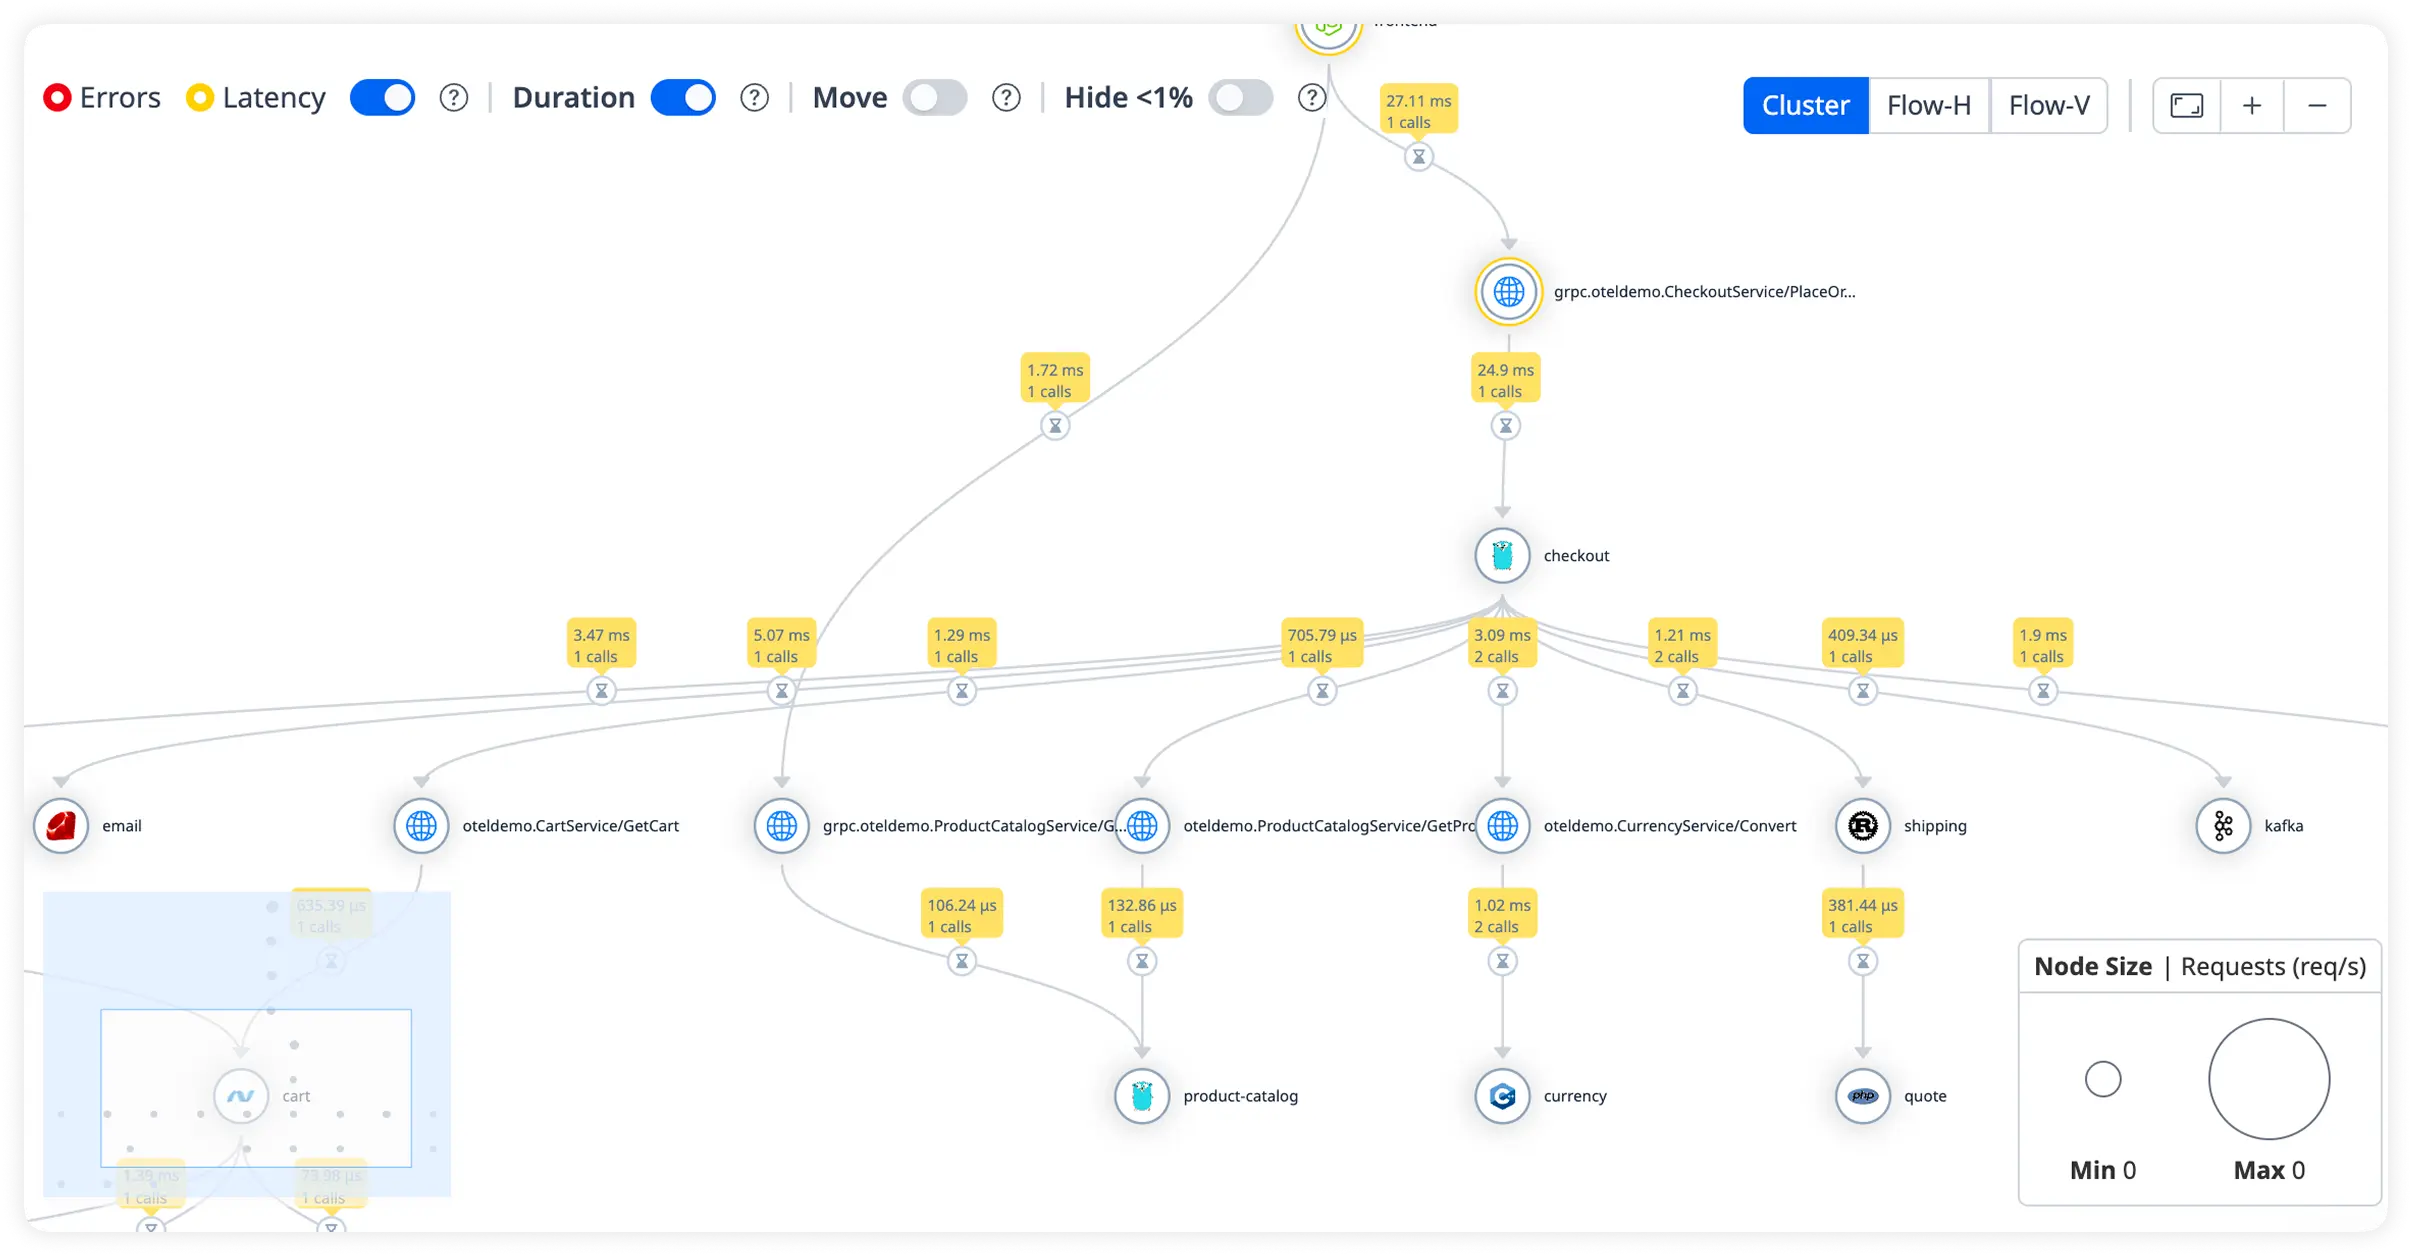
Latency on every edge.
The service map inside APM adds latency and call counts to each dependency.
Common questions about the service map
Pricing, deployment, data and the agent. If something is missing, a person will answer it on a demo call.
A service map is a visual representation of the services in your distributed application and the dependencies between them: which services call which, and which databases, queues, caches and external APIs they use. It is built from the telemetry your services already send, so it shows production as it is rather than an old architecture diagram. Atatus marks health on every node and links to APM for throughput, latency and errors.
The Atatus APM agents trace requests as they flow through your system and record every call between services and to databases, queues, caches, LLM providers and external APIs. Atatus reads those traces and draws the topology from them. Hosts from the Infrastructure agent and clusters from the Kubernetes agent join the same map, and active problems and open issues show as red and amber borders.
Service dependency mapping is the process of identifying and documenting all the relationships between services in a distributed system which services call which, what data flows between them, and what would be affected if any one service failed. Atatus handles this automatically by inferring dependencies from distributed traces rather than requiring manual documentation.
Automatically, from the distributed tracing data your Atatus APM agents already send. No separate agent and no manual configuration are needed. An entity appears on the map once it reports telemetry in the selected time range, and drops off when it stops.
In a microservices architecture, services are interdependent in ways that are difficult to track manually. When failures occur, understanding which services depend on each other is critical for identifying root causes and assessing blast radius. Without a service map, engineers either rely on outdated documentation or spend valuable incident time reconstructing the architecture from scratch.
When something breaks, the Problems view links the problem to the entity Atatus identified as the root cause with a red line, and to the services it affected with amber dotted lines. Investigate problem opens the status, severity, duration, the breaching metric against its baseline and the propagation path without leaving the map. From there you open the traces of any affected service.
Distributed tracing captures the detailed path and timing of individual requests as they flow through services. A service map aggregates tracing data across all requests to show the overall topology of service relationships, with health and performance summaries for each service and connection. In Atatus, they work together: the service map provides the high-level view, and you drill into distributed traces for detailed investigation.
Yes. Once the Atatus APM agent is installed on your services, dependency discovery is fully automatic. Every service-to-service call, database query, external API call, and message queue interaction captured in trace data is reflected in the service map. You don't need to register services, define relationships, or maintain any configuration to keep the topology current.
Install the agent and the map builds itself from live traffic, with health on every service and dependency.
- SaaS
- On-premises
- Hybrid
- BYOC
- No per-user pricing
Compare Atatus with Dynatrace · AppDynamics