1. Home
  2. Comparison
  3. Paessler PRTG alternative
Atatus vs Paessler PRTGNetwork & Infrastructure Monitoring:

The Modern PRTG Alternative

Paessler PRTG offers good features, but does it offer everything you need? Atatus provides a complete solution with full-stack observability, providing end-to-end visibility across your applications and infrastructure.

No credit card requiredInstant Setup24/7 Support
Why switch

Why Atatus is the Best Alternative to the tool?

Tired of extra costs? Switch to Atatus - a cheaper alternative to the tool that helps you save and perform better.

the toolCommon pain points
  • High Costs & Unpredictable Pricing User-based pricing models lead to unpredictable bills with hidden fees and overage charges that can quickly escalate.
  • Complex Setup & Steep Learning Curve Time-consuming deployment processes require significant technical resources and extensive training for teams.
  • High Infrastructure Overhead Resource-intensive installations increase infrastructure costs and maintenance burden on your systems.
Atatus AdvantagesOne platform
  • Save up to 4x on Costs Transparent host-based pricing without hidden fees or overage charges. Budget-friendly for startups and growing teams.
  • Quick Setup & Easy to Use Straightforward deployment process gets you up and running quickly. Intuitive interface requires minimal training.
  • Minimum Overhead Lightweight agent with minimal resource footprint reduces infrastructure requirements and operational costs.
  • Transparent Pricing Clear, predictable pricing based on actual usage. No surprises, no user limits, just fair pricing that scales with you.
  • Free 24/7 Support Unlike competitors, we provide round-the-clock support at no extra cost to help you maximize your ROI.
  • Enterprise-Grade Security Industry-standard encryption for data in transit and at rest, ensuring your sensitive information stays protected.

Cloud-Native Instead of Sensor Counting

PRTG prices by sensor count and runs best on a Windows host inside your network. Atatus is a cloud-native SaaS (or on-prem) platform priced by host with every signal included. The modern PRTG alternative for growing teams who are tired of sensor budgeting.

Features

  • Flat per-host pricing
  • No sensor counting
  • SaaS or on-prem
  • Cloud-native architecture
  • Linux and Windows support
Cloud-Native Instead of Sensor Counting

APM, Logs, and RUM Without a Separate Tool

PRTG covers network and infrastructure well, but you need separate tools for application monitoring, log management, and real user monitoring. Atatus bundles all five signals in one UI with cross-signal correlation. A better Paessler PRTG alternative when you need more than SNMP and ICMP.

Features

  • Application performance monitoring
  • Log management
  • Real user monitoring
  • Network device monitoring
  • Infrastructure monitoring
  • Synthetic & uptime monitoring
APM, Logs, and RUM Without a Separate Tool

Modern UX for DevOps and SRE Teams

PRTG UX reflects its mid-2000s origins. Atatus is designed for DevOps and SRE workflows: Kubernetes auto-discovery, OpenTelemetry-native ingest, PromQL compatibility, and modern dashboarding. The PRTG alternative that matches how modern teams actually work.

Features

  • Kubernetes auto-discovery
  • OpenTelemetry native
  • PromQL compatible
  • Modern UI
  • DevOps workflows
Modern UX for DevOps and SRE Teams
Platform

One platform for every signal.

Application Monitoring (APM)

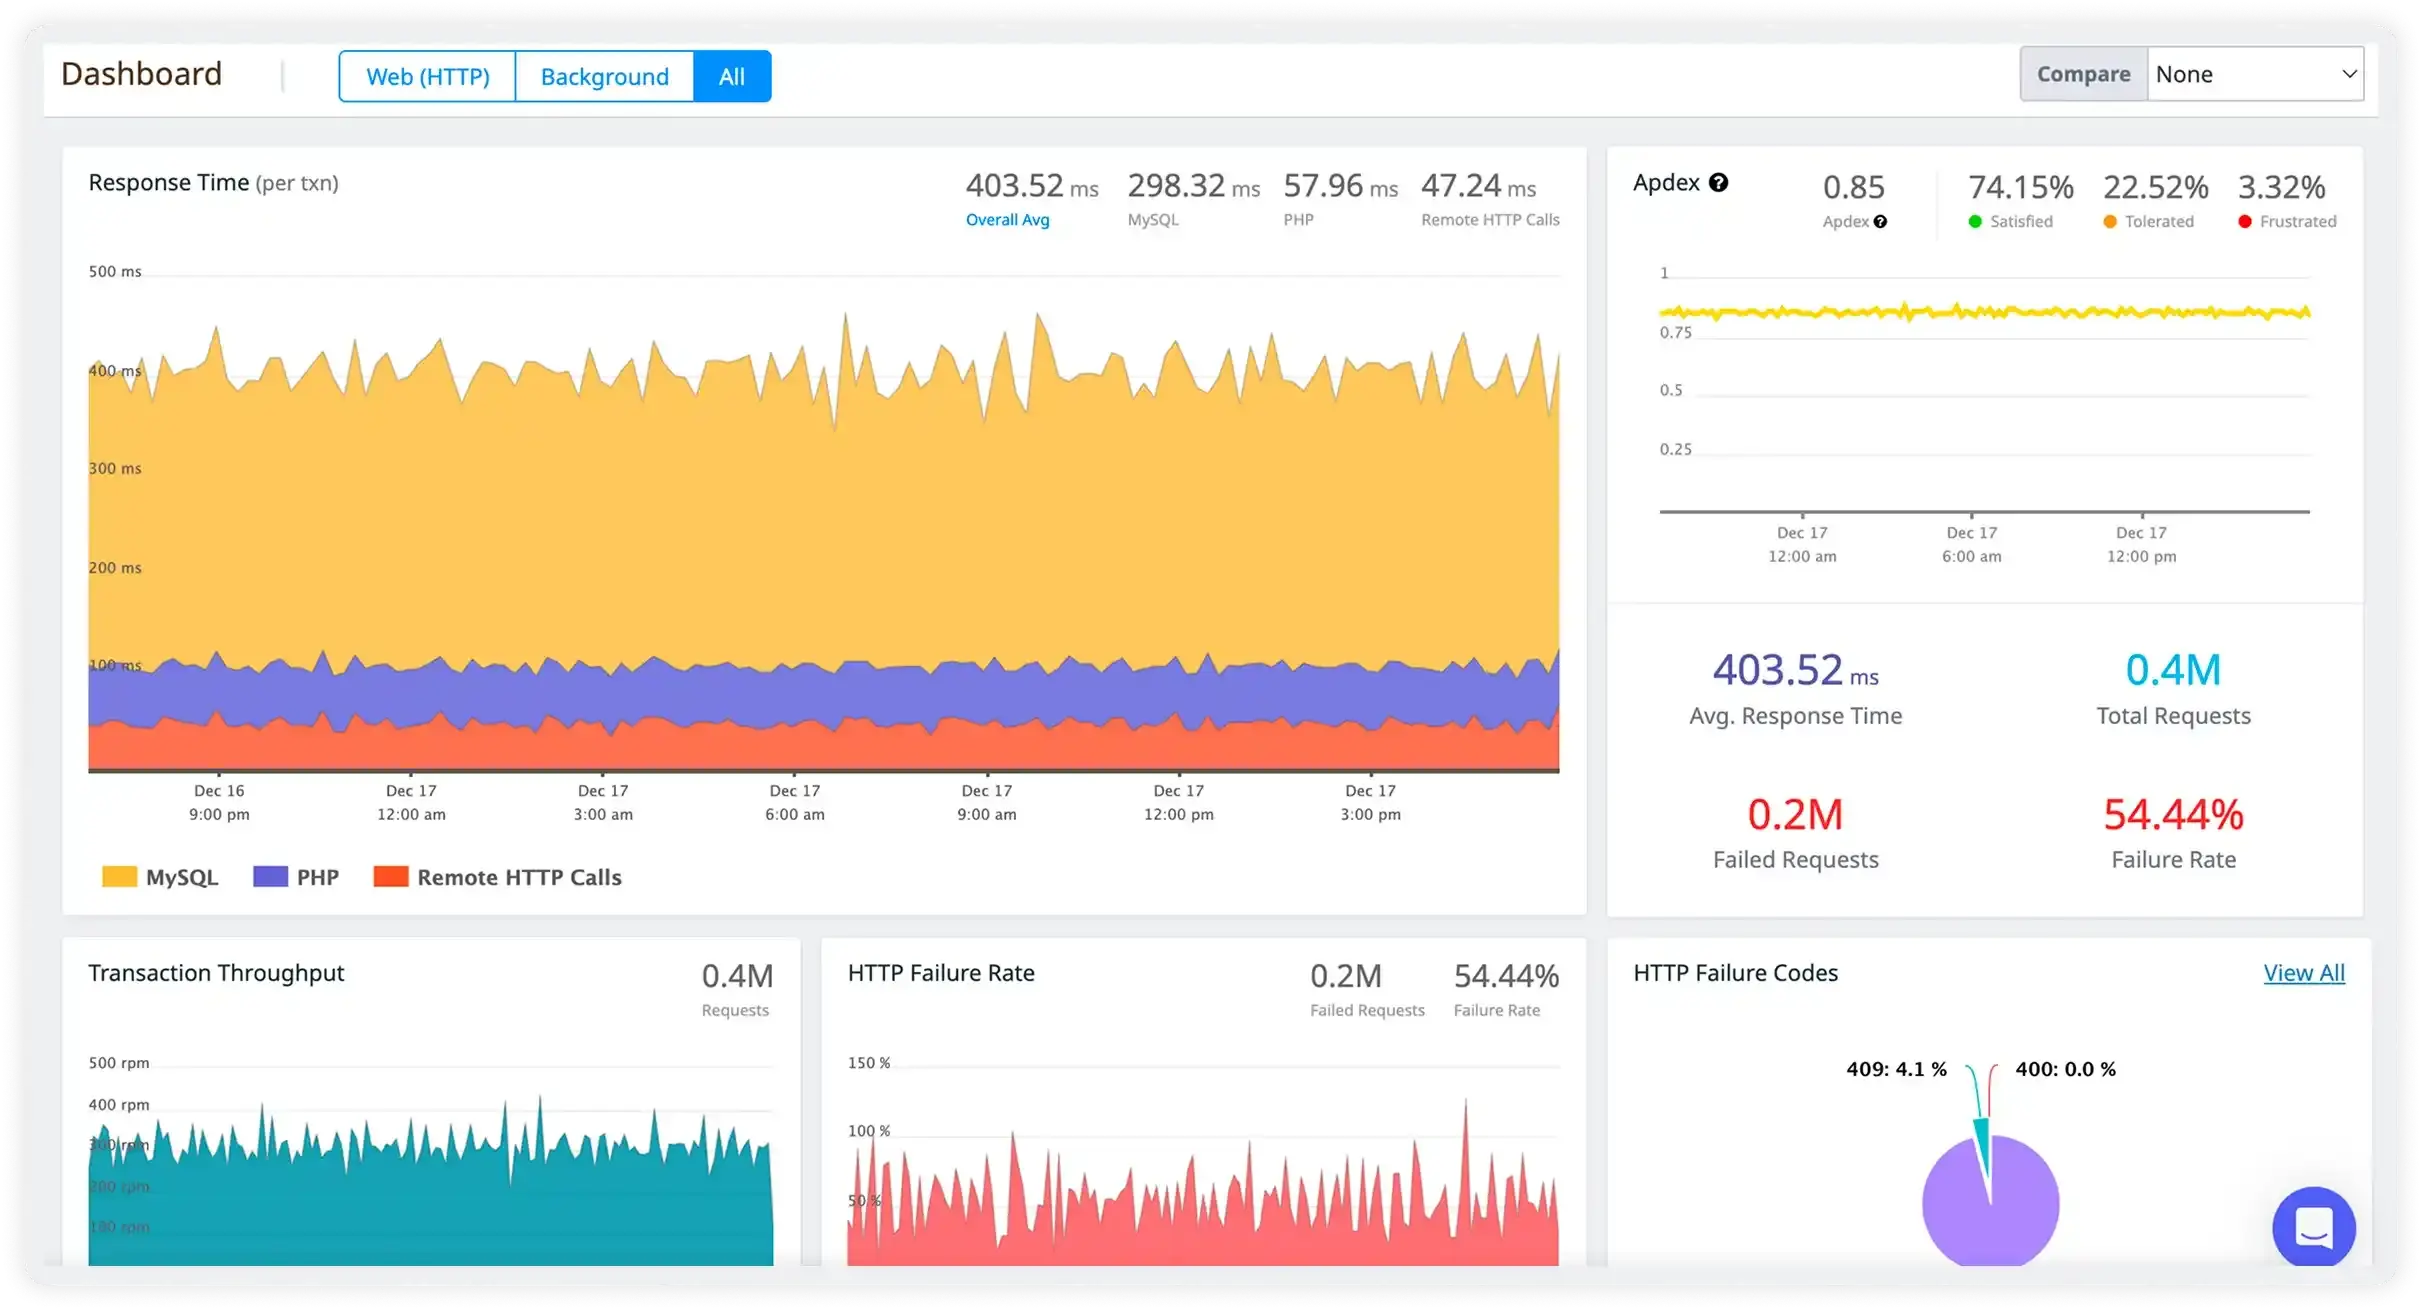
Pro-actively monitor, analyze and optimize the performance-related issues in your back-end apps and databases.

Explore

Real User Monitoring (RUM)

Complete visibility into end-user experience of your website and identify problematic parts of a web page.

Explore

Infrastructure Monitoring

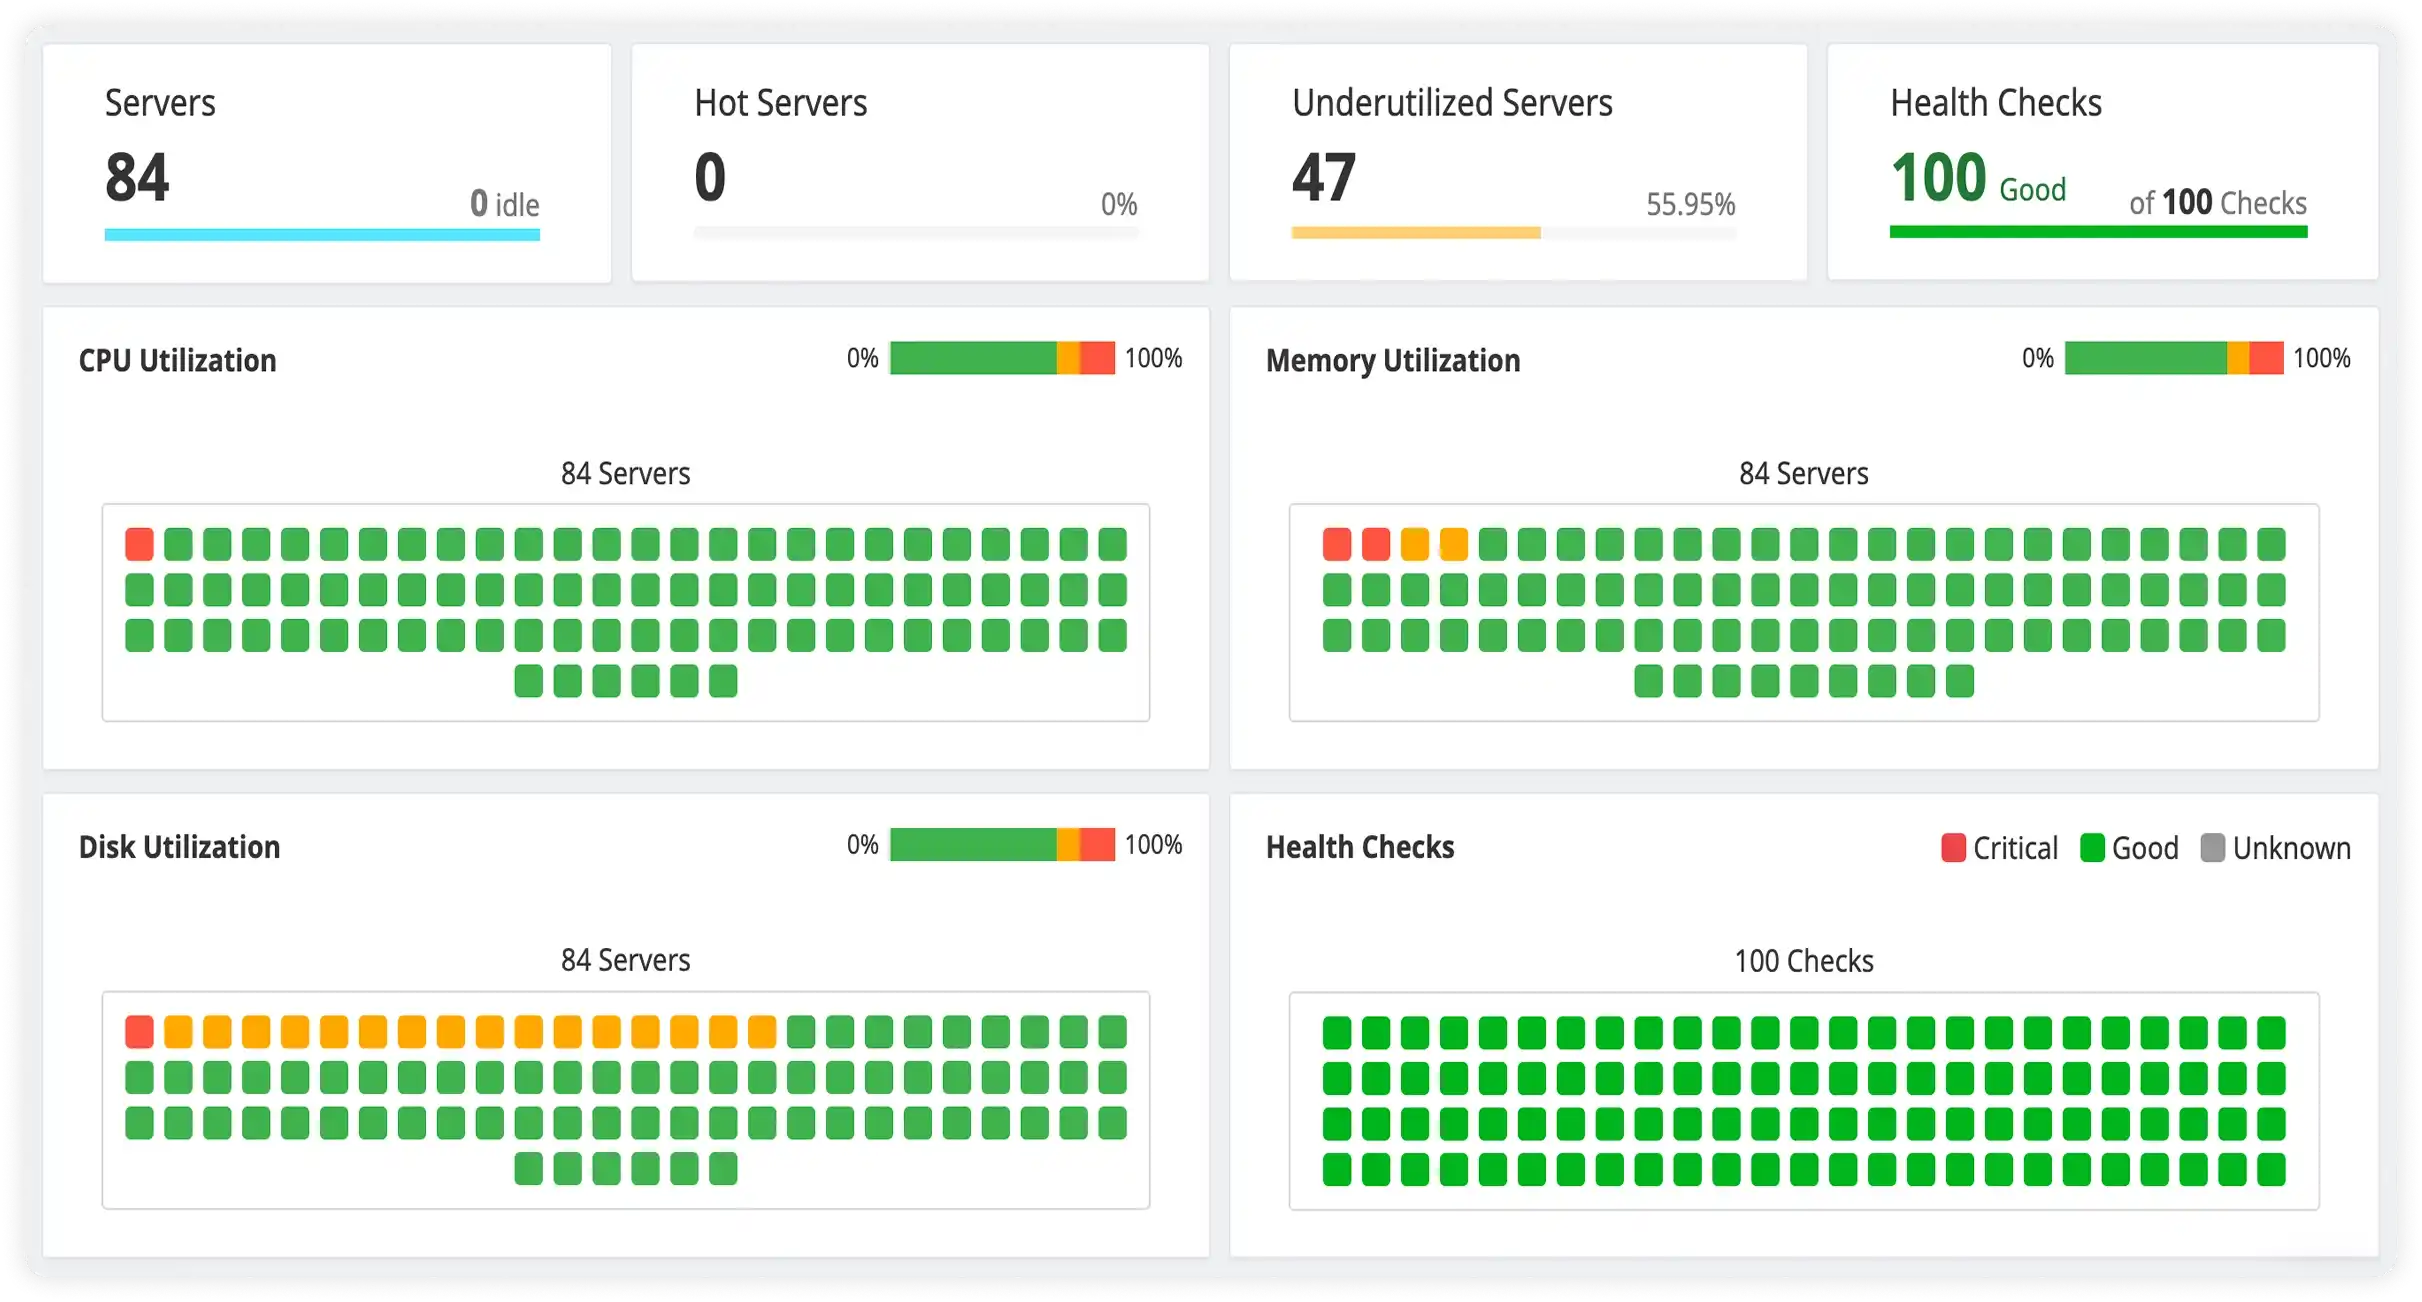
Get full visibility into your infrastructure performance and availability issues of all your servers and cloud instances.

Explore

Log Management & Analytics

Aggregate, search, filter, sort and analyze all your logs from different sources along APM traces at any scale in real-time.

Explore

Synthetic Monitoring

Continuously monitor the availability of your application, detect and resolve issues before your customers encounter them.

Explore

API Analytics

Monitor all your APIs and check how they are used, what payloads are being sent, which users are active, and more.

Explore
Customers

Powering better performance for modern teams

"Solid Product even better support." The integration path is incredibly simple/easy and the overall interface is very intuitive. That said, I had a handful of odd use cases that the support team was incredibly responsive in helping me work through.

Wes DSite Reliability Engineer
Get started

See the root cause first.

Start free and send your first trace with OpenTelemetry or the Atatus agents. APM, logs, RUM, infrastructure and SIEM, all on one timeline.

  • SaaS
  • On-premises
  • Hybrid
  • BYOC
  • No per-user pricing