SQL PowerWhat to know
- Focused on database servers Sql Power Tools monitors SQL activity and wait times on database servers, and sells a separate database security product.
Atatus database monitoring shows query samples, explain plans and lock waits, and connects them to the APM traces of the code that runs each query.
Atatus publishes its prices, includes unlimited team members on every plan, and offers a 14-day free trial with no credit card.
See query time and throughput for each normalized query, with query samples, explain plans and lock waits. On SQL Server, deadlocks show the victim and survivor processes, their queries and the locks they held and waited for.
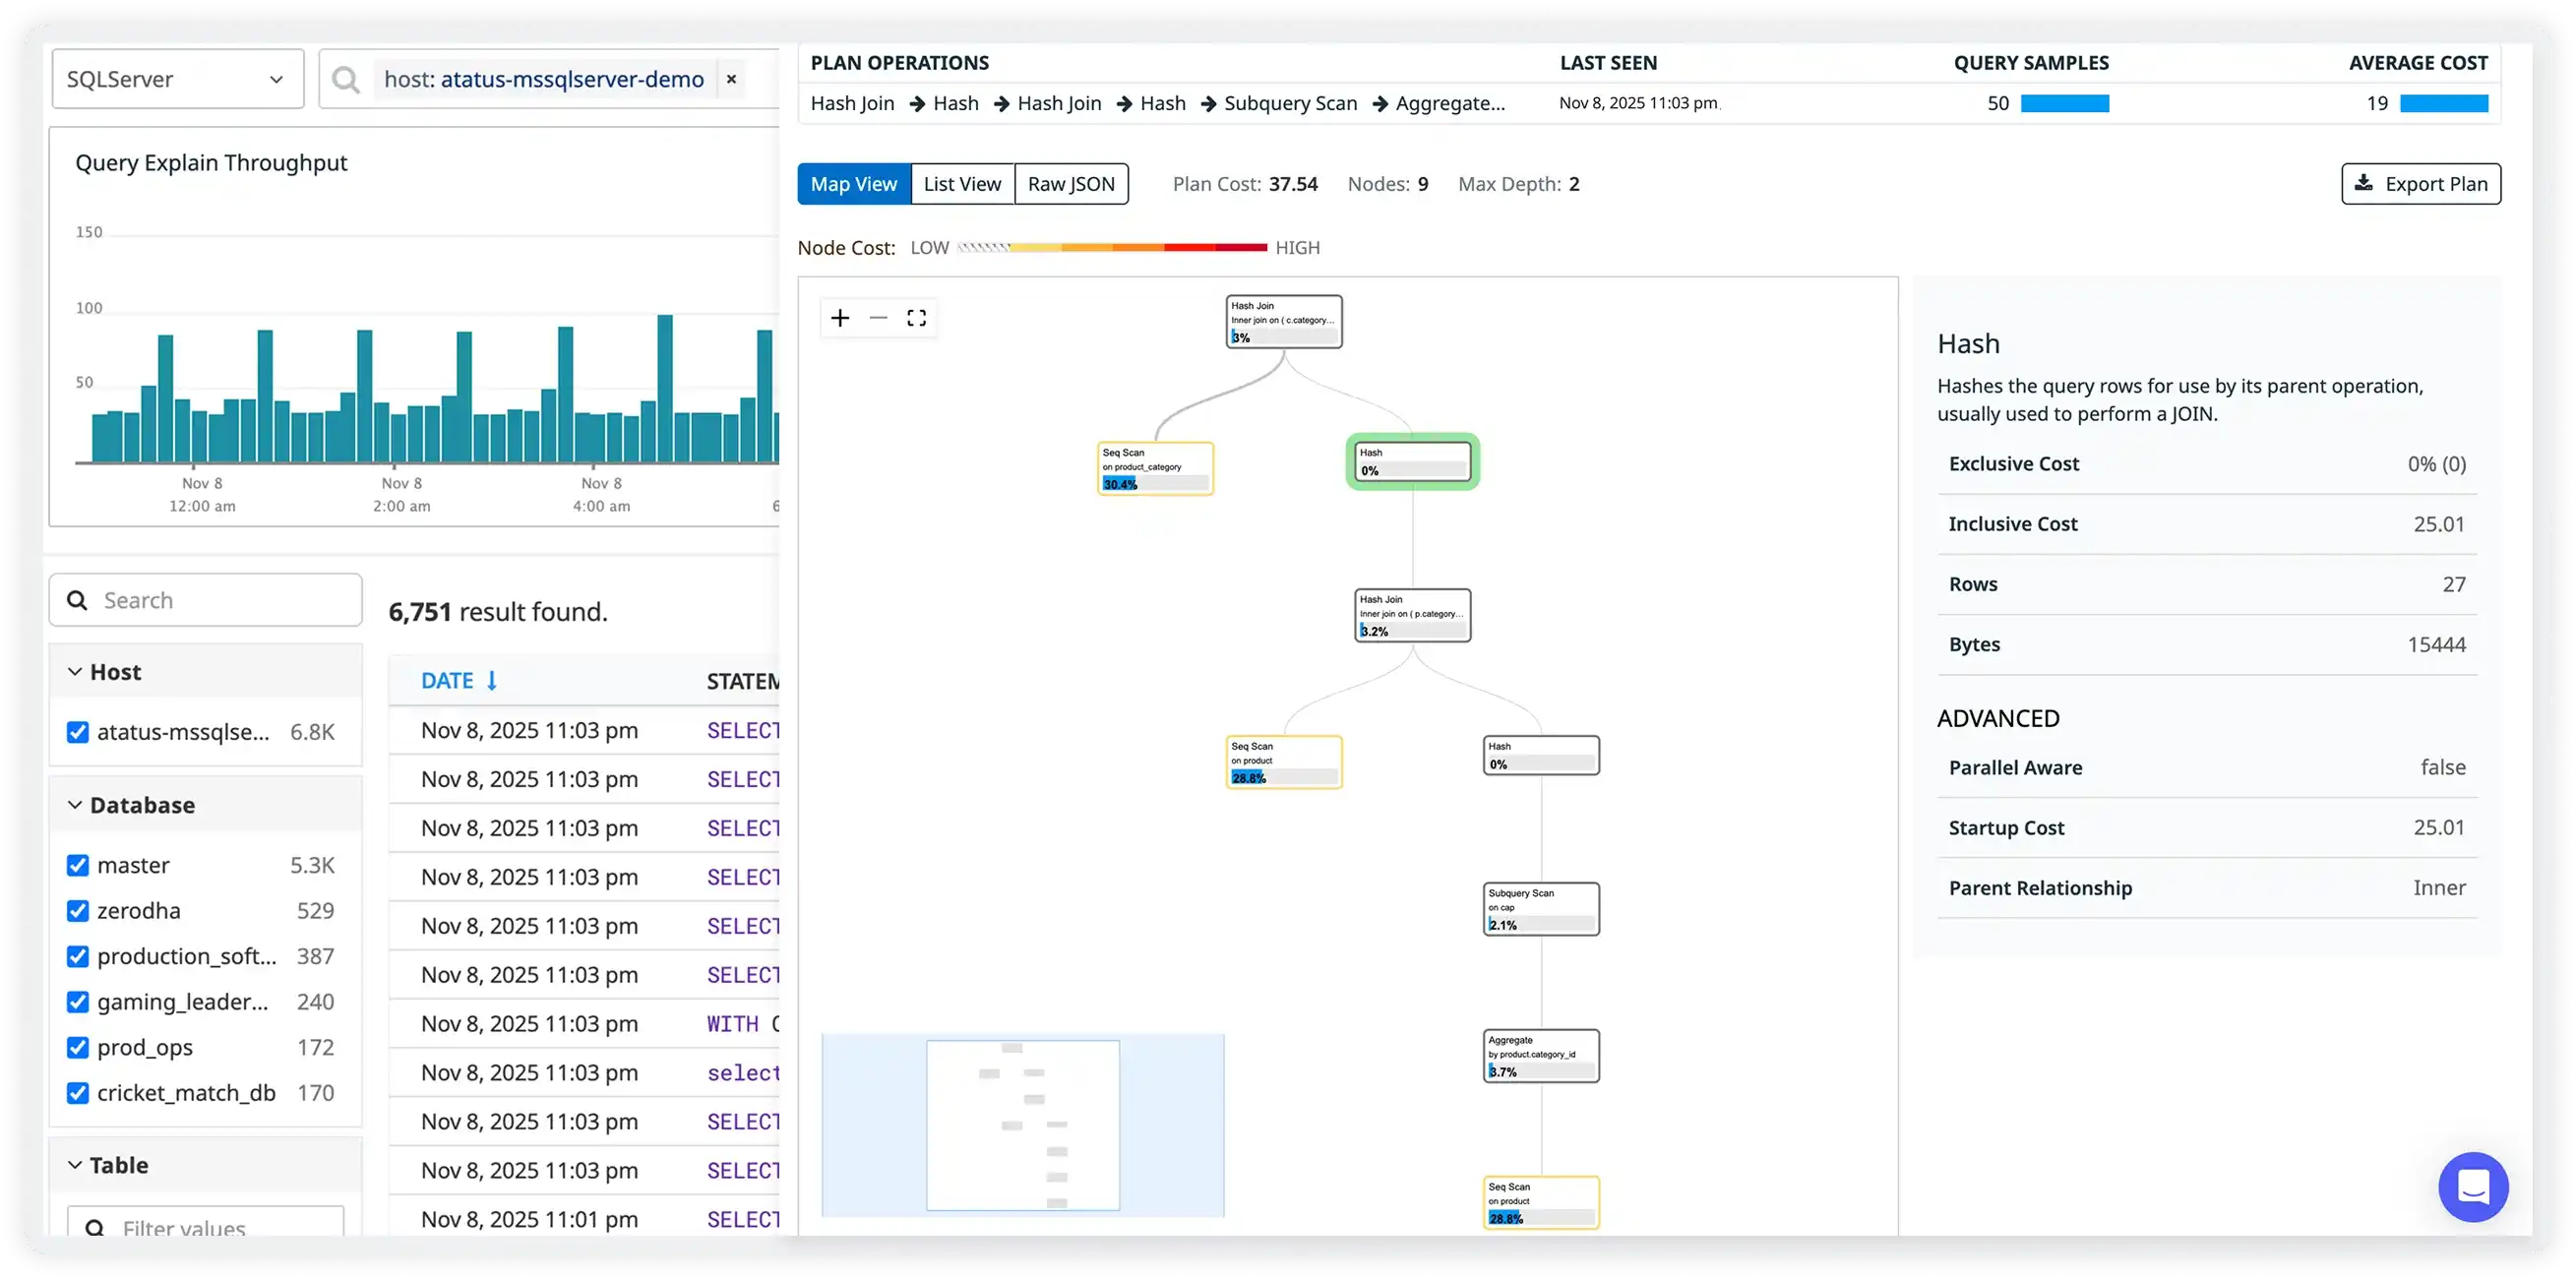
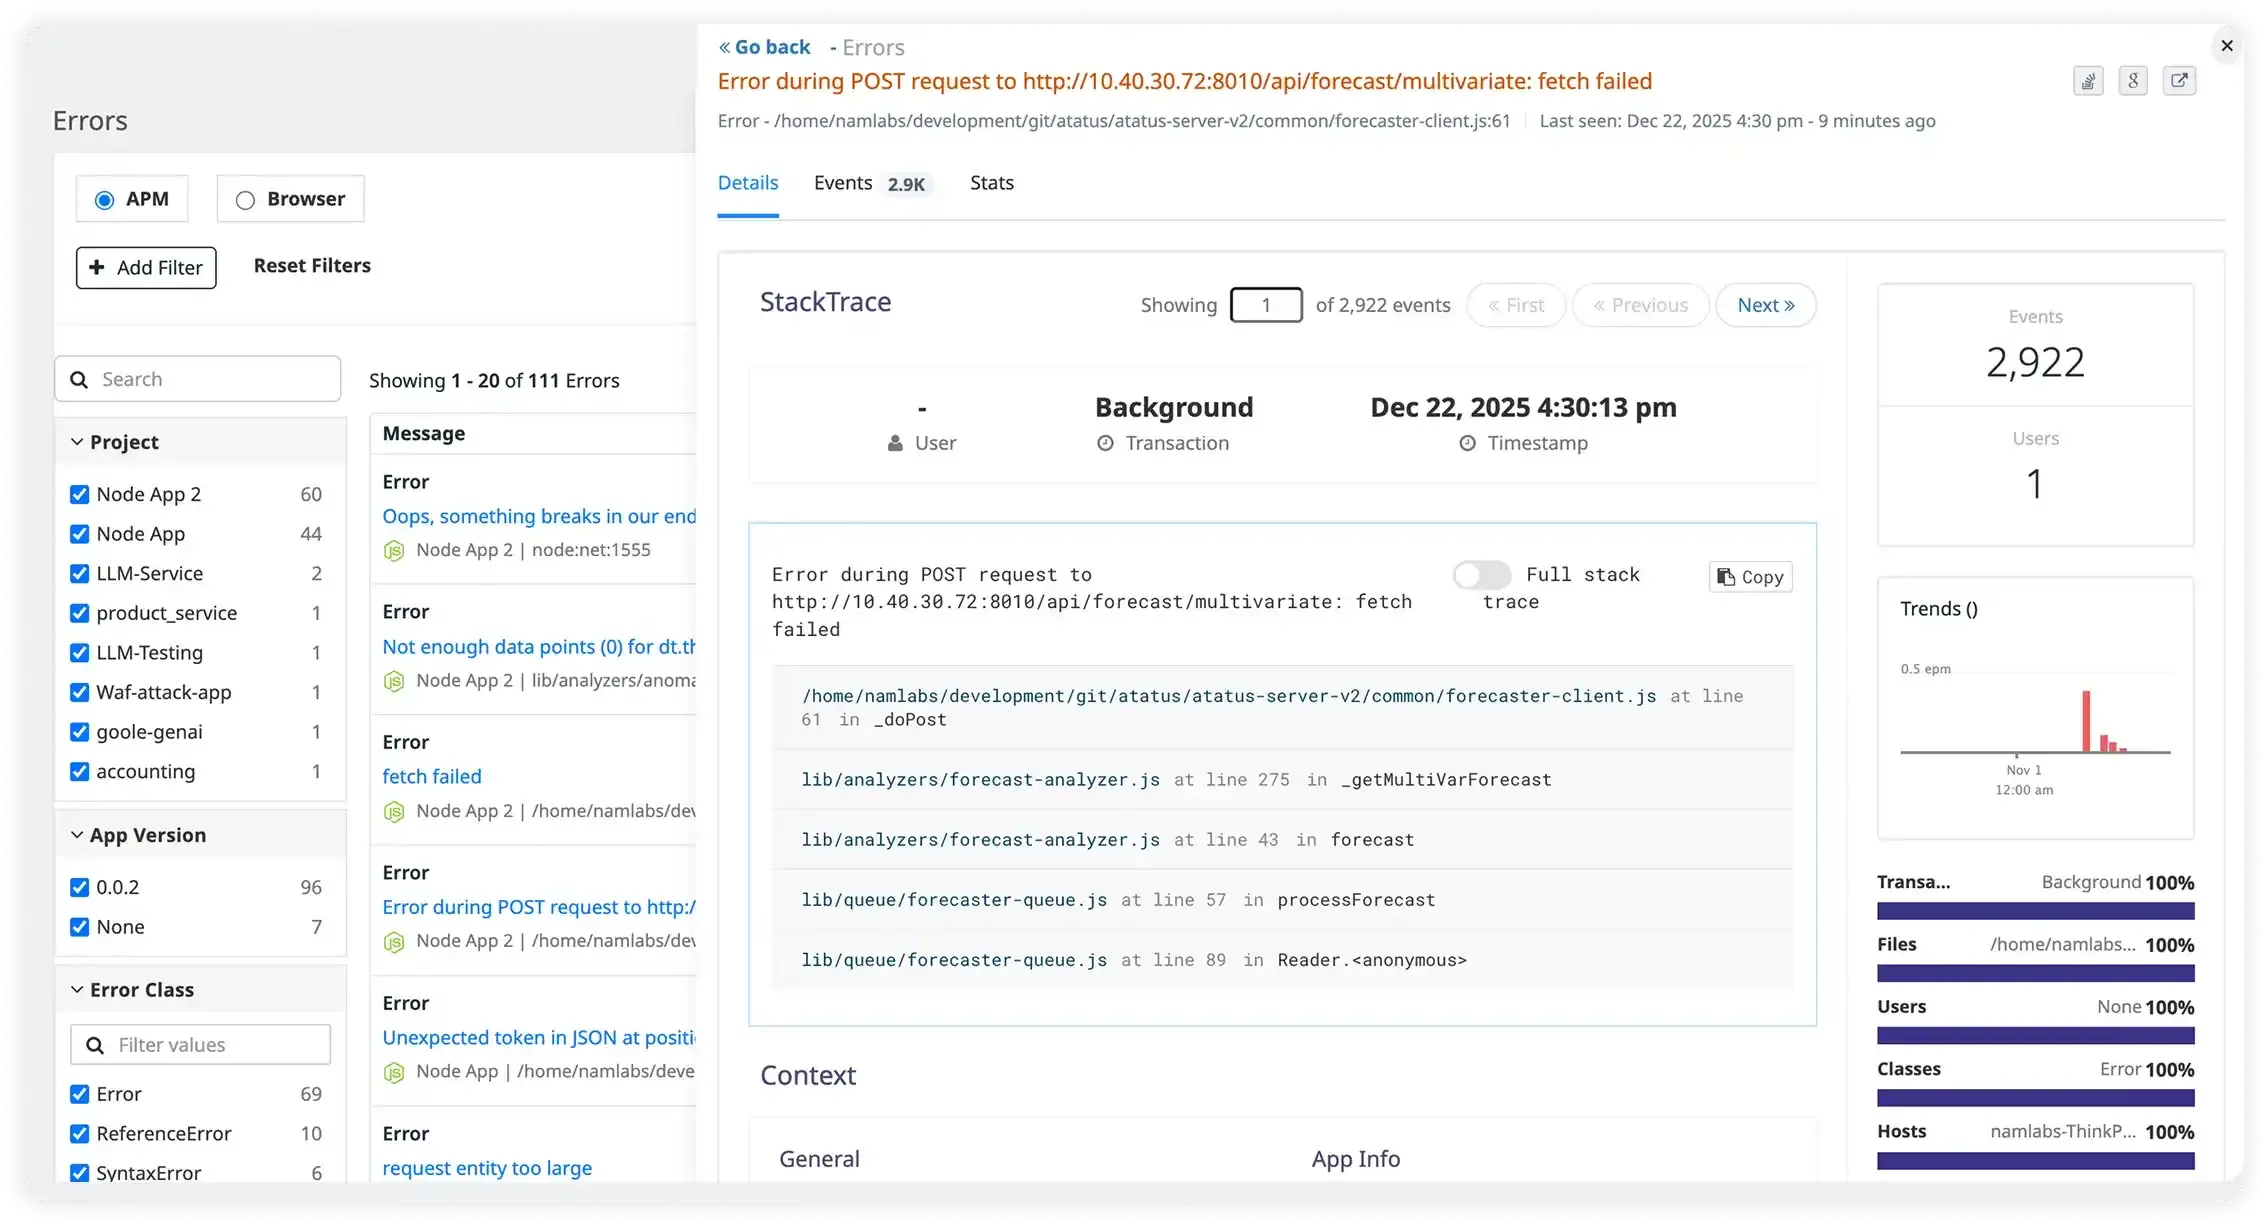
APM shows the queries your application runs inside each trace, and database monitoring shows the database's side, with query samples, explain plans and locks. Together they show whether a slow request comes from the query or from the code around it.
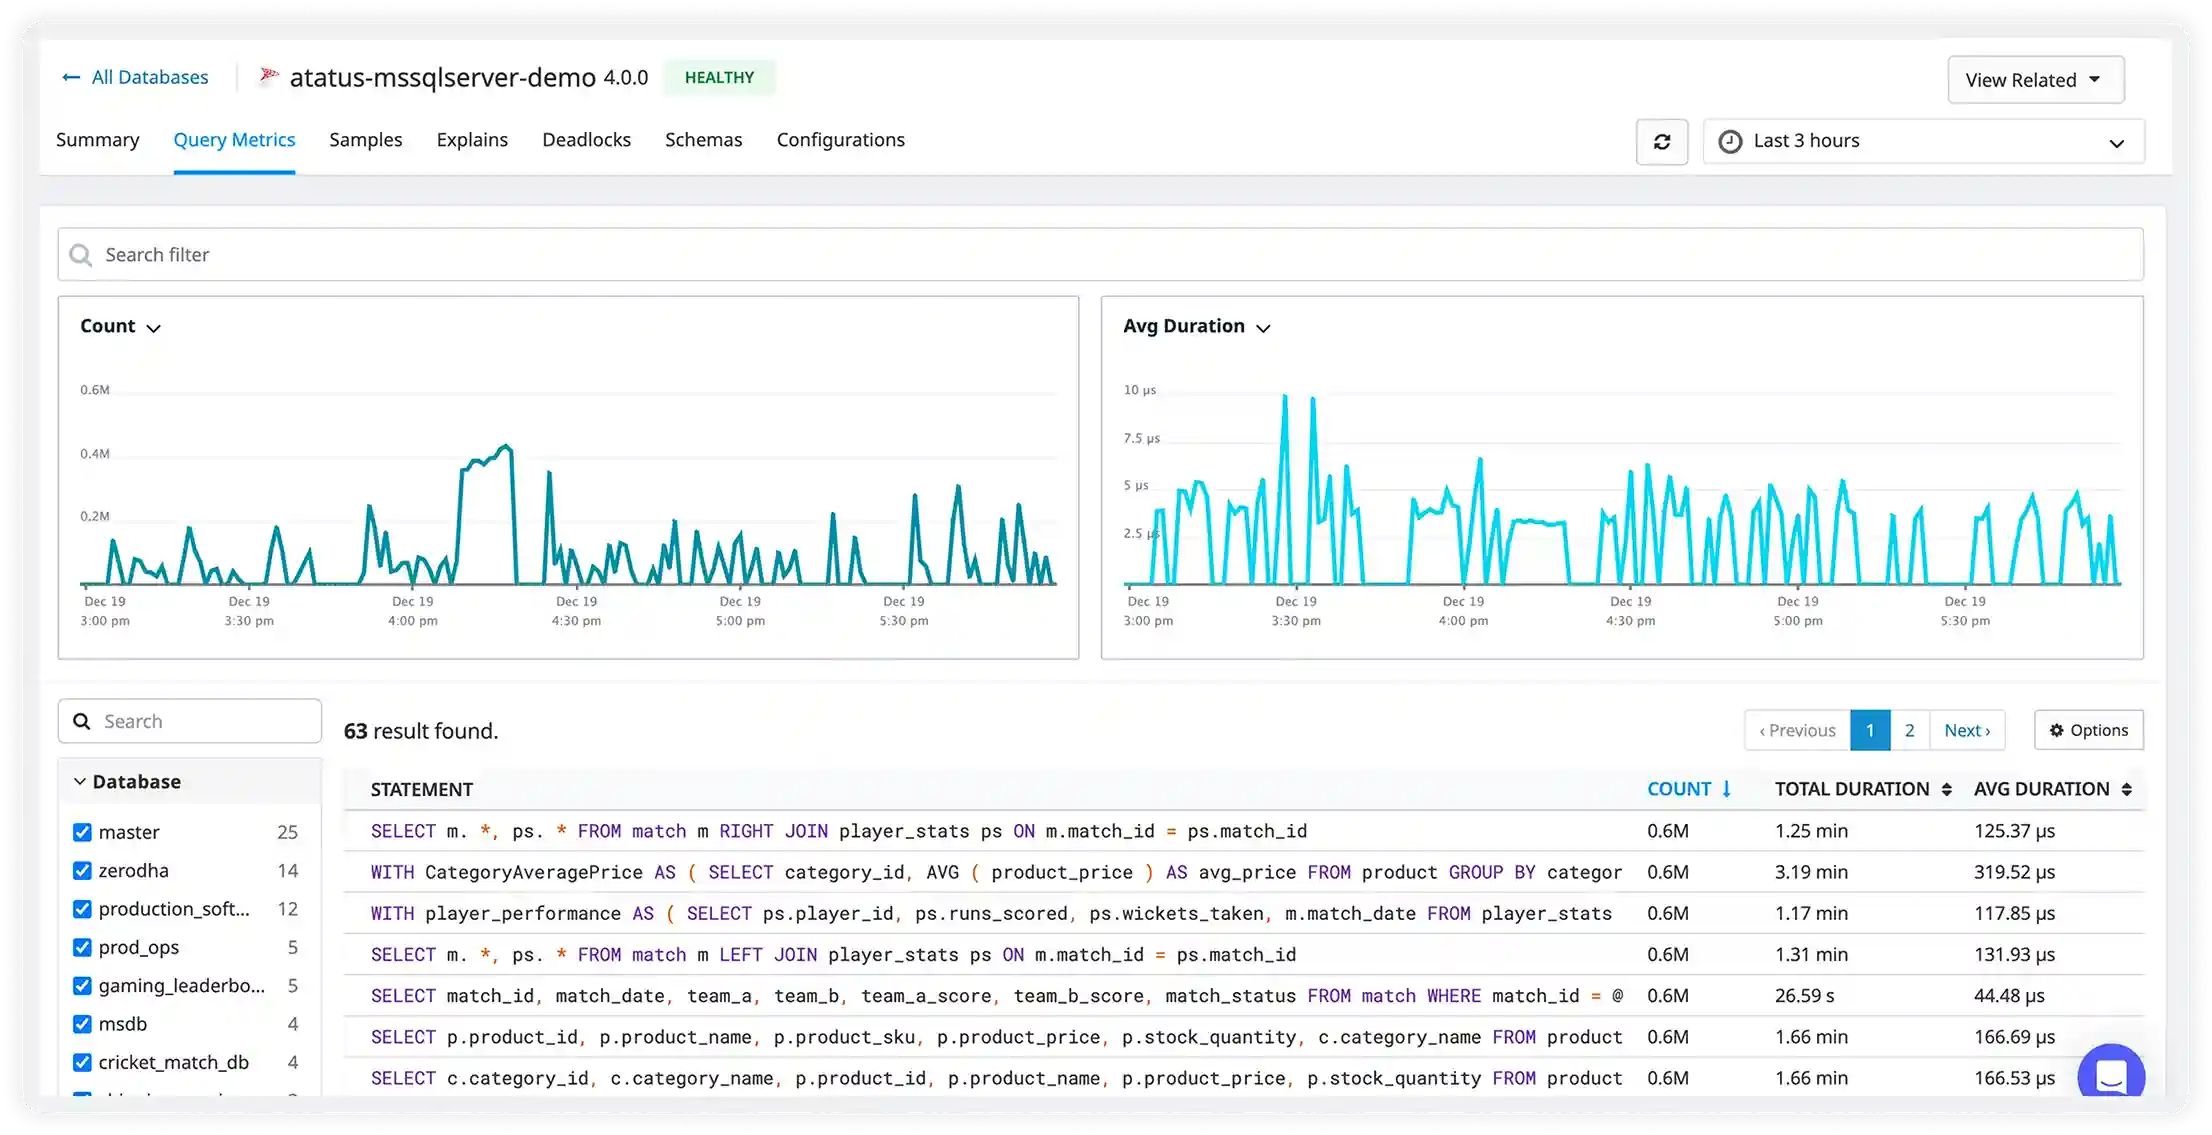
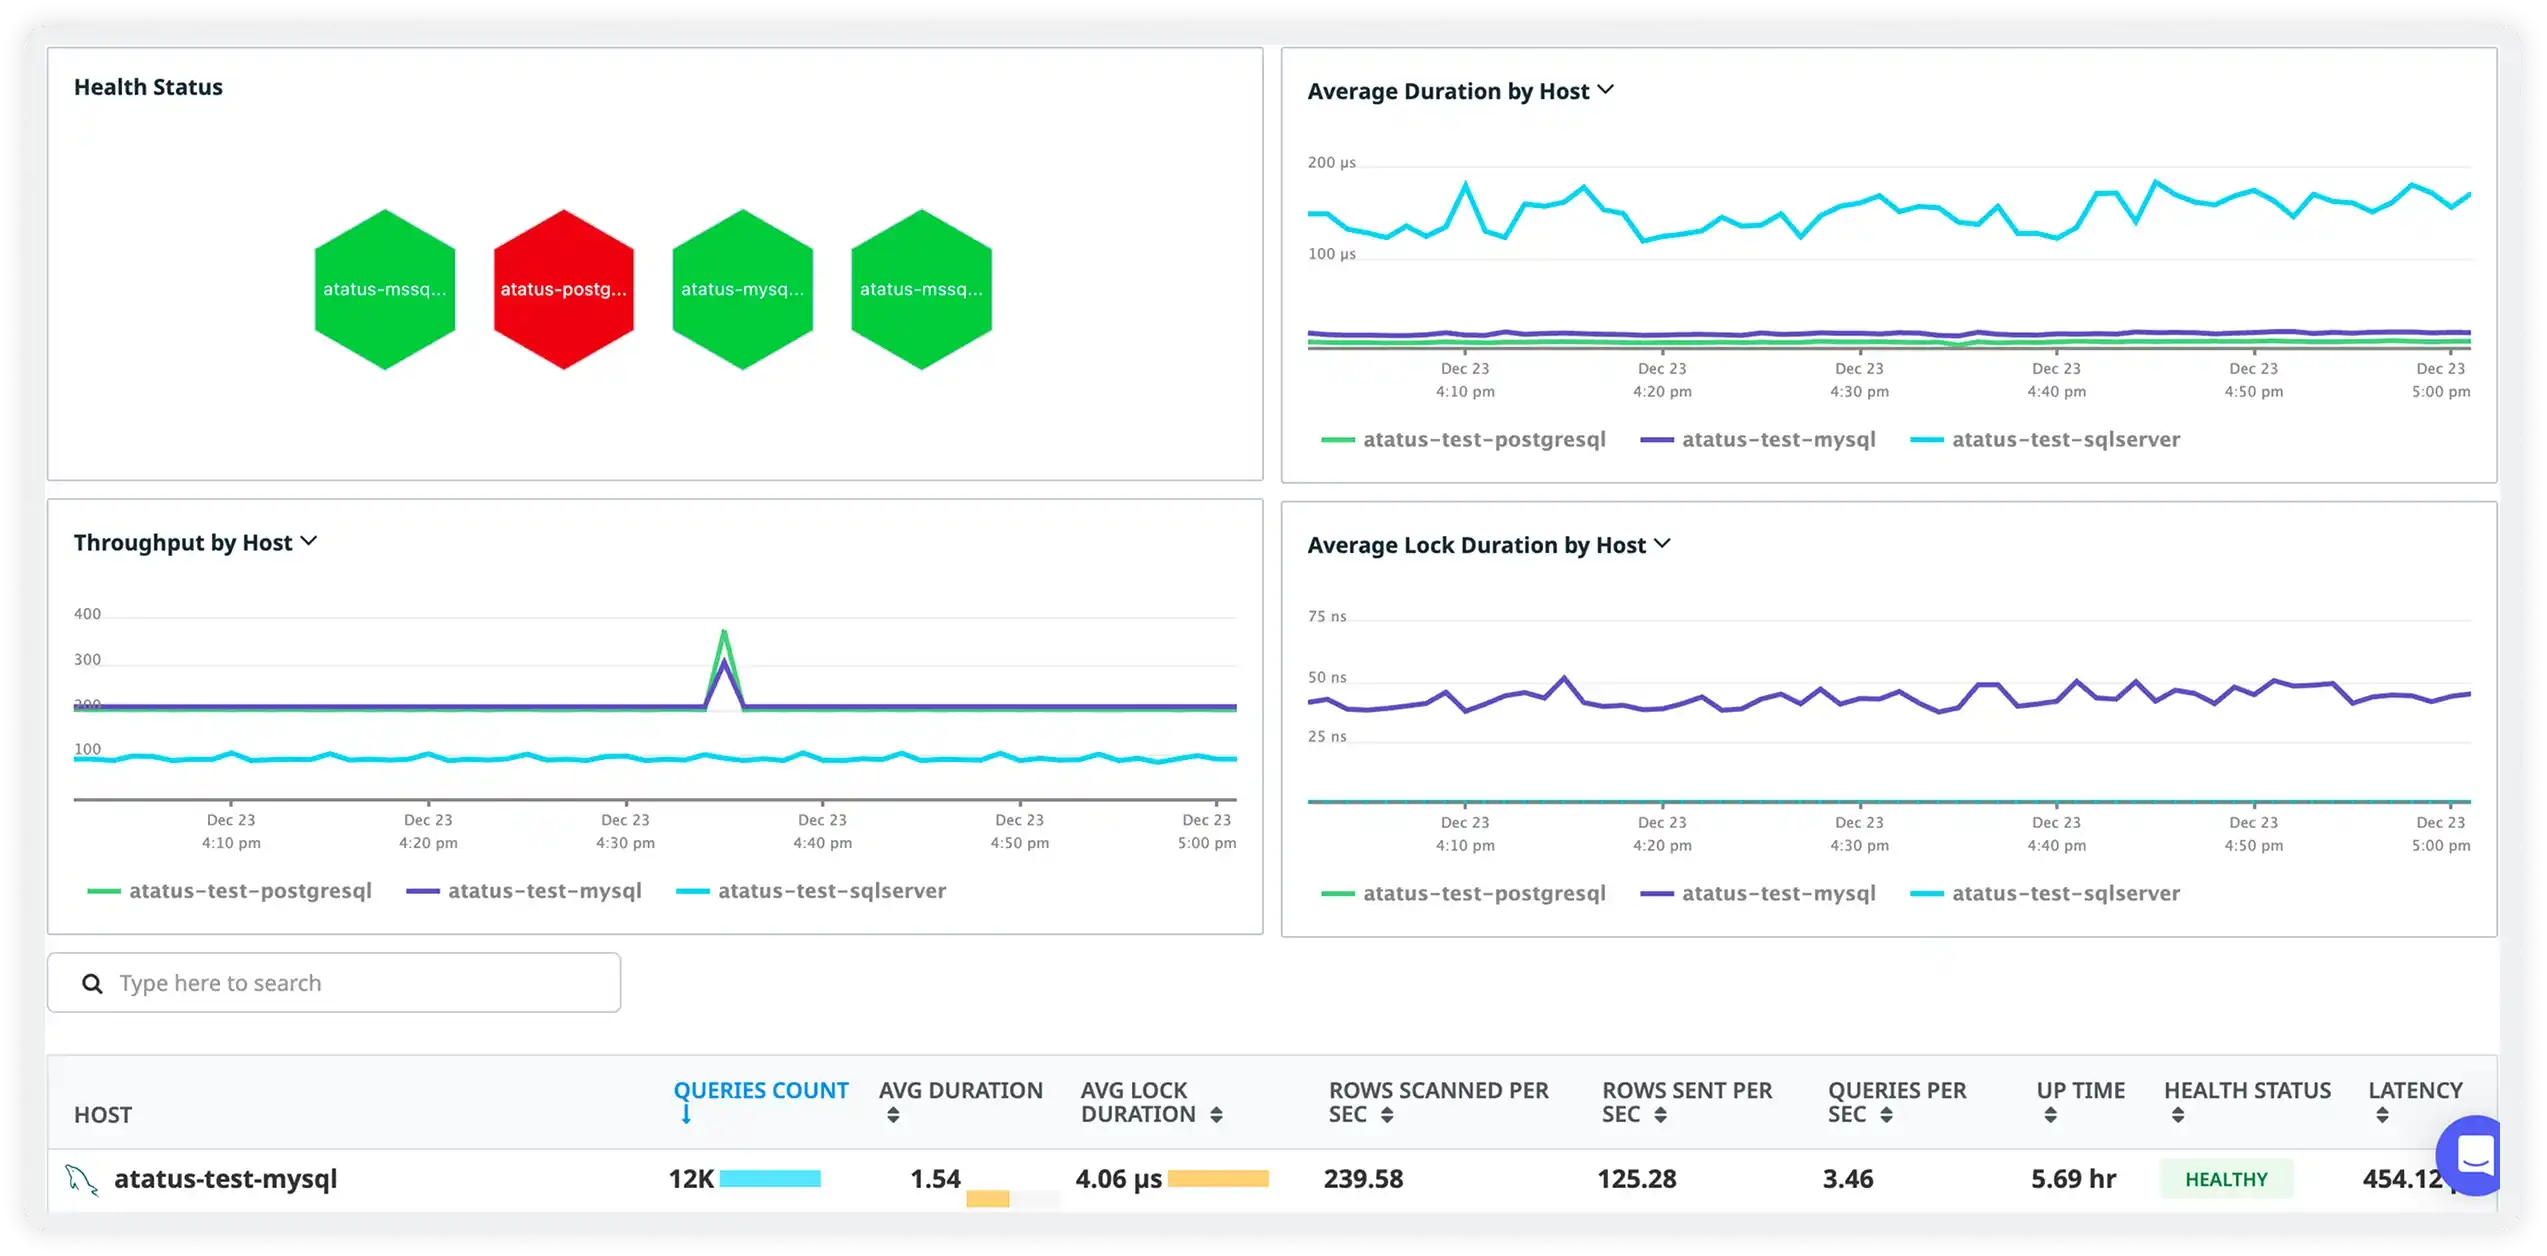
Database monitoring runs through the same Atatus Infrastructure Agent that reports host metrics, so query data sits in one account with APM traces, logs and server health. Custom dashboards can mix widgets from all of them.
Atatus supports MySQL, PostgreSQL, SQL Server, Oracle, MongoDB, ClickHouse and AWS DocumentDB, with setup guides for self-hosted servers, Amazon RDS and Aurora, Google Cloud SQL and Azure. The agent connects as a read-only database user.
Database monitoring is priced per database host, starting at $59 per host per month billed annually. Every plan includes unlimited team members, and the 14-day free trial needs no credit card.
Pro-actively monitor, analyze and optimize the performance-related issues in your back-end apps and databases.
ExploreComplete visibility into end-user experience of your website and identify problematic parts of a web page.
ExploreGet full visibility into your infrastructure performance and availability issues of all your servers and cloud instances.
ExploreAggregate, search, filter, sort and analyze all your logs from different sources along APM traces at any scale in real-time.
ExploreContinuously monitor the availability of your application, detect and resolve issues before your customers encounter them.
ExploreMonitor all your APIs and check how they are used, what payloads are being sent, which users are active, and more.
ExplorePricing, deployment, data and the agent. If something is missing, a person will answer it on a demo call.
Database monitoring, also known as database performance monitoring, is the process of continuously tracking database metrics in real time. It helps teams gain insights into the health, performance, and behavior of their database systems by monitoring query execution, identifying performance bottlenecks, and ensuring overall system efficiency.
The biggest challenge in database monitoring is knowing what to track. Monitoring everything can overload your team with too much data. Atatus makes this easier by focusing on the metrics that matter most, like query time, slow queries, lock waits and host resource usage, so you can find and fix issues without getting lost in unnecessary details.
Sql Power Tools focuses on database servers: it captures SQL activity by network sniffing, tracks SQL wait times, and sells a separate database security product. Atatus monitors databases next to the applications that query them. APM traces show the queries your code runs, database monitoring shows query samples, explain plans and locks on the database side, and logs, infrastructure and uptime monitoring are in the same account.
Database monitoring is priced per database host, and each host keeps up to 200 normalized queries. One account can monitor databases on your own servers and on managed services such as Amazon RDS and Aurora, Google Cloud SQL and Azure.
Yes. Atatus supports MySQL, PostgreSQL, SQL Server, Oracle, MongoDB, ClickHouse and AWS DocumentDB, self-hosted or on managed services such as Amazon RDS and Aurora, Google Cloud SQL and Azure. Sql Power Tools also covers DB2, Informix and SAP Sybase, which are not on the Atatus list, so check your engines before you switch.
Yes. Atatus custom dashboards can mix database, APM, log and infrastructure widgets, and ready-made dashboards such as MySQL give you a starting point.
Yes. Atatus offers a 14-day free trial with no credit card required, and you can request a demo. Email support is included on every plan to help with setup and troubleshooting.
"Solid Product even better support." The integration path is incredibly simple/easy and the overall interface is very intuitive. That said, I had a handful of odd use cases that the support team was incredibly responsive in helping me work through.
Start free and send your first trace with OpenTelemetry or the Atatus agents. APM, logs, RUM, infrastructure and SIEM, all on one timeline.