Why Observability Is Essential for Platform Engineers?
Platform engineers are infrastructure product managers. Their customers are developers. And like any product, the platform fails silently without the right instrumentation until a dev team Slacks you at 2 AM asking why their deployment broke three services they didn't even touch.
Observability is how platform teams stop being the answer to every question and start building platforms that answer those questions themselves. This article explains specifically how observability enables platform engineers to support development teams better which reducing ticket volume, cutting MTTR, enabling SLO ownership, and making microservice debugging something devs can do without escalating to you.
What's in this article?
- The Real Problem: Devs Can't Debug What They Can't See
- How Siloed Logs and Traces Inflate MTTR?
- Shared Visibility Across Microservices
- Observability as an Onboarding Accelerator
- Making SLOs Real with Metrics and Tracing
- Observability in the Golden Path
- What Good Observability Looks Like for Platform Teams?
- How Atatus Supports Platform Engineers?
The Real Problem: Devs Can't Debug What They Can't See
Ask any platform engineer what eats their time and the answer is almost always the same: support tickets from developers who can't tell whether their problem is their code, your platform, or something three services away.
This isn't a people problem. It's an instrumentation problem. When platform teams ship self-service infrastructure without shipping observability alongside it, developers get autonomy over deployments but zero visibility into runtime behavior. The result is a predictable pattern:
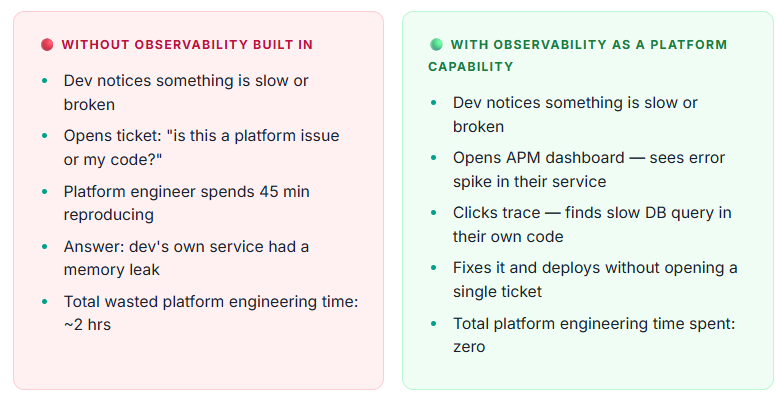
The platform team's job is to make that second scenario the default, not through documentation alone, but by shipping observability as table stakes, the same way you ship CI/CD templates and self-service provisioning.
The key insight: Observability isn't a tool platform teams use for themselves. It's a capability platform teams build for dev teams. When devs can answer "why is my service broken?" without escalating, the platform is doing its job.
How Siloed Logs and Traces Inflate MTTR?
MTTR is one of the four DORA metrics that directly reflects engineering effectiveness. In most organizations, the biggest driver of slow MTTR isn't team skill or process. It's context fragmentation: the information needed to diagnose an incident lives in three different tools, under three different login credentials, with no way to correlate them.
Here's what that looks like in practice at the platform level:
- Application logs are in one system (CloudWatch, Splunk, or a self-hosted ELK stack)
- Infrastructure metrics are in another (Prometheus/Grafana, Datadog, or cloud-native dashboards)
- Distributed traces - if they exist at all are in a third (Jaeger, Zipkin, or Tempo)
- Each tool has a different query language, a different data model, and a different time-alignment
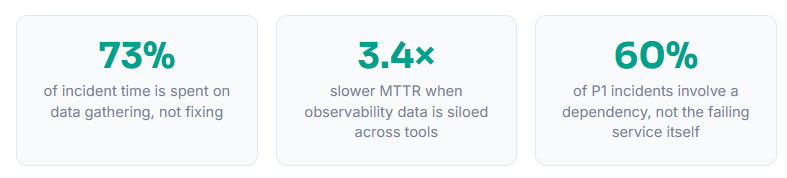
When an incident fires, engineers spend the first 20-40 minutes not diagnosing, they're gathering. Correlating a log timestamp from one tool with a latency spike in another with a trace that may or may not have been sampled. By the time they have the full picture, the damage is already done.
For platform teams, this creates a two-sided problem. First, when the platform infrastructure itself has an incident (CI/CD degradation, Kubernetes control plane issue, networking fault), fragmented observability slows your own recovery. Second and more costly at scale, every development team you support inherits this same fragmented diagnostic experience.
The platform team's leverage point
Platform teams have something no individual dev team has: the ability to set the observability standard for the whole organization. By shipping a unified observability layer as part of the platform - one where logs, metrics, and traces are correlated by default, you solve the fragmentation problem once, for everyone, rather than letting every team solve it badly on their own.
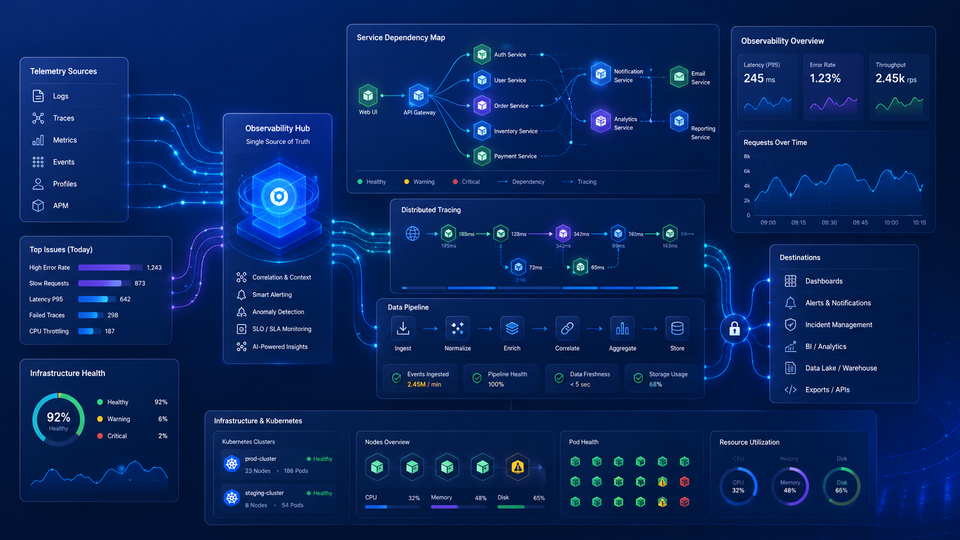
That means when a developer on any team opens their service dashboard, they see the full picture in one place: error rate, latency distribution, infrastructure utilization, and the traces that connect their service to every upstream and downstream dependency. The question "is this my code or the platform?" becomes answerable in seconds.
Shared Visibility Across Microservices
Microservice architectures distribute both capability and failure. A single user request may touch eight services before returning a response. When that request fails, the error surfaces at the edge but the root cause is buried somewhere in the dependency chain. Without shared observability infrastructure, finding it is detective work.
The microservices visibility gap: Every service team can see their own service's logs and metrics. No team can see the full request path that crosses service boundaries, unless the platform provides distributed tracing by default.
What distributed tracing gives platform teams?
Distributed tracing instruments each service to emit a trace. A structured record of every operation performed while handling a request, along with its duration and relationships to child operations in downstream services. When traces from every service flow into the same backend, platform teams and dev teams can:
- See the full call graph for any request - which services it touched, in what order, and how long each step took
- Identify which service introduced latency - isolating whether a 2-second response time came from a slow database query in Service A or network overhead between Service B and Service C
- Find cascading failure sources - when Service D goes down and Services E, F, and G all start failing, traces show the dependency direction immediately
- Attribute errors to their origin - instead of every service showing errors, the trace shows exactly where the error was first raised
Is your platform team the first call every time something breaks?
Why this is a platform responsibility, not a dev team responsibility?
Distributed tracing only works when every service participates. If three teams instrument their services and two don't, traces break at the boundary, you get partial graphs that mislead more than they help.
This makes tracing a platform-level concern. Platform teams that bake OpenTelemetry instrumentation into their deployment templates, so that every new service gets tracing automatically which achieve full trace coverage without requiring each team to implement it independently. The platform does the heavy lifting once; every team inherits the benefit.
| Observability Approach | Who Instruments | Coverage | Time to First Trace | Maintenance |
|---|---|---|---|---|
| Each team instruments independently | Every dev team | Inconsistent | Weeks to months per service | High fragmented |
| Platform ships OTel in deploy templates | Platform team once | Universal | Day 1 for all new services | Low centralized |
| Platform + auto-instrumentation agents | Platform team once | Universal + automatic | Immediate on deploy | Minimal agent-managed |
Observability as an Onboarding Accelerator
Developer onboarding time is a direct measure of platform quality. When a new engineer joins, how long does it take them to deploy their first change to production? And critically how long until they can diagnose their own service issues without asking someone for help?
For most organizations, that second milestone takes weeks. Engineers spend the first month asking "where do I look when something goes wrong?" and getting different answers from every senior engineer they ask, because everyone has their own patchwork of scripts, dashboards, and tribal knowledge.
What observability-first onboarding looks like?
When observability is built into the platform, every new service starts with a pre-configured baseline:
- A default service dashboard showing error rate, request latency (p50, p95, p99), throughput, and infrastructure utilization available from the first deployment
- Automatic distributed tracing so the first time a new engineer's service has a latency issue, they can click into a trace instead of adding log statements and redeploying
- Log routing and structured logging defaults so logs are searchable from day one with the same query syntax every other team uses
- Runbook links in alert templates so when an alert fires on a new engineer's service, the alert message includes what to look at first
Platform metric to track: Time from first commit to first independent incident resolution without opening a ticket with the platform team. This is a direct measure of how well your observability layer enables developer self-sufficiency.
The compounding effect
Observability-first onboarding pays dividends beyond the first month. Engineers who learn to debug using traces and metrics from day one build that muscle permanently. They write more observable code because they've experienced what observable code looks like in production. They add meaningful instrumentation rather than log spam. They design services with error budgets in mind because they've seen SLO dashboards since their first week.
The platform team's investment in baseline observability compounds through every engineer it onboards. A team of 10 platform engineers serving 200 developers can multiply their impact this way in a way that no amount of ticket resolution ever could.
Making SLOs Real with Metrics and Tracing
Service Level Objectives (SLOs) are one of the most powerful reliability practices available to platform teams. They shift the question from "is this service up?" to "is this service meeting its reliability commitments to users?" and they give development teams a quantitative basis for prioritizing reliability work.
But SLOs are only as good as the metrics behind them. An SLO without instrumentation is a policy, not a practice.
How platform teams enable SLO ownership
The platform team's role in SLOs is not to own the objectives that belongs to the service teams. The platform team's role is to provide the infrastructure that makes SLOs measurable, visible, and actionable:
- Standardized SLI instrumentation: Request success rate, latency, and availability are the most common SLIs. Platform teams that ship OpenTelemetry-based instrumentation as part of the deployment template give every service team these metrics automatically, without requiring them to instrument from scratch.
- Error budget dashboards: An error budget is what remains between the current performance and the SLO threshold. Platform teams can provide a standard error budget dashboard template that shows each team how much budget they've consumed and how quickly they're burning through it.
- Automated SLO alerts: When a service's error budget burn rate accelerates for example, consuming a week's worth of budget in a single hour where automated alerts allow teams to respond before the budget is exhausted. Platform teams can template these alerts so each team gets them configured from day one.
- Cross-service SLO visibility: For platform teams supporting microservice architectures, a dependency's SLO breach often predicts a downstream service's breach. Distributed tracing tied to SLO metrics gives platform teams early warning of cascading reliability problems.
SLOs without tracing are incomplete
Metrics tell you what is wrong: error rate is elevated, latency at the 95th percentile is spiking. Traces tell you why: the downstream payment service is timing out, and it's affecting 12% of checkout requests. An SLO breach is only actionable when both signals are available and correlated. Platform teams that provide this correlation metrics alerting that links directly to the relevant trace eliminate the investigation step from most SLO incidents.
Observability in the Golden Path
A golden path is the opinionated, pre-built route from code to production that platform teams design for development teams. It encodes the organization's standards for security, compliance, and reliability. Observability belongs in the golden path, not as an optional extra, but as a baseline requirement that every service inherits automatically.
What observability in the golden path looks like in practice?
- Deployment templates with OTel auto-instrumentation - every service template includes the OpenTelemetry SDK or agent configured to export traces and metrics to the platform's observability backend
- Sidecar-based log collection - log collection agents deployed alongside every service container, routing structured logs to the centralized log management system with service name, environment, and version tags pre-populated
- Default alert rules - CPU, memory, error rate, and latency alerts pre-configured for every service that opts into the golden path, with sensible thresholds that can be overridden at the service level
- Service dashboard provisioning - a standard Grafana or Atatus dashboard provisioned automatically when a new service is registered in the service catalog, pre-connected to that service's metrics and logs
- Health endpoint standards - platform-defined conventions for
/health,/ready, and/metricsendpoints included in service scaffolding, ensuring Kubernetes liveness and readiness probes have accurate signal from day one
The design principle: Make the observable service the easiest service to build. If adding instrumentation requires extra steps, developers skip it. If it's included in the scaffold by default, everyone benefits without thinking about it.
What Good Observability Looks Like for Platform Teams?
Platform teams face a specific challenge with observability: they need to provide visibility coverage across every service in the organization while keeping the operational overhead of that infrastructure manageable. The following is what a mature, platform-team-operated observability stack provides to development teams.
| Capability | What Platform Team Provides | What Dev Teams Can Do |
|---|---|---|
| Application Performance Monitoring | Auto-instrumented APM agents in deploy templates; centralized APM backend | Debug slow transactions, find error root causes, track response times without manual setup |
| Distributed Tracing | OTel collector + trace storage; trace propagation in service mesh | Follow any request across service boundaries; find exactly which service introduced latency |
| Log Management | Centralized log aggregation with standard schema; retention policies; search interface | Search logs across all services; correlate log events with traces; set log-based alerts |
| Infrastructure Monitoring | Kubernetes cluster metrics; node and pod health dashboards; resource utilization tracking | Understand whether a service issue is application-level or infrastructure-level without asking the platform team |
| Real User Monitoring | Frontend performance SDK in standard web templates; session and error tracking | Correlate backend service degradation with real user impact; prioritize fixes by user-facing severity |
| Synthetic Monitoring | Platform-managed health checks against service endpoints; uptime dashboards | Know before users report that a critical user journey is broken |
| SLO Dashboards | Standard SLO dashboard templates tied to APM metrics; error budget burn rate alerts | Track reliability commitments without building custom dashboards from scratch |
The consolidation principle
Platform teams that operate separate tools for each of these capabilities spend a disproportionate amount of time on observability infrastructure maintenance rather than platform development. Managing five different vendor relationships, five different data pipelines, and five different access control models is itself a form of tool sprawl.
The practical goal for most platform teams is to consolidate onto the smallest number of observability tools that provide full coverage, ideally a unified platform where APM, tracing, logs, infrastructure metrics, RUM, and synthetics share a common data model and a single interface. When an incident occurs, the developer should be able to pivot from error rate to traces to correlated logs to infrastructure metrics without leaving the same screen.
How Atatus Supports Platform Engineers?
Atatus is built for exactly the consolidation challenge platform teams face: full-stack observability in a single platform, designed to be deployed once at the platform level and consumed by every development team across the organization.
Here is how each Atatus capability maps to the specific platform engineering use cases covered in this article:
- APM + Distributed Tracing: Auto-instrument every service deployed through your golden path. Dev teams get full request traces from day one, no per-service setup. Pivot from an APM error directly to the trace that caused it, correlated with the log events at the exact timestamp.
- Infrastructure & Kubernetes Monitoring: Cluster health, node resource utilization, pod restart counts, and deployment status, all visible alongside the application metrics for the workloads running on that infrastructure. Dev teams can confirm in seconds whether their service issue is code or cluster.
- Log Management: Centralized log aggregation from every service, with full-text search, structured log parsing, and log-to-trace correlation. Platform teams set the schema standard once; dev teams get searchable, correlated logs without managing their own log infrastructure.
- Real User Monitoring (RUM): Frontend performance, JavaScript error tracking, and session replay, deployed once via your standard web service template. When a backend deployment degrades frontend load times, RUM surfaces the user-facing impact immediately alongside the backend trace.
- Synthetic Monitoring: Platform-managed uptime checks against critical service endpoints and user journeys. Know before your users or your support Slack channel that something is broken. Configurable from the Atatus dashboard without requiring infrastructure changes.
- SLO Tracking & Error Budgets: Define SLOs on top of APM metrics and get automated error budget burn rate alerts. Dev teams see their reliability position without building custom dashboards. Platform teams get organization-wide SLO health in a single view.
Platform teams deploying Atatus typically reduce the number of observability tools they operate from four or five down to one, eliminating the integration maintenance, the vendor overhead, and the context-switching that slows incident response.
Development teams get a single destination for all observability questions, which dramatically reduces the volume of "is this my service or the platform?" tickets reaching the platform team.
Give Every Dev Team the Visibility to Resolve Issues Independently
Frequently Asked Questions
1) What is observability in platform engineering?
Observability in platform engineering is the set of tools and practices that help developers understand how their services behave in production. It typically includes metrics, logs, distributed traces, and user experience monitoring provided as a shared platform capability.
2) Why does observability reduce support tickets for platform teams?
When developers have access to metrics, logs, and traces by default, they can often identify whether an issue is in their application or the platform. This reduces dependency on platform engineers and lowers the volume of support requests.
3) What is distributed tracing and why do platform engineers need it?
Distributed tracing tracks a request as it moves across multiple services. It helps platform engineers quickly identify bottlenecks, latency issues, and root causes that would otherwise require investigating several services separately.
4) How does observability improve developer onboarding?
Built-in observability gives new engineers immediate access to dashboards, alerts, and traces. This helps them understand system behavior faster and become productive without relying heavily on senior team members.
5) What is an SLO and how does observability make it actionable?
A Service Level Objective (SLO) is a reliability target, such as a percentage of successful requests or response-time goals. Observability tools measure performance against these targets and alert teams when reliability starts to decline.
6) What observability tools should platform teams use?
Most platform teams use OpenTelemetry for instrumentation and a unified observability platform that combines APM, tracing, logs, infrastructure monitoring, RUM, and synthetic monitoring to simplify operations and reduce tool sprawl.
7) What metrics should platform teams track for their own observability stack?
Platform teams should track observability adoption, support ticket volume, incident resolution time, observability platform uptime, trace and log ingestion performance, and alerting reliability to ensure the platform delivers value.
8) How does Kubernetes monitoring differ from application monitoring?
Application monitoring focuses on service performance, request latency, errors, and traces. Kubernetes monitoring focuses on infrastructure health, including nodes, pods, resource usage, restarts, and cluster performance. Together they provide complete visibility into application and infrastructure issues.
#1 Solution for Logs, Traces & Metrics
![]() APM
APM
![]() Kubernetes
Kubernetes
![]() Logs
Logs
![]() Synthetics
Synthetics
![]() RUM
RUM
![]() Serverless
Serverless
![]() Security
Security
![]() More
More

![New Relic vs Splunk - In-depth Comparison [2026]](/blog/content/images/size/w960/2024/10/Datadog-vs-sentry--19-.png)
![New Relic vs Sentry - Which Monitoring Tool to Choose? [2026]](/blog/content/images/size/w960/2024/10/VS--1-.png)
![Datadog vs Splunk: A Side-by-Side Comparison [2026]](/blog/content/images/size/w960/2024/12/Untitled-design--41-.png)