Observability vs Monitoring: Which is Better?
Distributed architectures are becoming an increasingly important source of application services for organizations. Advances in observability and monitoring are being driven by this trend. But exactly how do observability and monitoring differ from one another?
It's essential to know when something goes wrong in the application delivery chain so you can identify the root cause and resolve it before it has an impact on your business.
Monitoring and observability offer a two-pronged strategy. Monitoring is used to offer situational awareness, and observability helps identify what is happening and what has to be done about it.
We'll examine the differences between observability and monitoring to better understand them. Then, we'll look at how to combine the two for optimum business results.
We will cover the following:
- What is Monitoring?
- What is Observability?
- Observability vs Monitoring: Key Similarities and Differences
- Observability vs Monitoring: Use Cases
- Monitoring vs Observability: Which is More Important?
- Observability and Monitoring: Which is Better?
#1 What is Monitoring?
Monitoring is the process of instrumenting particular infrastructure and application components to gather data (typically metrics, events, logs, and traces) and then analyzing that data about thresholds, recognized patterns, and error conditions to produce insights that can be used to take appropriate action.
A system's external behavior is the main focus of monitoring, particularly the data intended to be collected. The most successful environments for monitoring are those that are reasonably steady and where critical performance metrics and normal versus abnormal behavior are understood. Monitoring was an appropriate strategy for managing the environment when enterprise IT was primarily managed in a company's own data center.
Monitoring is no longer a useful strategy for IT Operations due to the introduction of public and private clouds, the adoption of DevOps, the rise of new technologies, the vast quantity of data caused by digital transformation, the proliferation of mobile devices, and IoT.
#2 What is Observability?
R. Kalman introduced the concept of observability in the study of control systems in 1960. According to the theory of control systems, observability measures how well internal system states can be deduced from knowledge about their external outputs.
It basically involves learning from what you already know about what you don't know. Mathematical representations are possible for the relationship between the known and the unknown.
Therefore, the internal, unknown state of the system can be deduced given sufficient known, external data and time to perform the mathematical calculations. Given that distributed infrastructure components function across numerous abstraction layers, this strategy is perfectly suited for modern Enterprise IT.
The volume, variety, and velocity of external data and the lack of computational capacity and domain expertise required to evaluate and make sense of it in real-time have made it difficult to integrate observability in IT.
IT operations teams need observability platforms to be effective. These platforms must be able to consume massive amounts of data from many different sources and submit that data for quick, intensive computational analysis.
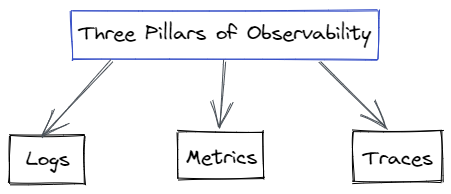
Three Pillars of Observability
Metrics, logs, and traces are typically described as the three pillars of observability.
- Logs
Logs are textual records that provide pertinent data for all of the application's occurrences. Binary, structured, and plain text are the three available formats. Logs are separate, unchangeable, and include information that is time-stamped to enable SREs to comprehend the context. Additional metadata is kept in structured logs, allowing for a thorough investigation of each problem. However, storing logs can be an expensive endeavor. - Metrics
Metrics are quantitative values that are typically measured over time to evaluate the effectiveness of different system components including infrastructure, cloud platforms, services, etc. They are used to keep track of a variety of characteristics, including memory utilization, CPU capacity, latency rates, etc. - Traces
Traces help in tracking the progress of a single transaction request through the application. Since it frequently aids in placing things in context, it is a crucial component of observable systems. Traces enable you to examine a single transaction's data stream to identify the issue's root cause and resolve it rather than having to look at numerous data streams.
#3 Observability vs Monitoring: Key Similarities and Differences
Although observability and monitoring have essentially the same objectives, there are several key differences between the two. Let's look at how they differ and how they are similar.
Similarities between Observability and Monitoring
i.) Fix Issues
By locating and resolving problems, observability and monitoring both contribute to the system's continued functionality and dependability.
ii.) Rely on Data
Both use data to identify the problem, which is another characteristic they share. A deeper exploration of both of these locations reveals differences.
iii.) Demand a Deeper Understanding
Furthermore, whether you try to implement monitoring or observability, a comprehensive understanding of the system is required. Particularly in the case of monitoring because, in contrast to observability, it does not assist you in establishing connections between various system occurrences.
Differences between Observability and Monitoring
i.) Predetermined vs Unknown
The types of data that are gathered by observability and monitoring differ significantly on several levels. When it comes to monitoring, you work using dashboards where the team monitors metrics they deem important. But what if a problem arises that isn't being tracked by the dashboard?
Data from the entire system is gathered by Observability, which then zeroes in on the problem. Therefore, if something goes wrong, it will correlate data from across the board to identify the underlying cause.
ii.) Reactive vs Preemptive
Monitoring focuses on particular system outputs and only alerts you when the values go outside of permissible bounds. After receiving these signals, SREs investigate the issue.
With observability, you can run into problems right away instead of having to wait for the system to break. Observability enables you to take preventative action via system-wide data collection.
Additionally, SREs can begin to function even when a negative trend emerges. Observability gives you the ability to make connections and deal with the underlying problem to stop undesirable events.
iii.) Plain Data vs Actionable Insight
With monitoring, you obtain simple data that indicates if an issue exists or not. You are left with nothing else to help you solve or even recognize the problems. Simple data seldom helps SREs in the case of huge and complicated systems.
For observability, you gather information other than numerical data. For instance, you can leverage data from different pertinent sources, such as the node, Kubernetes services, hypervisor, pods, etc., if a node breaks in your observable system.
When you have visibility into the pertinent data pool, you can determine what caused the problem. You, therefore, understand exactly what needs to be fixed to resolve the condition.
#4 Observability vs Monitoring: Use Cases
The extent of coverage is the key difference between observability and monitoring use cases. While monitoring frequently concentrates on a single feature, observability offers complete visibility across the relevant region.
Let's quickly review the many use cases for monitoring and observability.
Use Cases of Observability
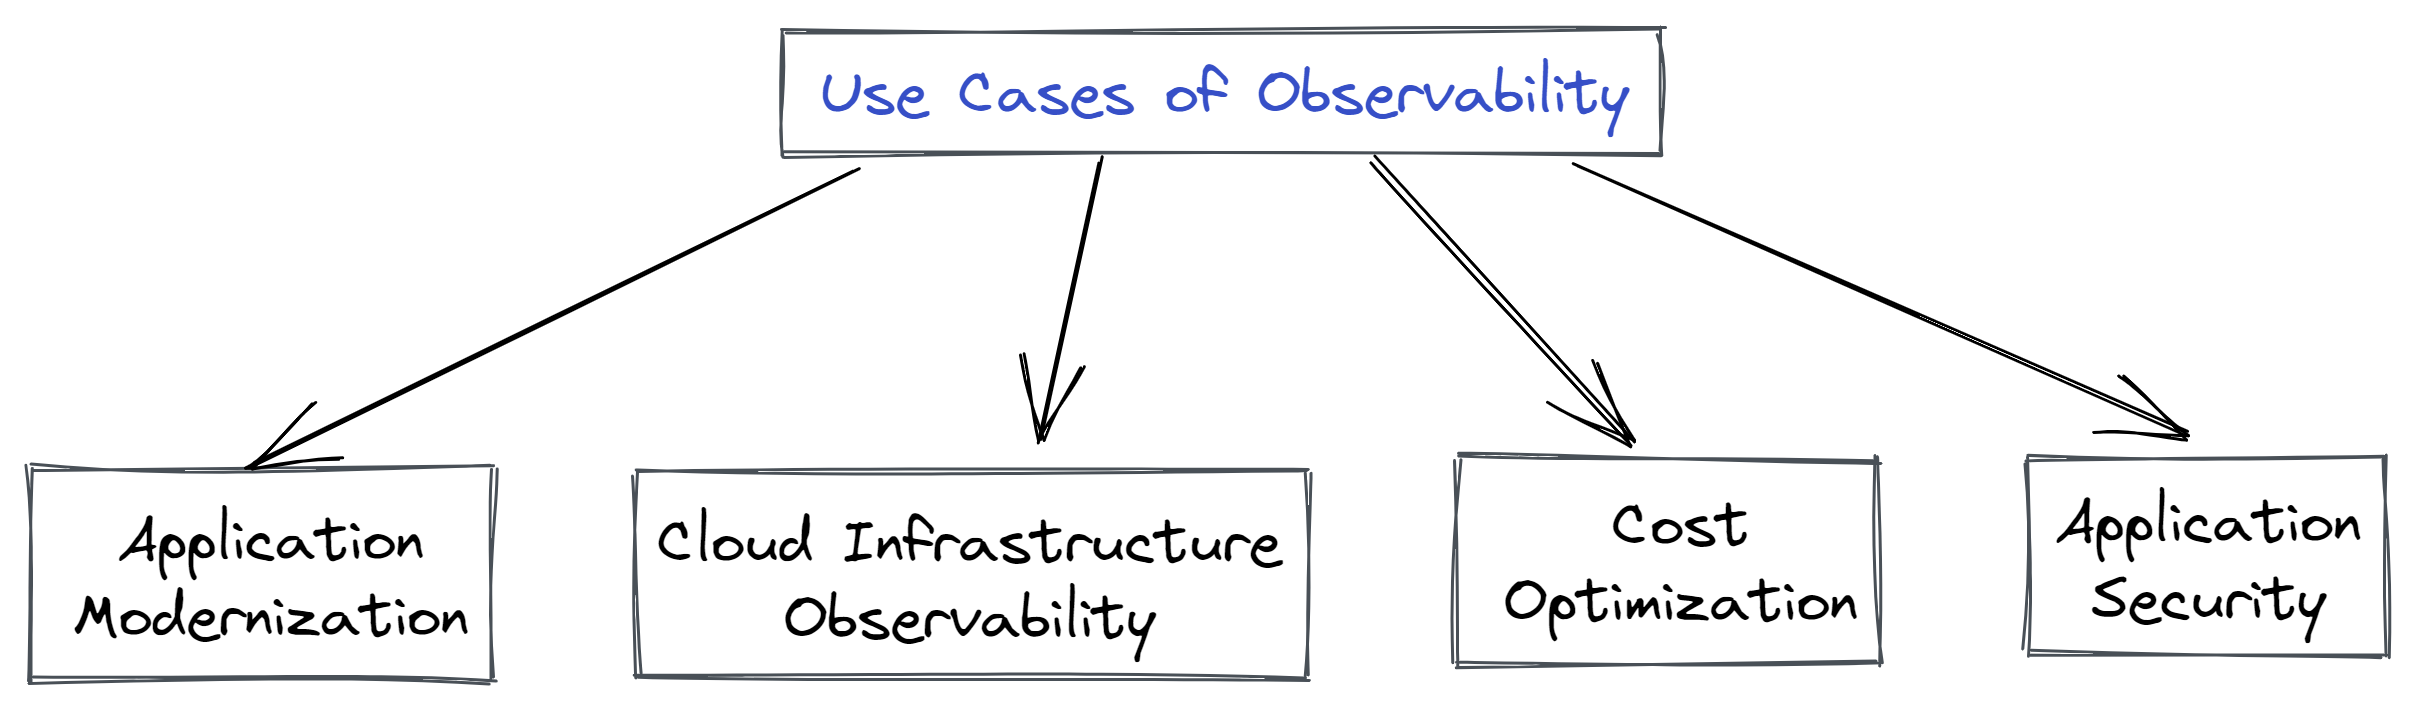
- Application Modernization
To keep up with modern demands, businesses have quickly evolved their technological infrastructure. This covers the utilization of microservices, cloud infrastructure, SaaS delivery strategies, etc. Modern apps are very well matched to user demands, but managing them has gotten more and more challenging. Particularly with specialized tools devoted to different subjects. By offering a unified system and dashboard to manage the entire infrastructure, Observability solves this issue. As a result, you can find problems fast and fix them. - Cloud Infrastructure Observability
Cloud-native technologies are now commonly used. There is always so much going on; one unfortunate side effect is frequently the emergence of undesirable operational silos. Teams frequently fail to comprehend how performance anomalies later translate into a poor user experience in their efforts to manage these operational silos. Observability, which is a single source of insights to enhance user experiences, aids in coordinating efforts from diverse teams in cloud infrastructure. - Cost Optimization
The revenue is impacted by numerous things. Overprovisioning of resources, a delay in determining the core reason, and damage to a brand's reputation as a result of negative user experiences are a few contributing issues. Your application and IT infrastructure can be fully observed to deliver accurate and timely information. You can use it to stop over-purchasing and plug up all the places where money is leaking. It can also be used to create synergy between the infrastructure and application teams so that they are both working toward the same objective. - Application Security
Cybercrimes are a constant threat to modern enterprises. especially because manually maintaining the intricate cloud infrastructures is practically difficult. Observability, however, can significantly increase the security of your application. It can identify problems and fix them on its own. Even better, it can find numerous potential security holes for you and close them.
Use Cases of Monitoring
Monitoring is used to address certain components of the application and infrastructure, while observability handles more general business problems. Let's take a quick look at some of the use cases for monitoring.
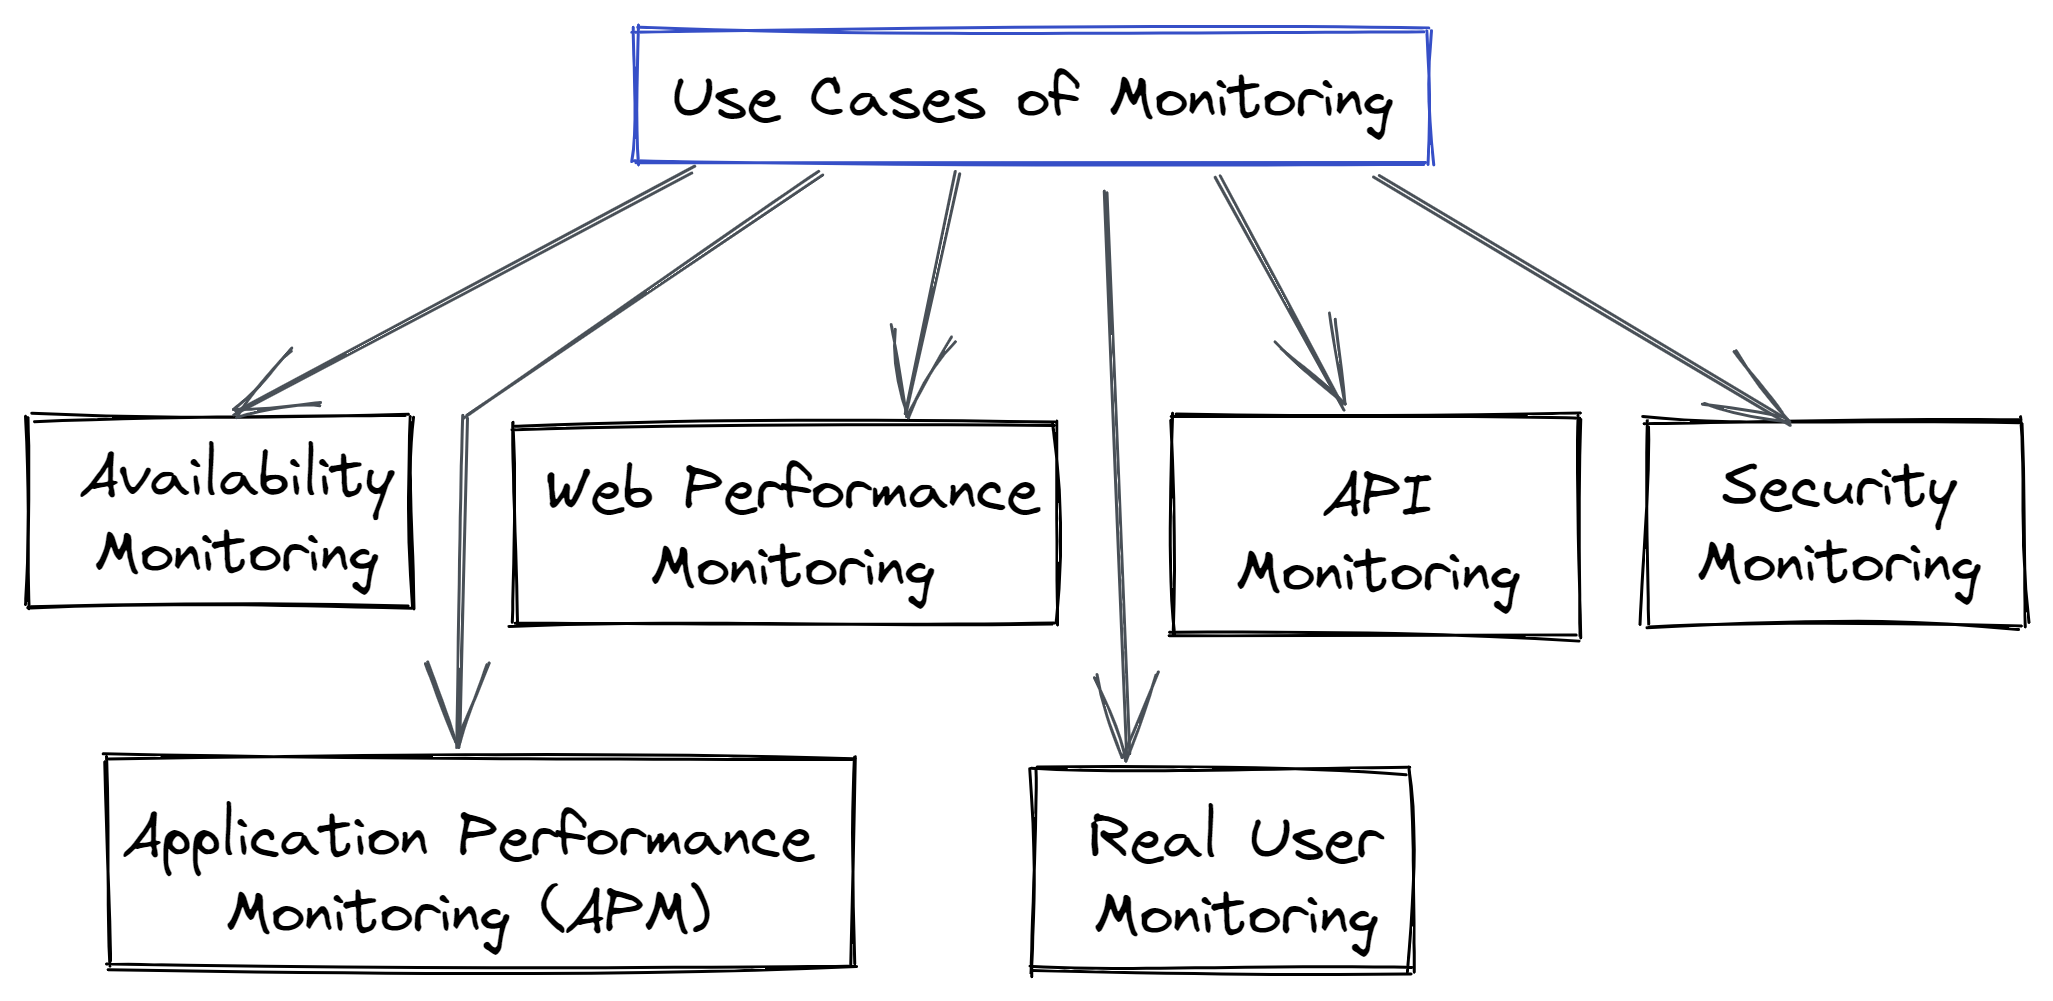
- Availability Monitoring
System failure is the worst possible situation. Monitoring availability helps to reduce site downtime and its negative impacts. It keeps track of infrastructure components including servers' availability and alerts the webmaster if something goes wrong. - Web Performance Monitoring
It keeps track of the web service's accessibility as well as other precise criteria. This category includes factors like page load times, knowledge transmission errors, loading errors, etc. that are tracked. - Application Performance Monitoring (APM)
APM is mostly used for commercial applications, the internet, and mobile apps, and it concentrates on performance factors that affect user experiences. It also covers the application's dependencies and supporting infrastructure. - API Monitoring
Given that the majority of modern applications use APIs, it is crucial to guarantee that API resources are accessible, usable, and responsive. To ensure uninterrupted operations, API monitoring collects all relevant metrics for API. - Real User Monitoring
In contrast to controlled surroundings, real-world scenarios might cause applications to behave differently. If the app functions the same way in both contexts, real user monitoring captures data on user interactions and keeps you informed. It contains information about things like HTTP requests, application crashes, and page load events. - Security Monitoring
Any stakeholder who uses the application will have a very miserable day at work if it is exposed to a security threat. Any security error can result in the demise of your application, whether it's caused by old hardware, careless users, malware, or outside service providers. To spot and notify about any anomaly, security monitoring keeps an eye on the flow of information and events.
#5 Monitoring vs Observability: Which is More Important?
In the end, observability and monitoring are equally important for managing microservice-based applications. While monitoring keeps track of your application's system health, observability explains why it behaves the way it does. The notion that monitoring is merely a subset of observability or a component of the process could be made.
The problem with starting with monitoring alone is that you won't be able to collect the data required for contextualized analysis without observability. With the help of observability, DevOps professionals can comprehend the underlying reason for an error and how it is harming your system. Due to solutions like Atatus, you can make sense of your multi-cloud environment by gathering and analyzing this data.
#6 Observability and Monitoring: Which is Better?
How can you then determine which model to apply to each environment?
Typically, monitoring offers a condensed picture of the system data that is centered on specific metrics. When system failure modes are well understood, this strategy is enough.
Monitoring indicates system performance because it concentrates on important metrics like utilization rates and throughput.
For example, you might want to keep track of any latency when writing data to the disk or the typical query response time when monitoring a database. Database administrators with experience can recognize patterns that may indicate recurring issues.
Examples include a rise in CPU usage, a decline in the cache hit ratio, or a surge in memory usage. These problems can be a sign of a badly worded query that needs to be stopped and looked at.
However, when compared to troubleshooting microservice systems with several components and a variety of dependencies, conventional database performance analysis is simple.
Understanding system failure modes are useful for monitoring, but as applications become more complicated, so do their failure modes. Often, the way that distributed applications will fail cannot be predicted.
Making a system observable allows you to comprehend its internal state and, from there, identify what is malfunctioning and why.
However, in contemporary applications, correlations between a few metrics are frequently insufficient to diagnose events. Instead, these contemporary, complicated applications demand a greater level of system state visibility, which you can achieve by combining observability with more potent monitoring tools.
Conclusion
There is more to observability and monitoring than just checking boxes. Even with the most observable systems, it can be challenging to monitor issues. There are a lot of potential causes for the application to crash.
To keep the issues at bay, you must maintain eternal supervision. Only observability can make that easier. A talented group of engineers with a thorough understanding of the system's operation is another essential component for healthy systems.
The key fact is that observability and monitoring are not incompatible. There is no requirement that a company uses either one or the other. In reality, a company that wants to gain the best understanding of its IT systems may use both. In the same way, a company may discover that for some workloads, observability is a superior solution while for others, monitoring is.
Monitor Your Entire Application with Atatus
Atatus is a Full Stack Observability Platform that lets you review problems as if they happened in your application. Instead of guessing why errors happen or asking users for screenshots and log dumps, Atatus lets you replay the session to quickly understand what went wrong.
We offer Application Performance Monitoring, Real User Monitoring, Server Monitoring, Logs Monitoring, Synthetic Monitoring, Uptime Monitoring, and API Analytics. It works perfectly with any application, regardless of framework, and has plugins.

Atatus can be beneficial to your business, which provides a comprehensive view of your application, including how it works, where performance bottlenecks exist, which users are most impacted, and which errors break your code for your frontend, backend, and infrastructure.
If you are not yet an Atatus customer, you can sign up for a 14-day free trial.
#1 Solution for Logs, Traces & Metrics
![]() APM
APM
![]() Kubernetes
Kubernetes
![]() Logs
Logs
![]() Synthetics
Synthetics
![]() RUM
RUM
![]() Serverless
Serverless
![]() Security
Security
![]() More
More