Request Context Loss
CakePHP requests traverse controllers, components, ORM calls, and views. When issues surface in production, the original request context is no longer clear.
Get end-to-end visibility into your CakePHP performance with application monitoring tools. Gain insightful metrics on performance bottlenecks with PHP monitoring to optimize your application.
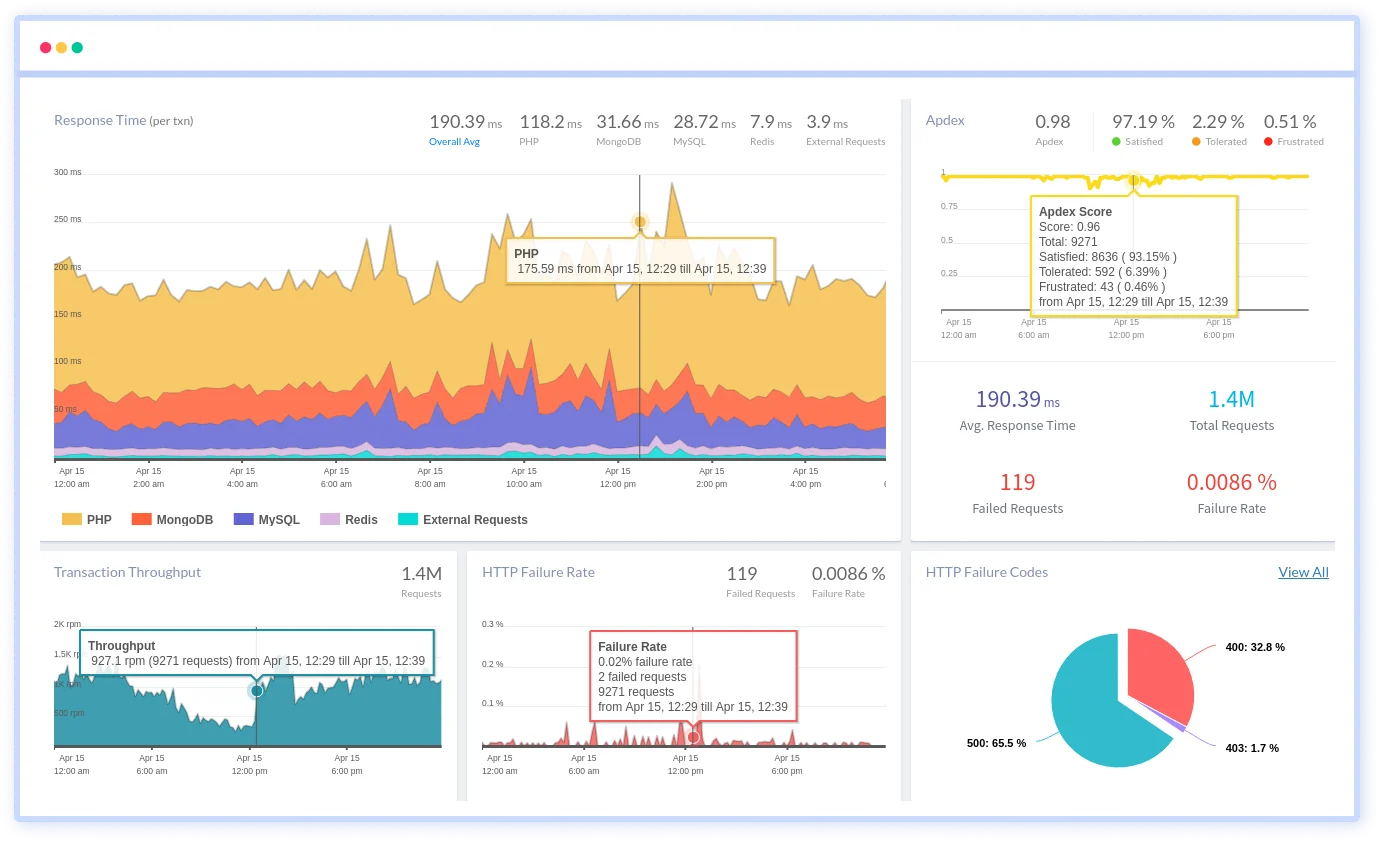
CakePHP requests traverse controllers, components, ORM calls, and views. When issues surface in production, the original request context is no longer clear.
Components, behaviors, and helpers execute implicitly. In production, teams cannot easily see what actually ran during a specific request.
Queries are generated dynamically through associations and behaviors. Slow responses appear without obvious linkage to the queries executed.
Before and after callbacks alter execution order. Failures occur without clarity on which callback affected the request state.
View and layout rendering happens at the end of execution. Performance issues appear late, masking where the request slowed down.
Real data shape and traffic patterns differ from staging. Issues emerge only under live production execution.
Exceptions are recorded after execution has already shifted. Teams lack visibility into what the request was doing when it failed.
The same endpoint behaves differently under load. Variability increases without a clear explanation.
Real-time observability for CakePHP that helps teams understand request behavior, optimize performance, and resolve production issues faster.
See exactly where time is spent across controllers, services, and database operations for every request. Quickly identify slow execution paths affecting response times.
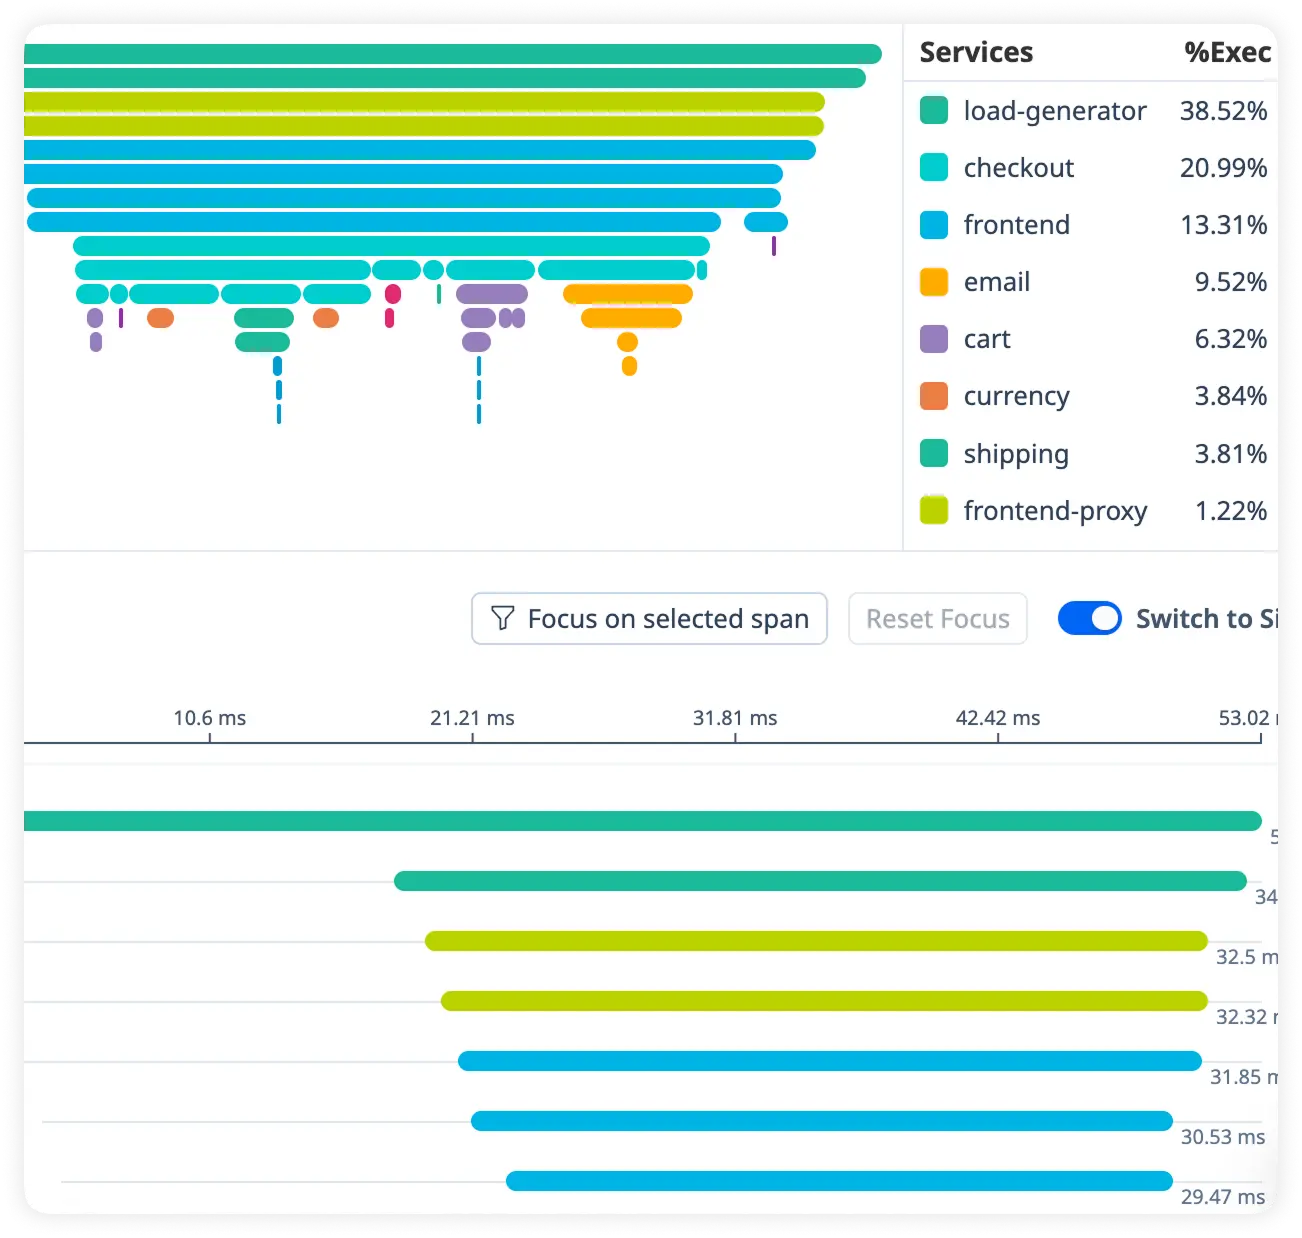
Monitor database query performance and resource usage in real time. Eliminate inefficient queries that slow application behavior.
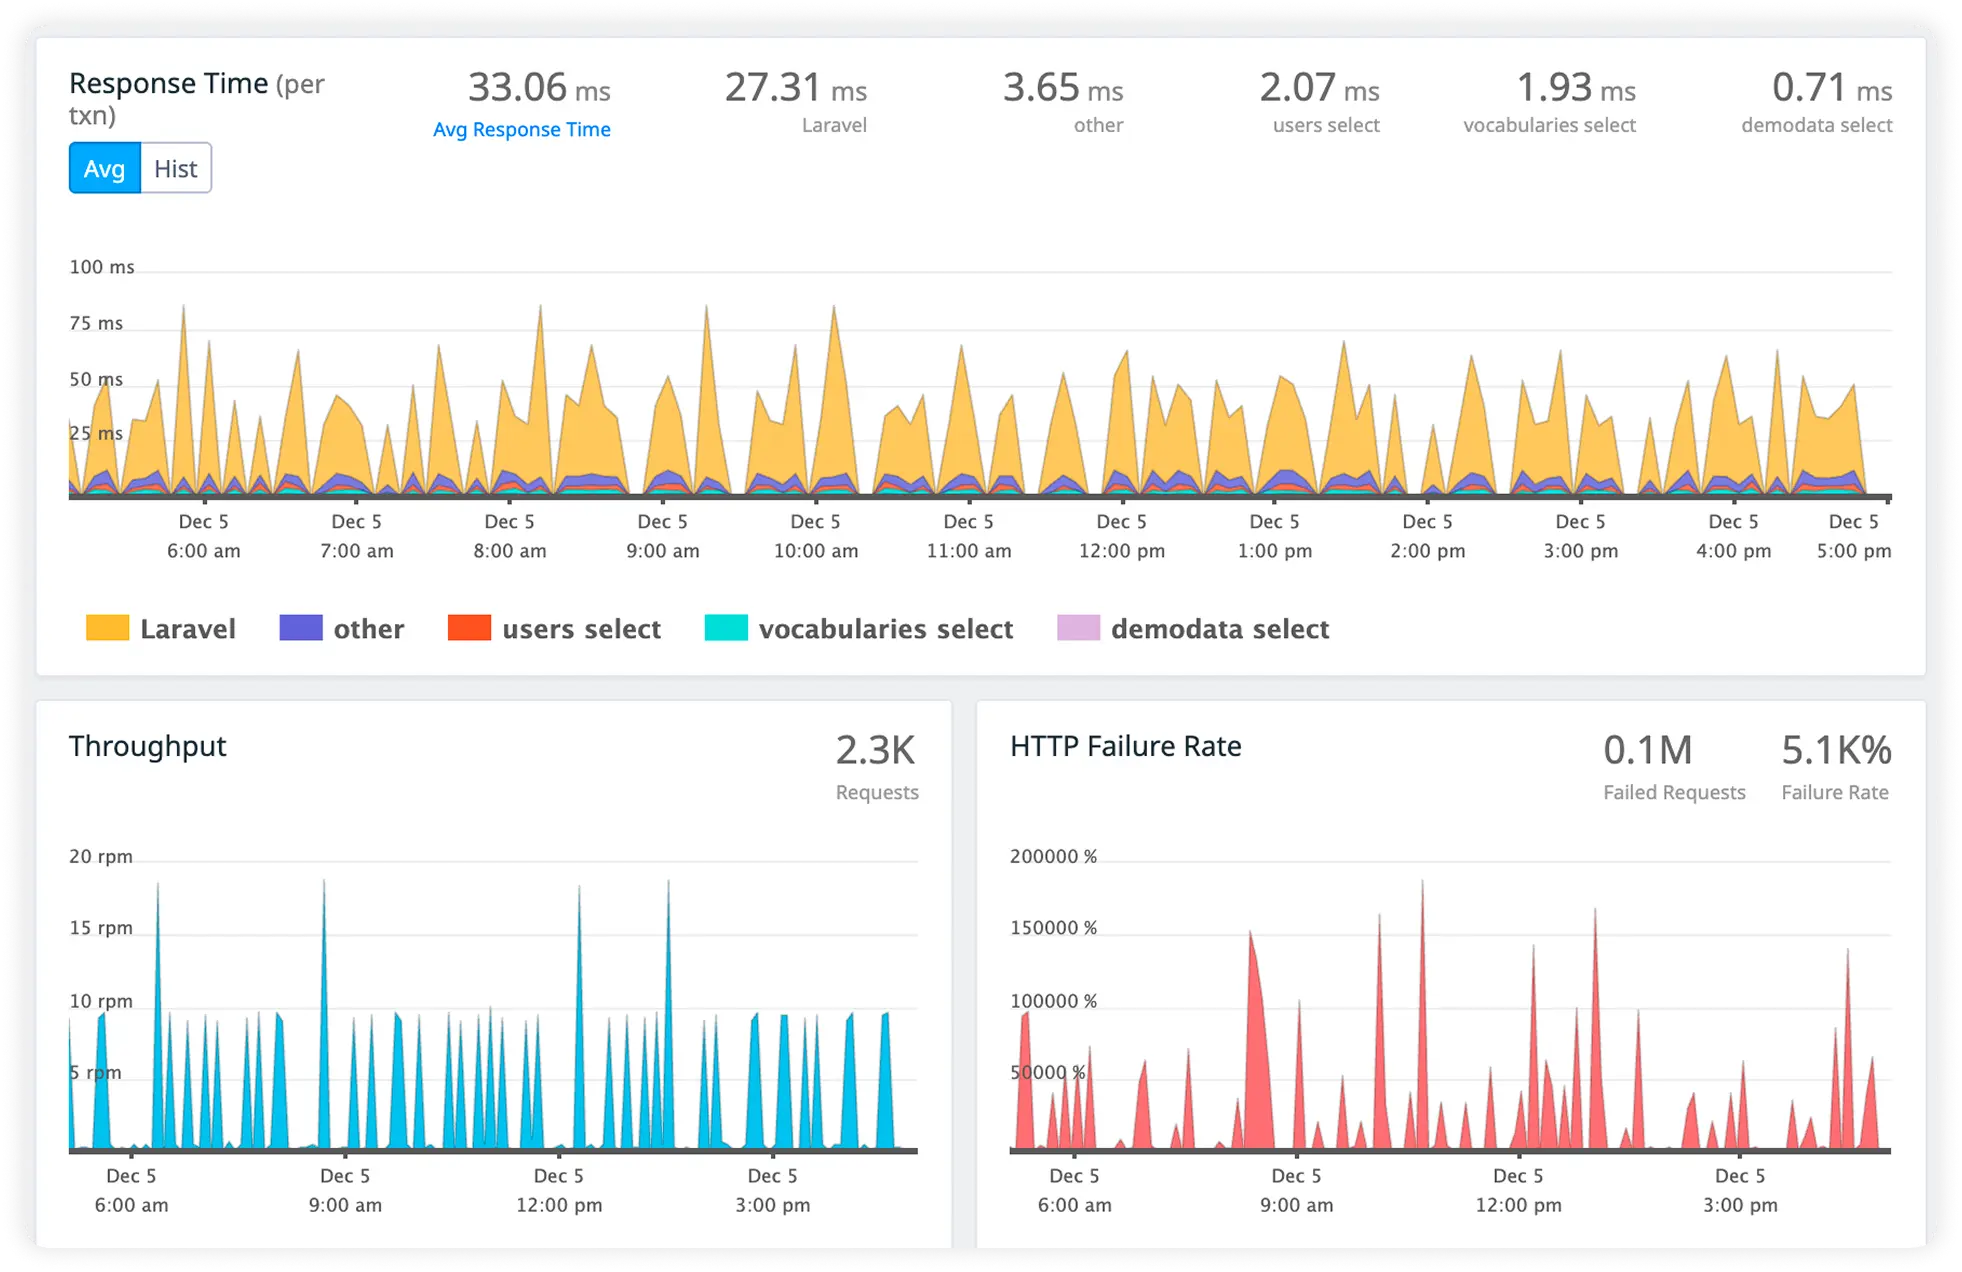
Measure response times for third-party APIs and external services your CakePHP apps rely on. Detect slowdowns and failures before they impact users.
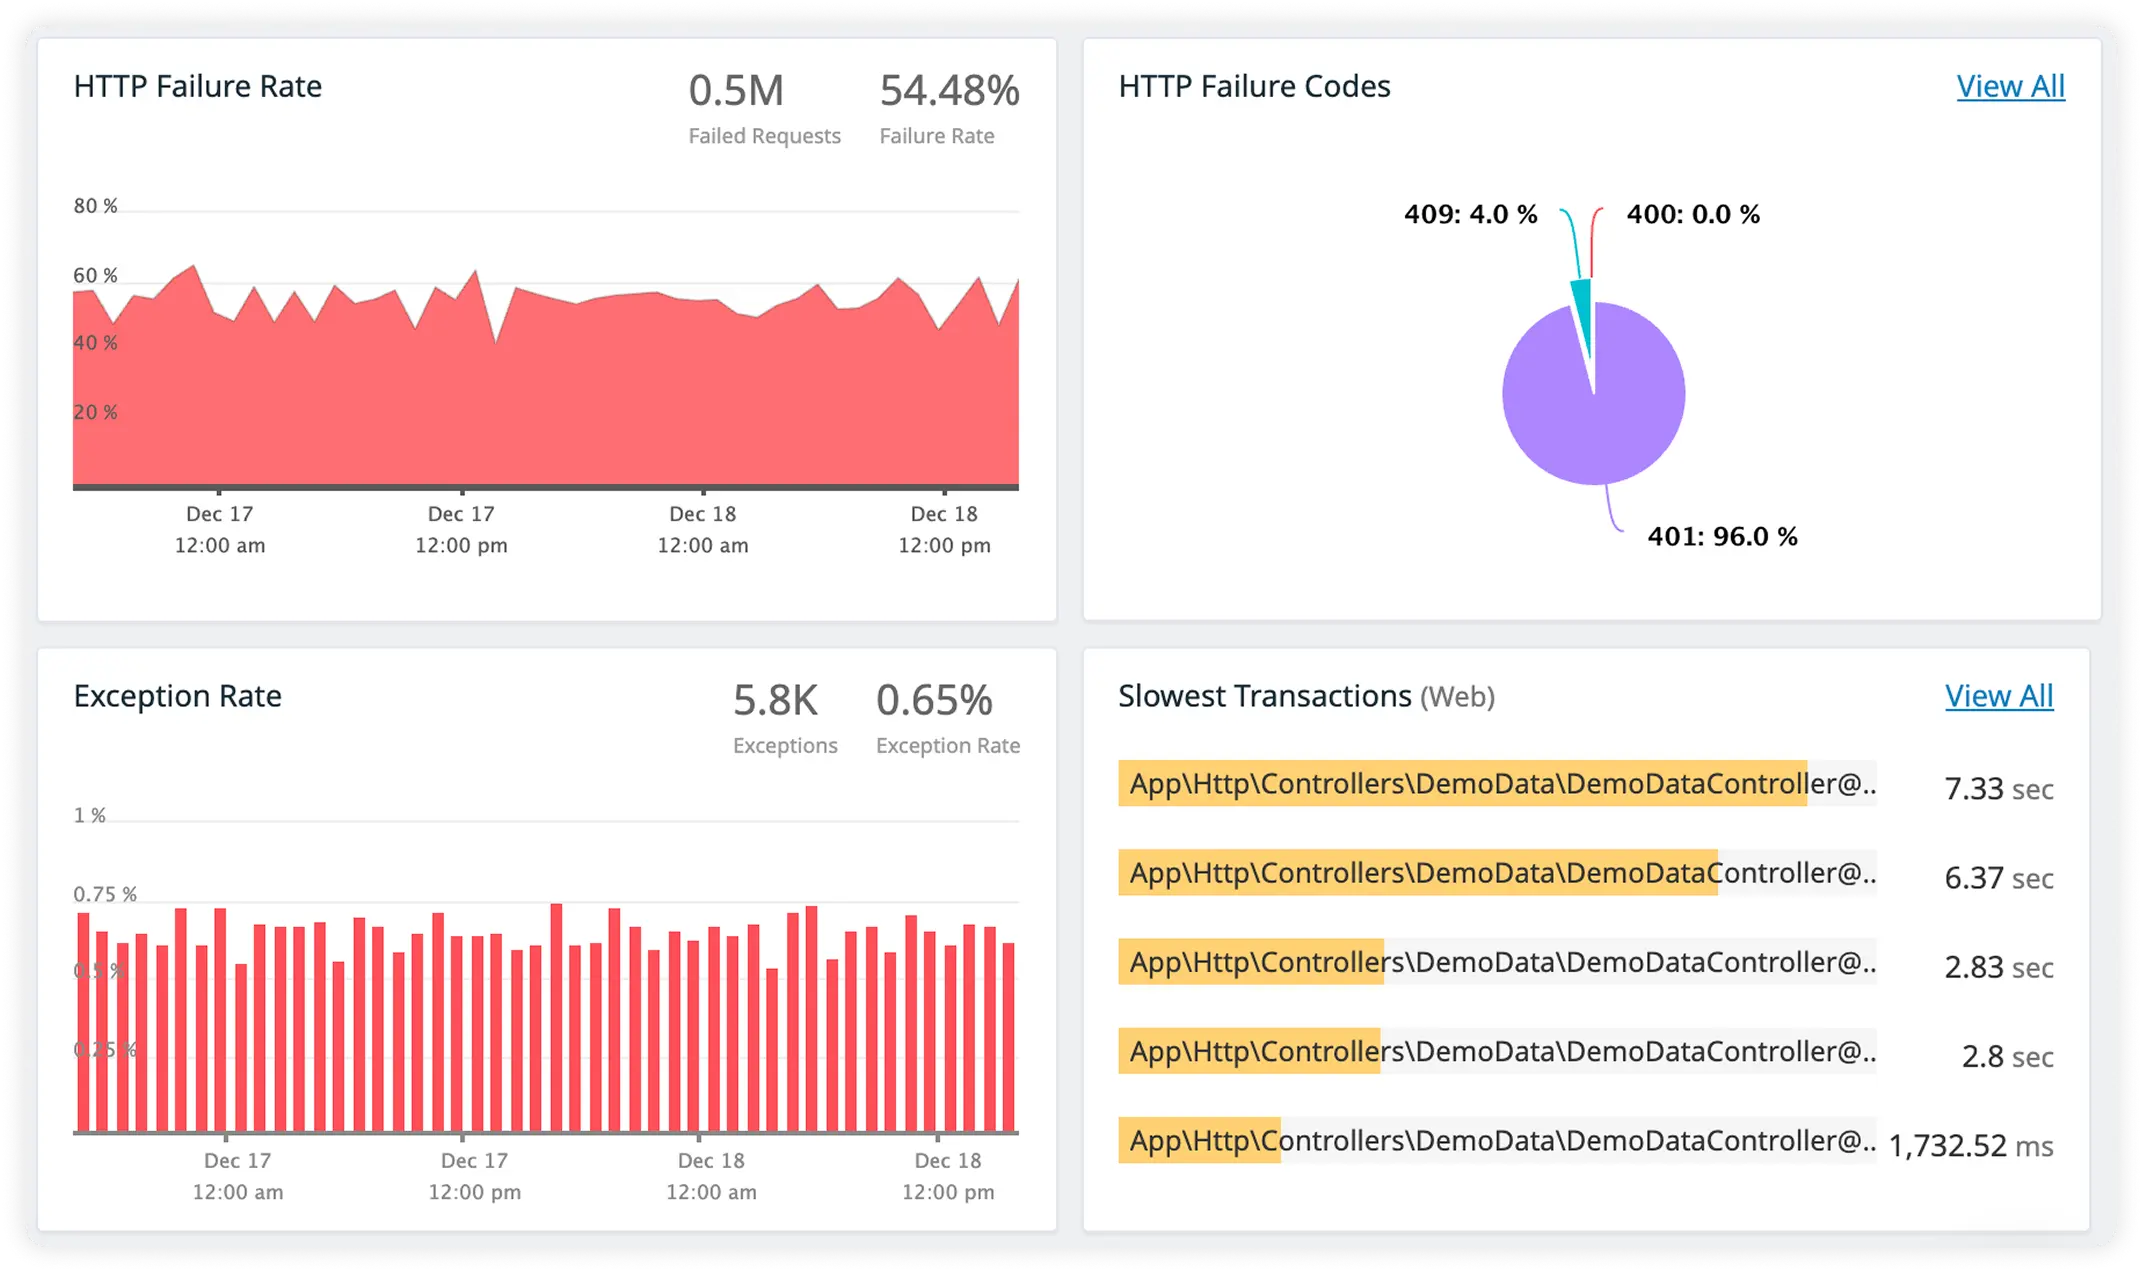
Capture detailed error information alongside correlated logs for every request. Debug faster with complete visibility across traces, logs, and performance data.
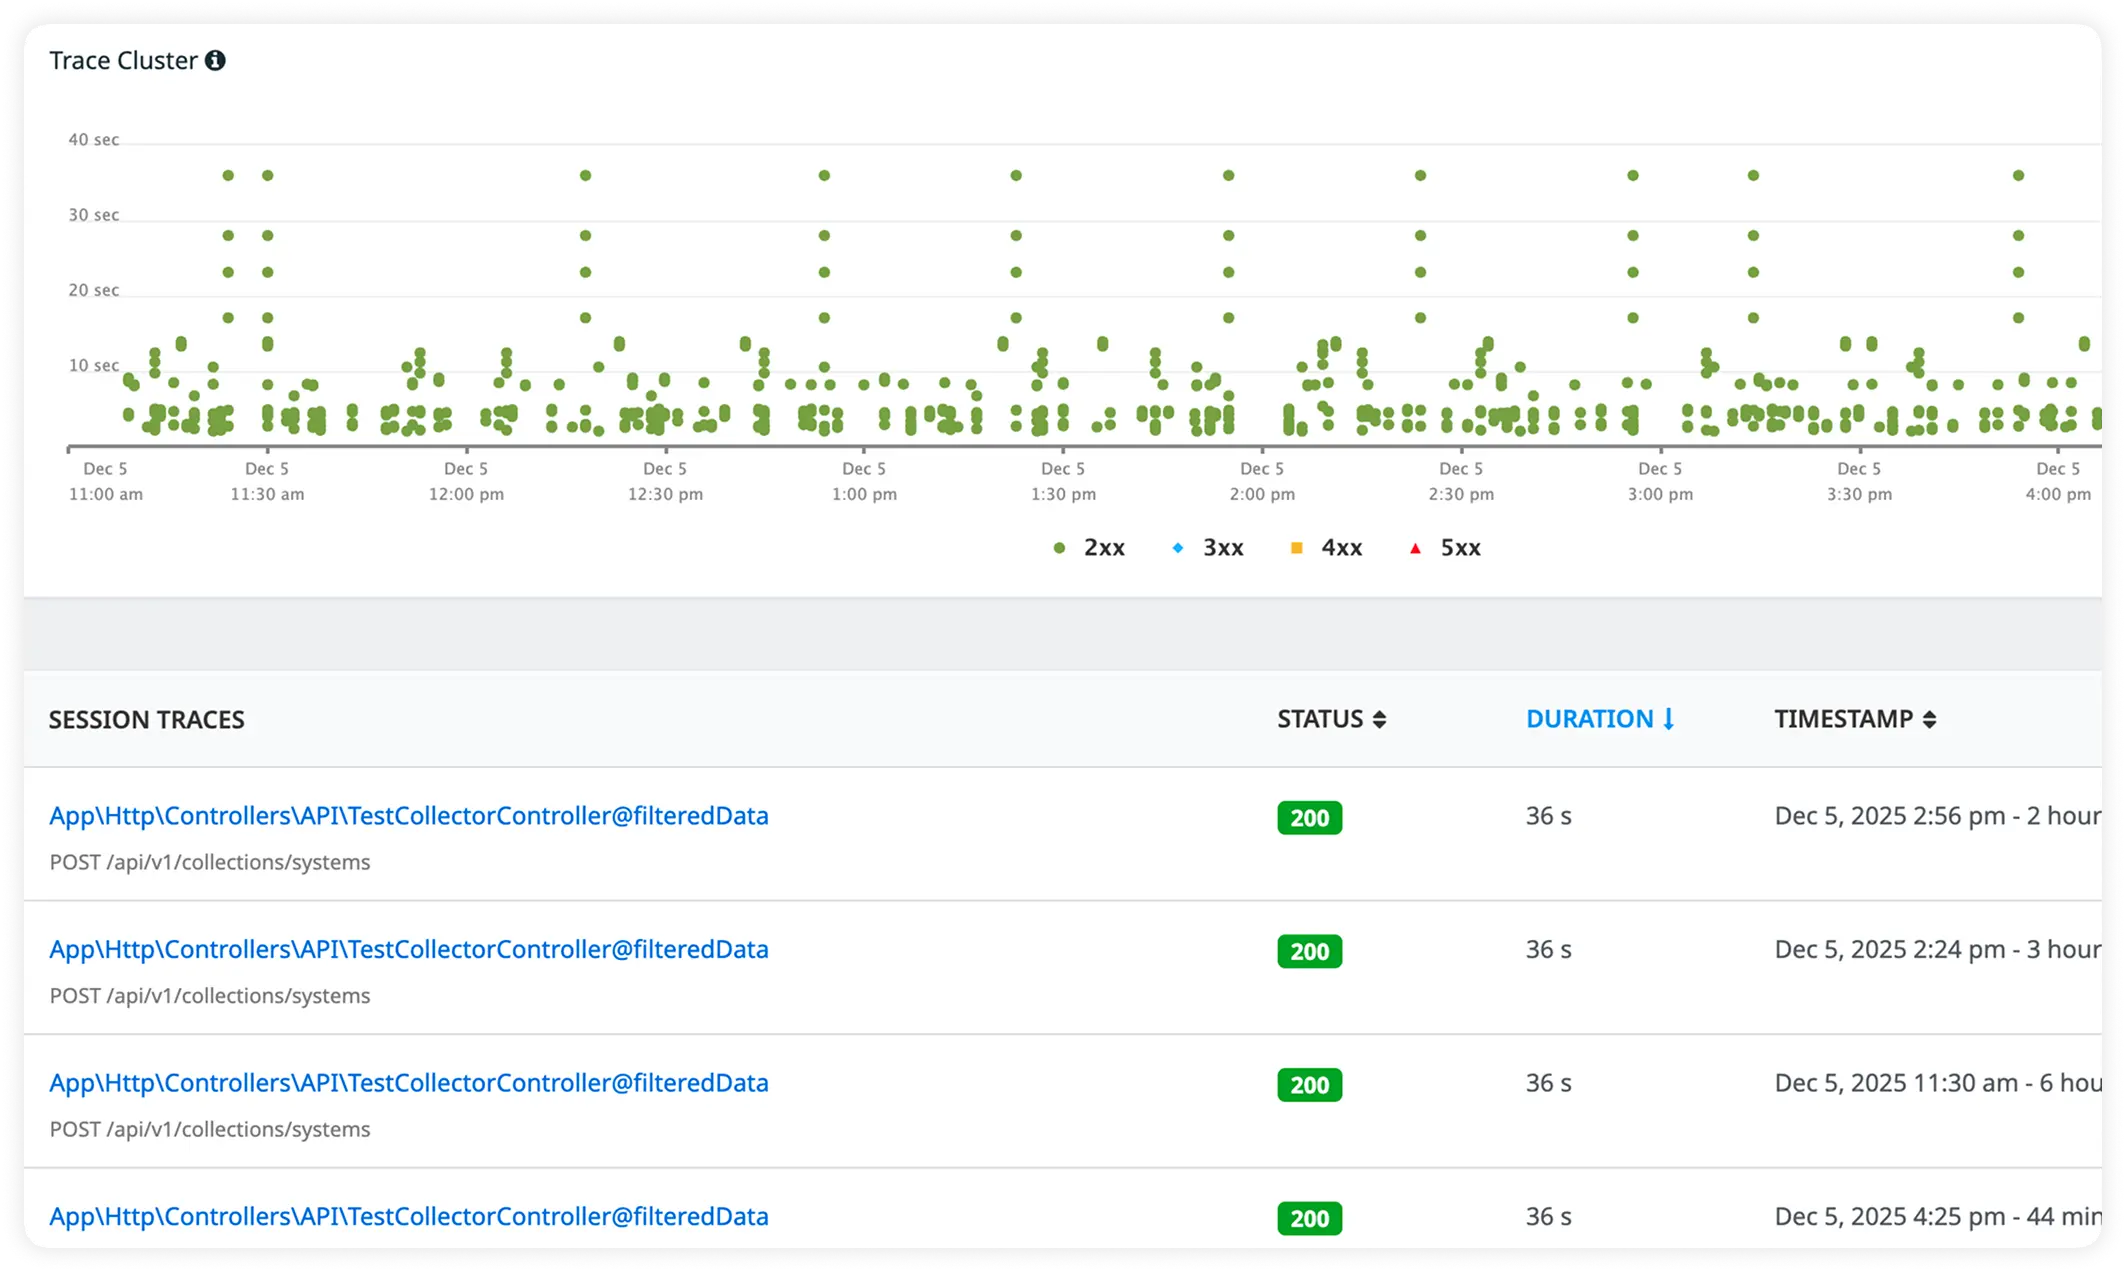
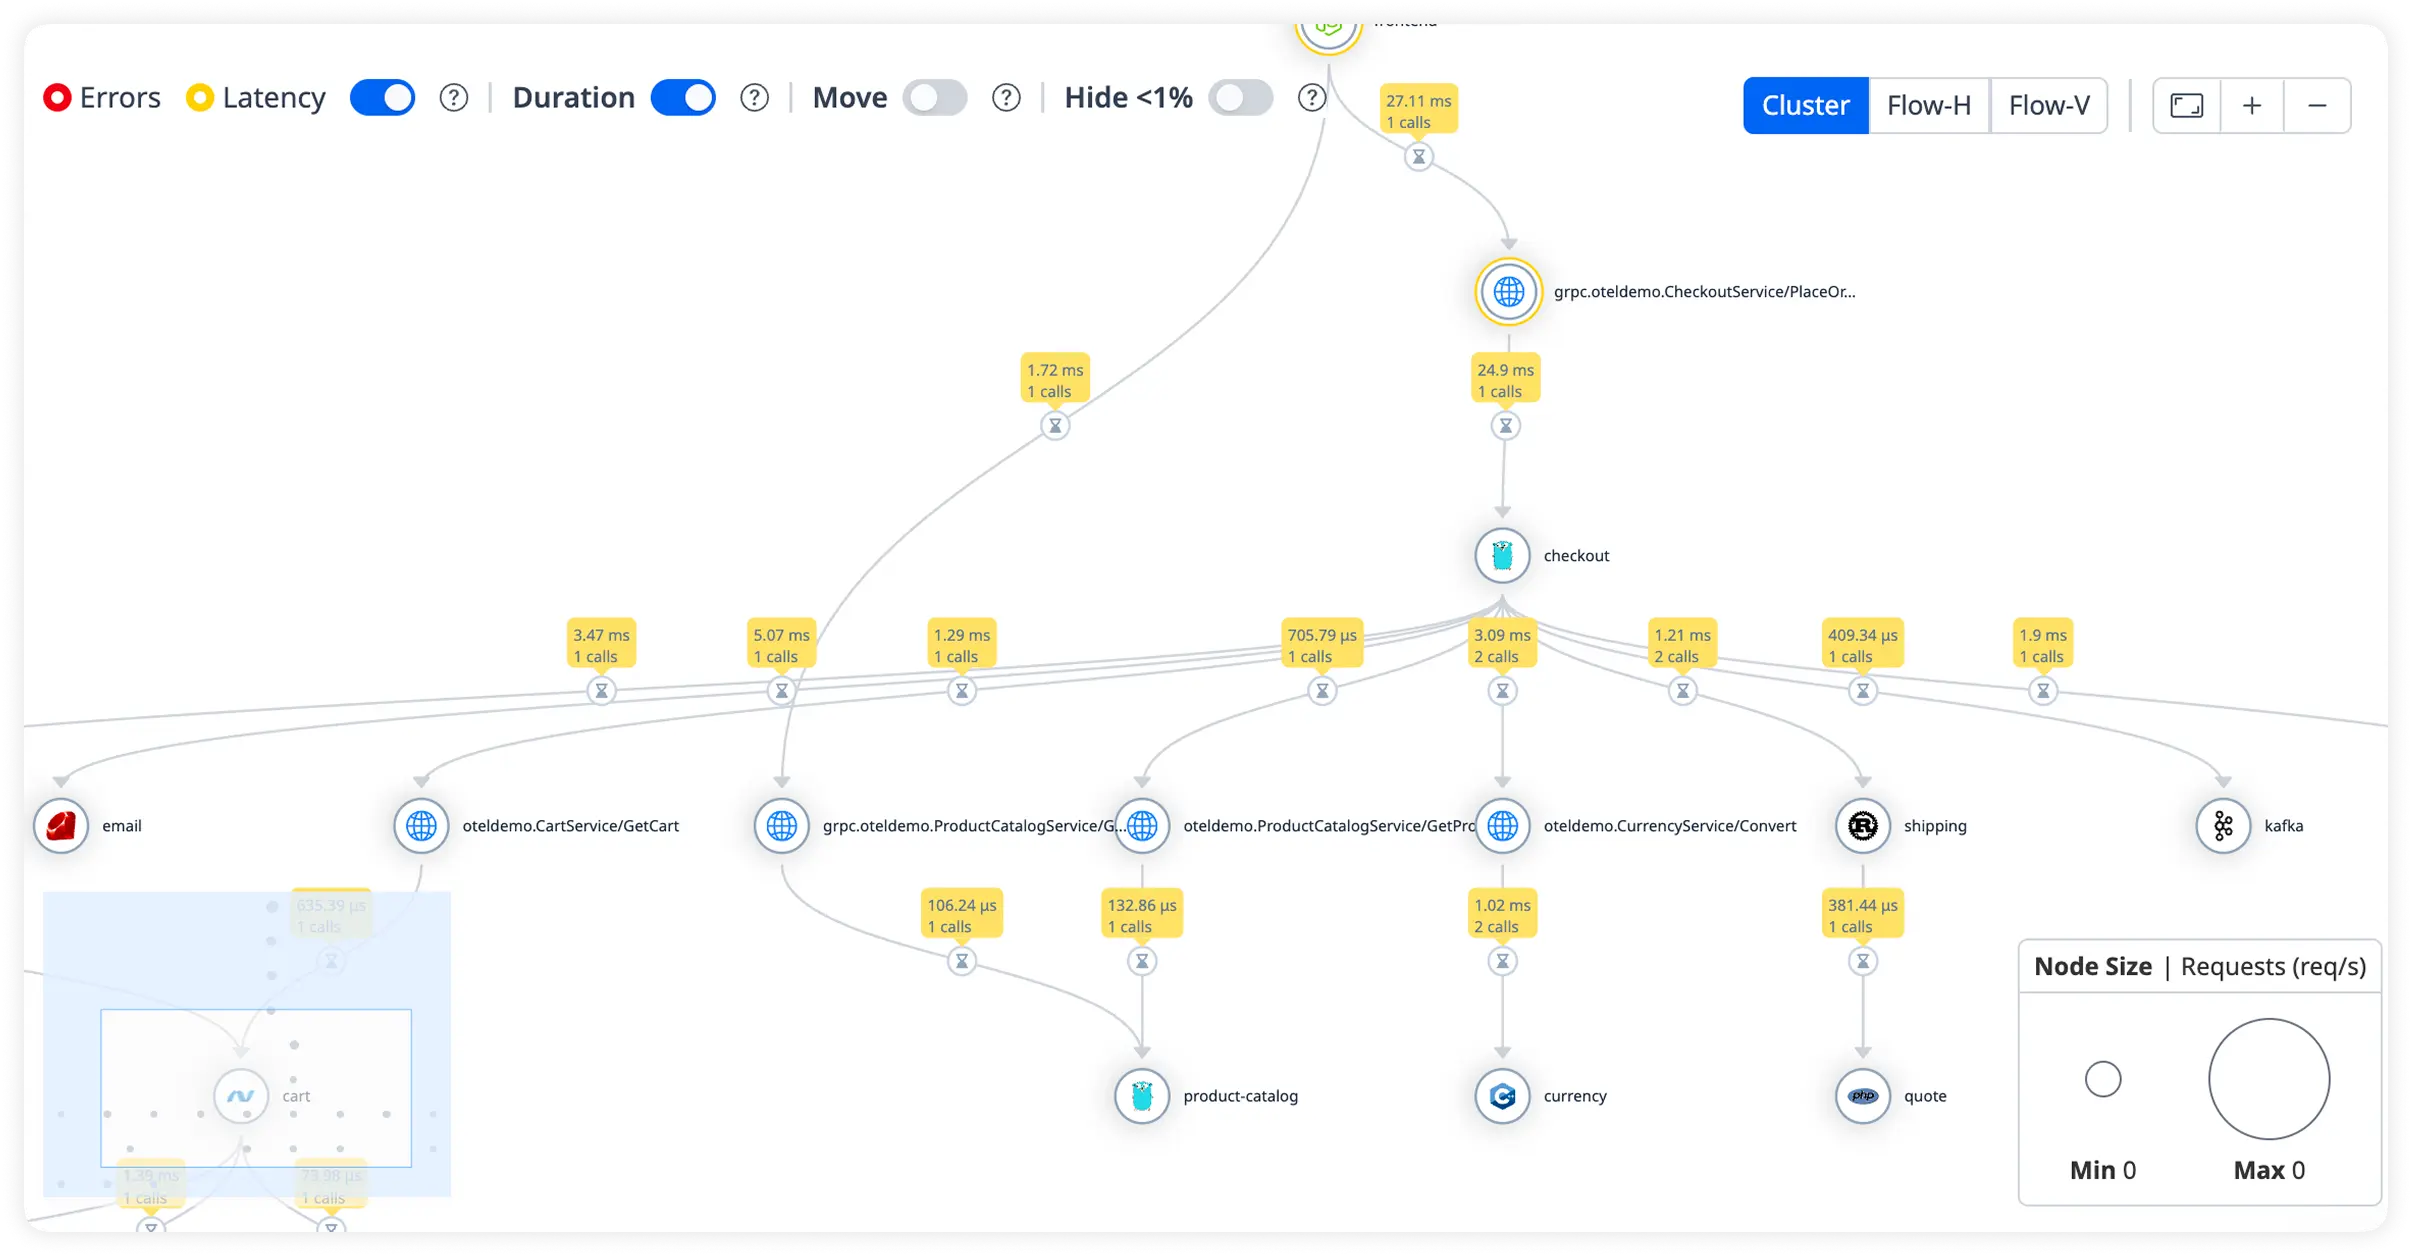
CakePHP teams choose Atatus to examine real production requests exactly as they executed, without relying on assumptions or reconstructed timelines.
Teams inspect individual production requests that experienced latency or errors. This allows engineers to focus on what actually happened in a specific execution rather than guessing from aggregated data.
Debugging is grounded in runtime behavior captured during live traffic. Engineers rely on what the application executed in production, not on expected control flow or local test assumptions.
Execution data is collected under real user load, real datasets, and real concurrency conditions. This exposes issues that never appear in staging or synthetic testing.
Analysis stays grounded in real traffic patterns, real data, and real execution conditions that cannot be reproduced reliably outside production.
Errors are reviewed with the execution state present at the moment the failure occurred. This helps teams understand what the request was doing when it broke, not just where it failed.
Engineers compare failing requests with successful ones using observed execution behavior. Differences are identified based on real production evidence, not code inspection alone.
When the same issue occurs multiple times, teams can review similar request executions consistently. This avoids fragile attempts to recreate production conditions locally.
Teams gain production visibility without changing how CakePHP applications are structured or deployed. Existing controllers, models, and views remain untouched.
Release, rollback, and mitigation decisions are made using observed production execution. Actions are based on evidence from live requests, not intuition or incomplete information.
Atatus adapts to how engineering teams work across development, operations, and reliability.
Debug errors and slow paths with the full context of what happened.
Atatus for developersTrack deployments and see how each release affects stability.
Atatus for DevOpsWatch latency and error rates to ship with less production risk.
Atatus for release engineersPricing, deployment, data and the agent. If something is missing, a person will answer it on a demo call.
The CakePHP performance monitoring tool helps developers to optimize the CakePHP server performance.
A good CakePHP APM solution answers the following two questions:
You can easily use application performance monitoring tools to answer, detect and resolve the above issues before they could impact the end users.
In general, there are two types of monitoring:
Every organization should have a well-implemented CakePHP APM solution, which allows DevOps teams (and the organization as a whole) to resolve issues and performance bottlenecks efficiently and reduce Mean Time To Resolution (MTTR). This has a substantial impact on the bottom line of the business.
Now organizations do not have to deal with the unnecessary work involved in maintaining an extensive software analysis group.
Your CakePHP performance monitoring tools should be easy to use, offer actionable insights, and be able to:
Technical Benefits:
Business Benefits:
With the help of the database monitoring, you can easily identify the database performance bottlenecks.


