Analyze access log traffic
Inspect Apache access logs to understand request patterns, response codes, request latency, and client behavior.
Track access activity, server behavior, performance signals, and security events across Apache web server environments in real time.
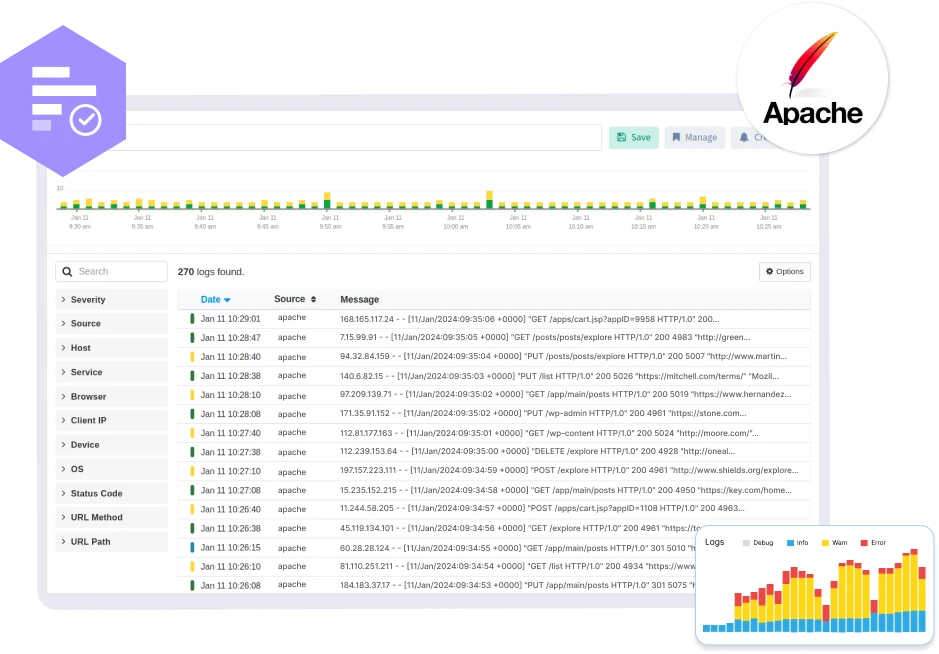
Inspect Apache access logs to understand request patterns, response codes, request latency, and client behavior.
Capture Apache error log entries related to module failures, worker crashes, and runtime warnings.
Monitor Apache logs generated during startup and reloads to identify syntax errors and invalid directives.
Analyze Apache log messages related to MaxRequestWorkers, process exhaustion, and request queuing.
Capture Apache SSL logs to identify certificate errors, handshake failures, and protocol mismatches.
Inspect logs generated by mod_proxy and mod_rewrite to troubleshoot routing and request rewriting issues.
Analyze Apache logs to identify abnormal traffic patterns, malformed requests, and abusive clients.
Link Apache log entries with backend service logs to trace request failures across the stack.
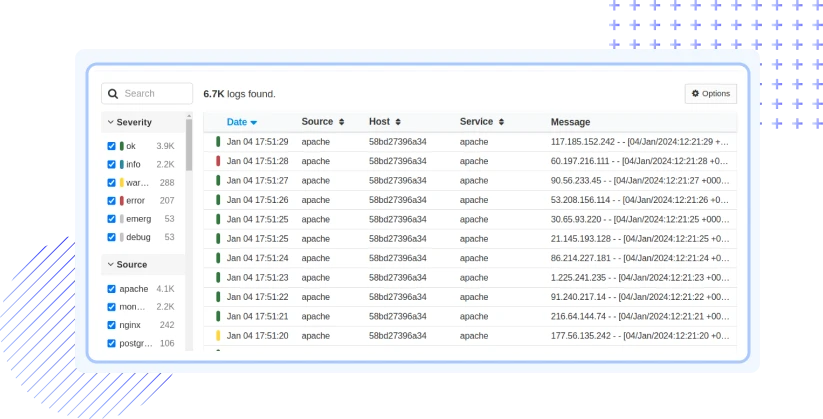
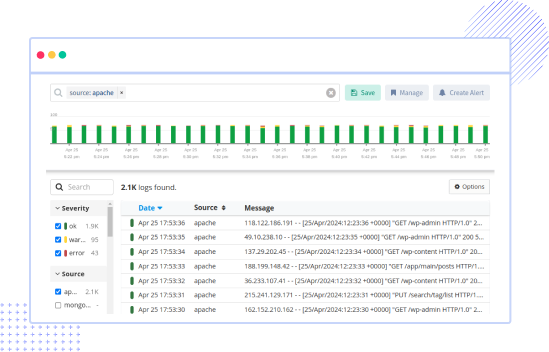
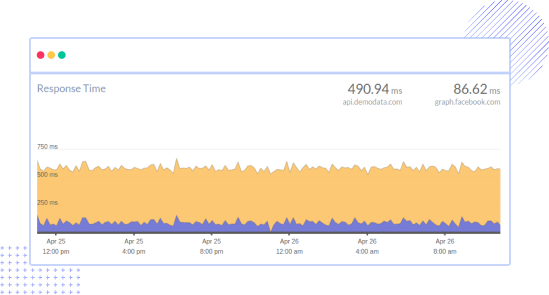
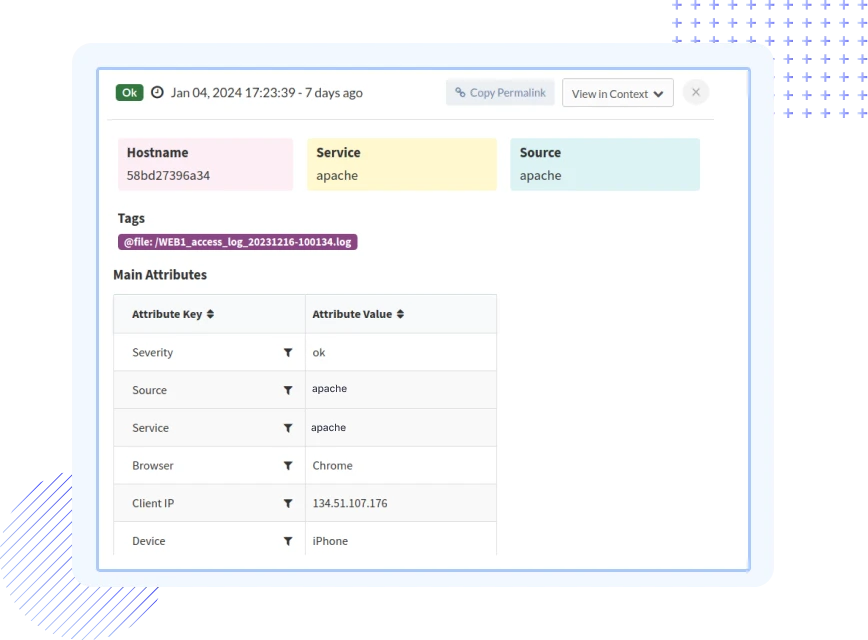
Atatus automatically interprets Apache access and error logs without custom patterns or configuration.
Atatus shows request volume, status codes, and error trends across all Apache servers.
Atatus isolates HTTP errors, worker exhaustion, and configuration issues using indexed logs.
Atatus notifies teams on traffic spikes, repeated failures, and service degradation.
Atatus connects Apache logs with backend application and database activity for full tracing.
Atatus stores Apache logs long-term for historical analysis and recurring issue detection.
Atatus adapts to how engineering teams work across development, operations, and reliability.
Debug errors and slow paths with the full context of what happened.
Atatus for developersTrack deployments and see how each release affects stability.
Atatus for DevOpsWatch latency and error rates to ship with less production risk.
Atatus for release engineersPricing, deployment, data and the agent. If something is missing, a person will answer it on a demo call.
Apache log monitoring is crucial for several reasons. It helps identify potential security threats, troubleshoot issues, optimize server performance, track user activity, and gain insights into website traffic patterns. Monitoring Apache logs allows administrators to proactively address issues, enhance website reliability, and improve the overall user experience.
Apache generates several types of logs, including:
Atatus offers several benefits for Apache logs monitoring, including:
To optimize performance using Apache logs:
Atatus supports various log formats commonly used by Apache, including the Combined Log Format (CLF) and other custom formats. Atatus's log parsing capabilities allow you to extract relevant information from different log formats for analysis and visualization.
Yes, log pipelines can be configured to filter log data based on various attributes such as log source, severity, timestamp, or any custom field. This customization allows users to focus on specific aspects of log data that are most relevant to their monitoring goals.
Saved Views in Apache Logs Monitoring enable you to create and save custom configurations for different troubleshooting scenarios. This feature simplifies collaboration, allows for quick context switching, and automates repetitive tasks, significantly improving overall efficiency.
If you exceed your log ingestion limits, we would contact you to discuss on stopping further processing new log data or upgrade your subscription.
You can choose to store logs in Atatus for a limited time (e.g., 7 days) or export them to external storage solutions like Amazon S3 for long-term retention.
To access historical log data beyond the retention period, you can rely on log data exports from Amazon S3, where you can push the logs into Atatus for further analysis.
Yes, Atatus provides users with the flexibility to customize log retention settings. Users can adjust retention periods based on their specific needs, aligning with compliance standards or internal data management policies.


