Native Node.js stream log capture
Instrument process.stdout/stderr streams and async logger calls to capture unhandledRejection events, assertion failures, and module load errors from production Node.js processes.
Effortlessly track Node.js logs, gaining instant insights into errors and refining logging for a more efficient and reliable application.
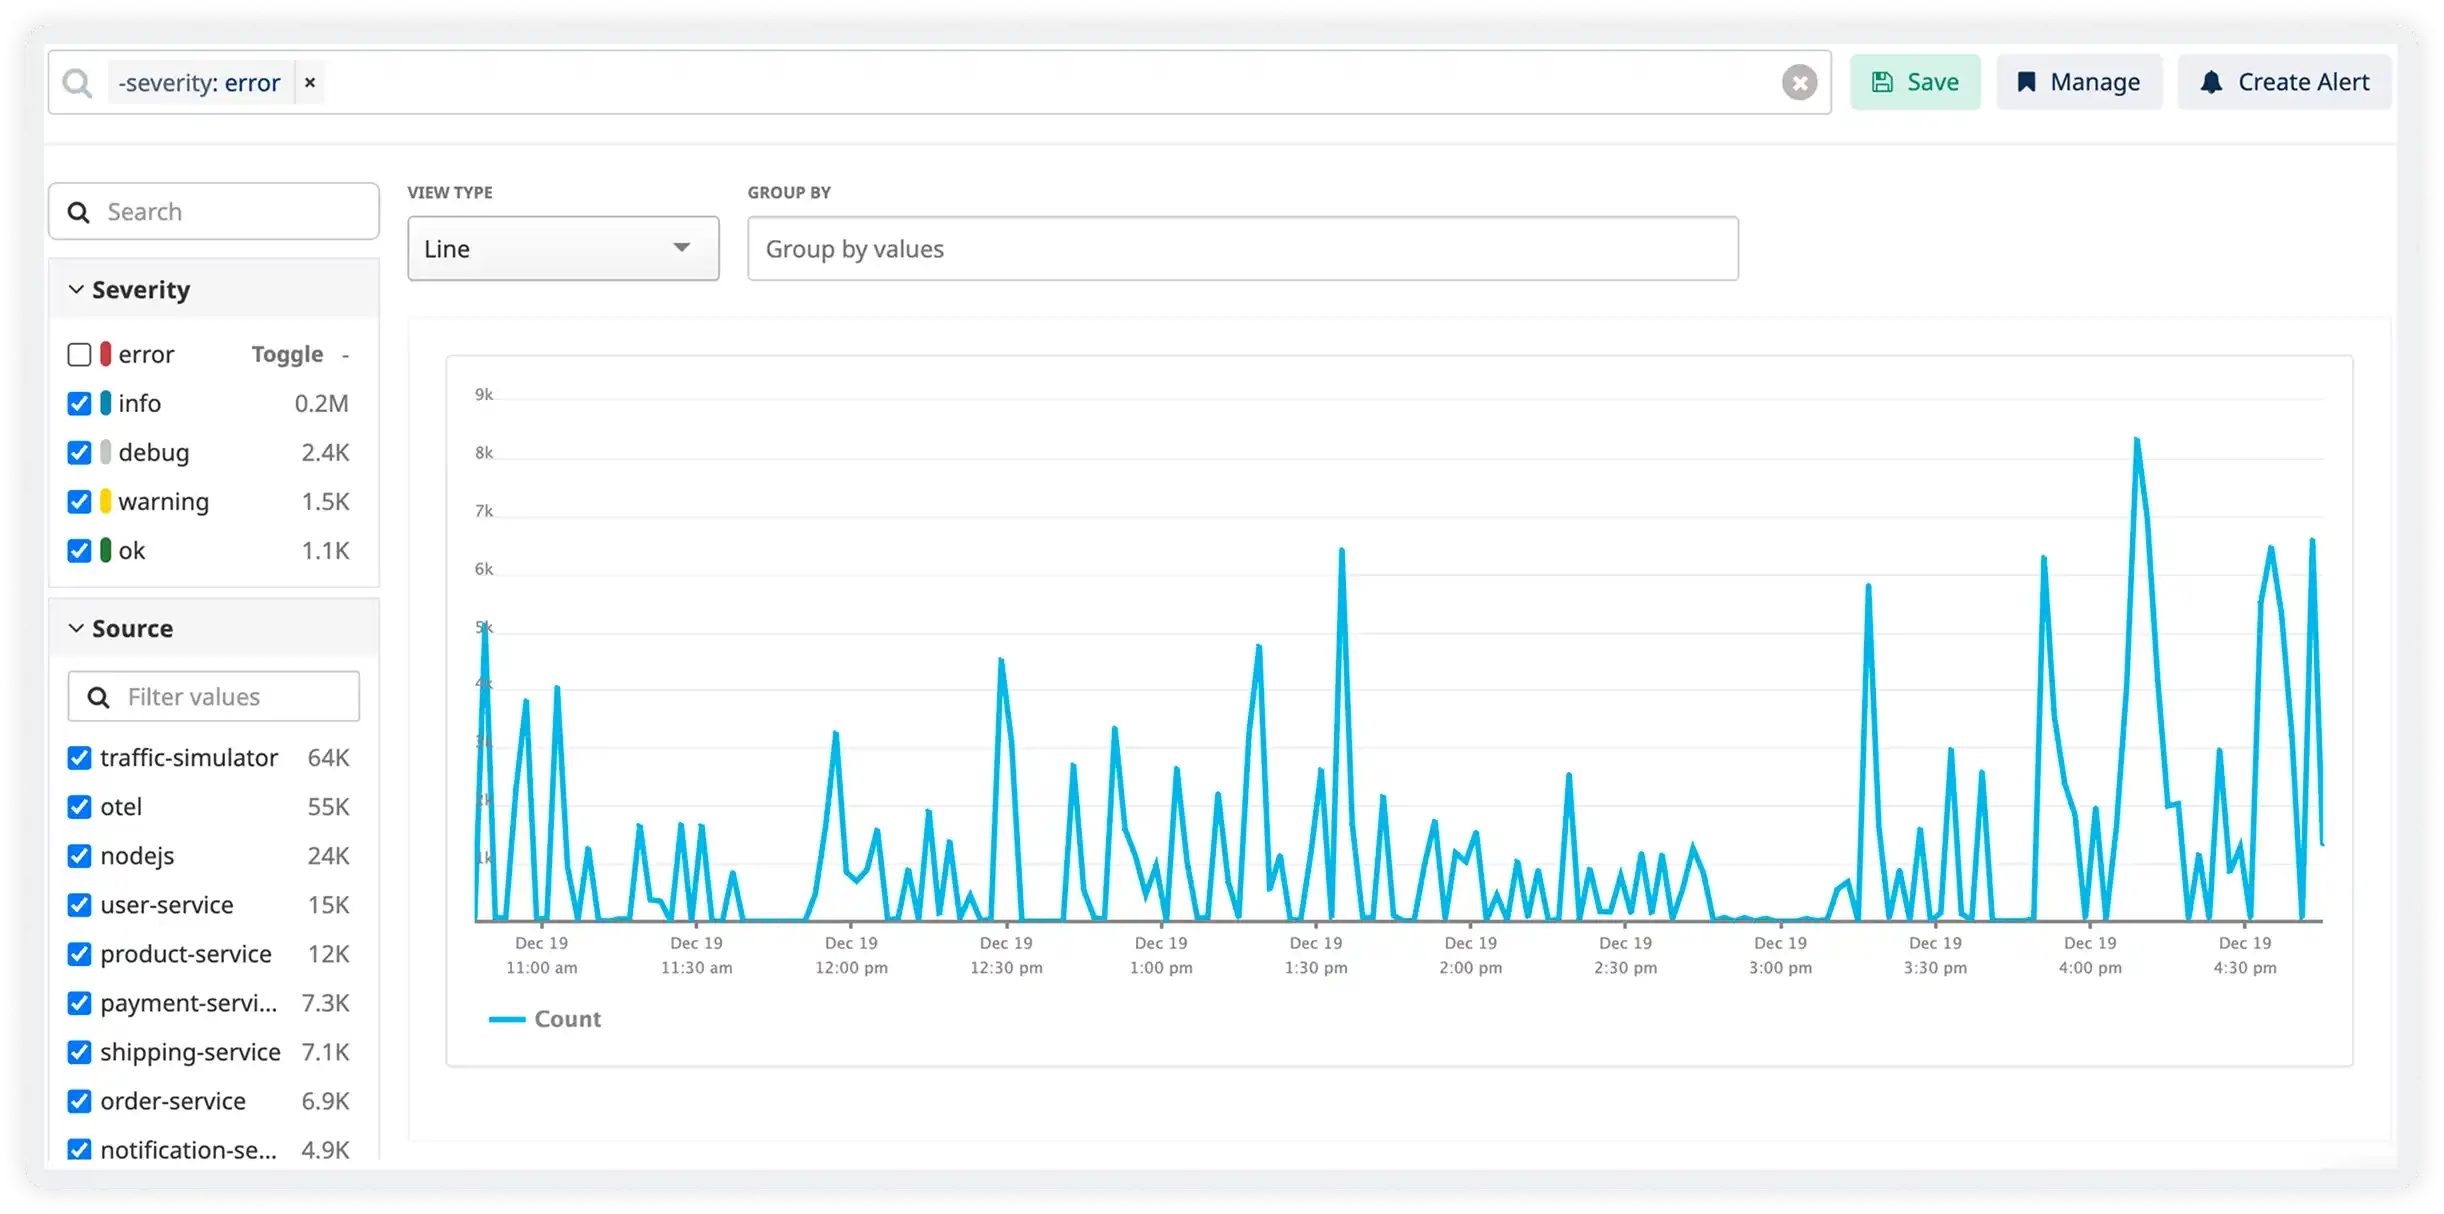
Instrument process.stdout/stderr streams and async logger calls to capture unhandledRejection events, assertion failures, and module load errors from production Node.js processes.
Parse structured logs from Winston, Pino transports, and custom async_hooks domains. Track Promise chain failures, EventEmitter memory leaks, and callback hell scenarios across distributed clusters.
Monitor logs across primary/worker processes, PM2 instance groups, and Docker container fleets. Surface inter-process communication failures and load balancer health issues from Node.js runtime logs.
Detect event loop lag warnings, V8 garbage collection pauses, heapdump triggers, and max-old-space-size exceeded conditions logged by Node.js diagnostics.
Capture Mongoose connection drops, Redis pub/sub disconnects, BullMQ job timeouts, and Prisma query failures embedded in Node.js application logs with full stack context.
Transform minified production stack traces back to original TypeScript/ESM source files. Link Node.js log entries directly to controllers, middleware functions, and service implementations.
Track npm audit warnings, peer dependency mismatches, and package-lock.json drift logged during Node.js startup and hot reload cycles across CI/CD deployments.
Correlate logs across NestJS microservices, Express API gateways, and GraphQL resolvers using traceparent headers and OpenTelemetry context propagation standards.
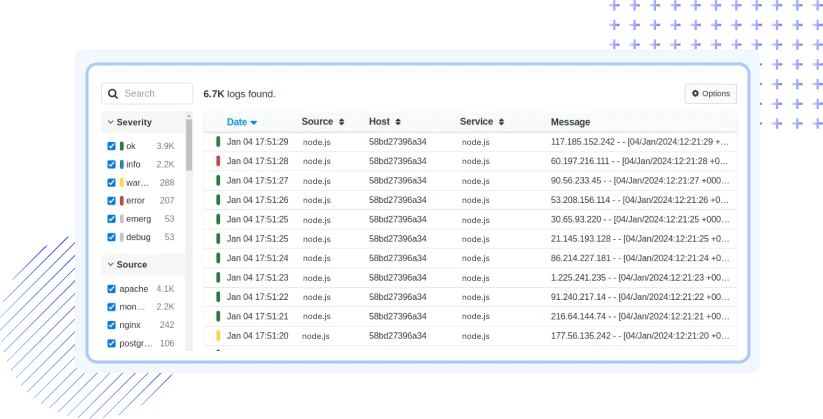
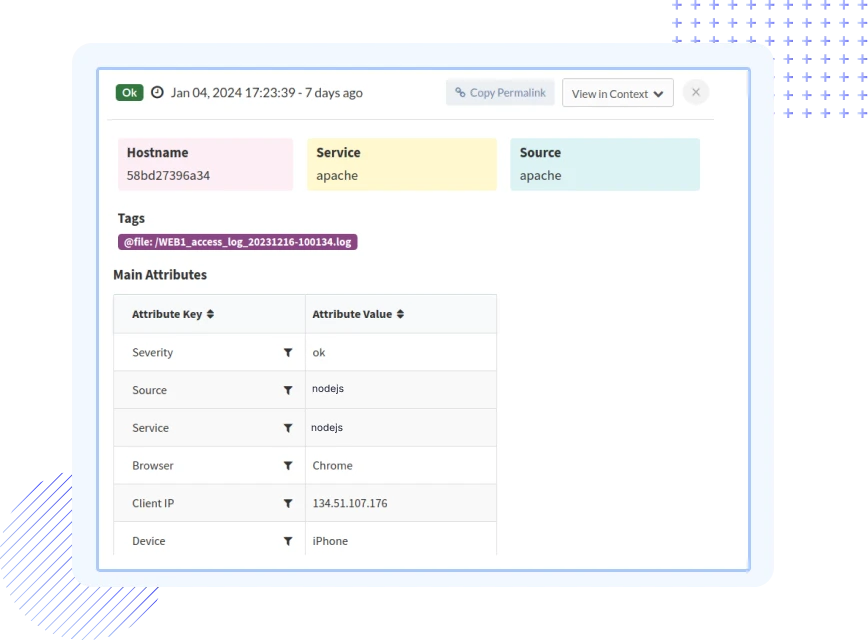
Atatus ingests and structures Pino and Winston logs automatically for high-traffic JavaScript applications.
Atatus detects popular Node.js log libraries without requiring code changes or reconfiguration.
Atatus combines logs across PM2 clusters, containers, and Kubernetes pods into a single timeline.
Atatus forwards logs asynchronously to prevent backpressure during traffic spikes.
Atatus maintains event loop responsiveness even under heavy concurrent workloads.
Atatus preserves critical Node.js logs long-term without runaway storage costs.
Atatus adapts to how engineering teams work across development, operations, and reliability.
Debug errors and slow paths with the full context of what happened.
Atatus for developersTrack deployments and see how each release affects stability.
Atatus for DevOpsWatch latency and error rates to ship with less production risk.
Atatus for release engineersPricing, deployment, data and the agent. If something is missing, a person will answer it on a demo call.
Node.js Logs Monitoring in Atatus is a comprehensive solution that allows users to track, analyze, and troubleshoot logs generated by Node.js applications. It provides real-time visibility into log data, helping to identify issues, improve performance, and ensure the health of your Node.js applications.
Atatus's Node.js Logs Monitoring integrates seamlessly with your Node.js applications, capturing log data and centralizing it for easy analysis. The solution offers powerful search and filter capabilities, making it simple to pinpoint specific events or issues within your logs. It also provides alerting features to notify you of critical events.
By offering real-time log streaming and advanced search capabilities, Node.js Logs Monitoring enables quicker issue identification and resolution. The ability to correlate logs with performance metrics provides a contextual understanding, streamlining the troubleshooting process.
Yes, Atatus provides powerful log filtering and searching capabilities. Users can filter logs based on specific criteria, such as log level, timestamp, or custom keywords. The search functionality allows for efficient navigation through large log datasets.
Yes, Node.js Logs Monitoring seamlessly integrates with other Atatus products, such as APM (Application Performance Monitoring). This integration allows for a holistic view of your Node.js applications, combining logs with performance metrics such as Distributed Traces to provide a comprehensive understanding of your application's health.
Log data parsing prioritizes customer security by meticulously anonymizing Personally Identifiable Information (PII) data. Sensitive fields can be completely excluded during the parsing process, ensuring the privacy and compliance of customer information.
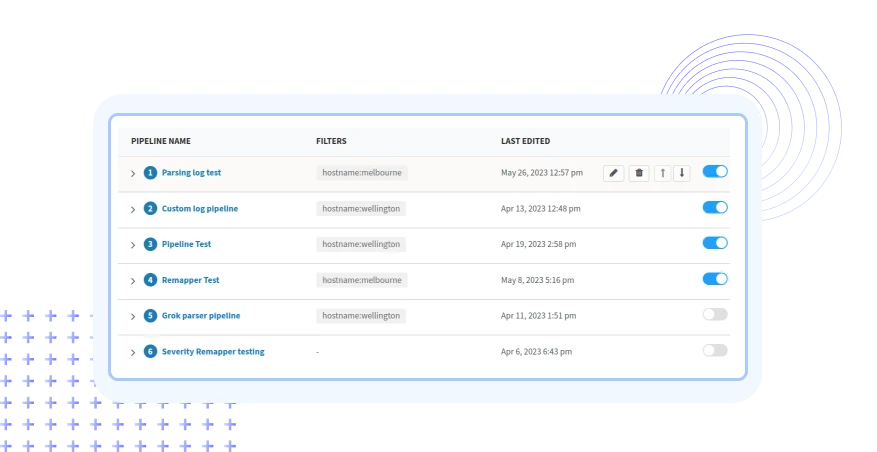
In Node.js Logs Monitoring, log pipelines are customizable workflows that allow users to filter, parse, and fine-tune log data based on specific criteria.
Log pipelines can be customized by using diverse filters and defining custom parsing rules. Users have the flexibility to configure pipelines to meet their specific monitoring requirements, ensuring that log data is processed and organized according to their preferences.
Yes, log pipelines can be configured to filter log data based on various attributes such as log source, severity, timestamp, or any custom field. This customization allows users to focus on specific aspects of log data that are most relevant to their monitoring goals.
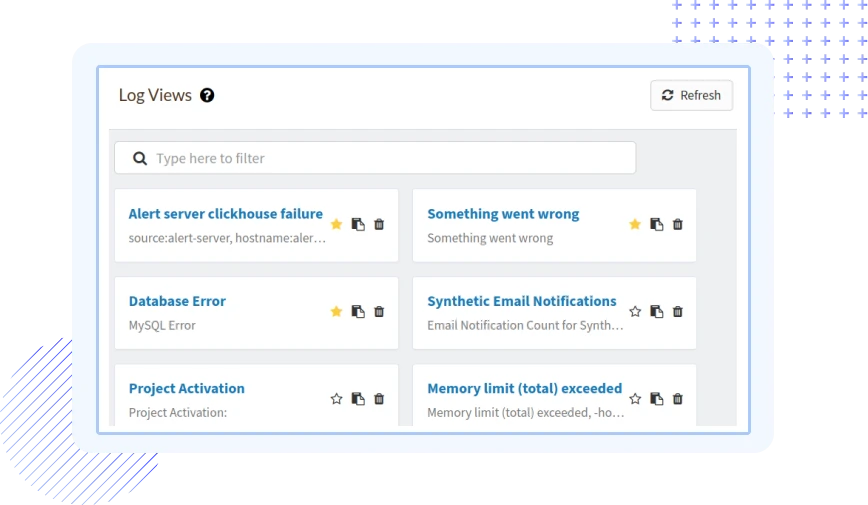
Saved Views in Node.js Logs Monitoring enable you to create and save custom configurations for different troubleshooting scenarios. This feature simplifies collaboration, allows for quick context switching, and automates repetitive tasks, significantly improving overall efficiency.
If you exceed your log ingestion limits, we would contact you to discuss on stopping further processing new log data or upgrade your subscription.
You can choose to store logs in Atatus for a limited time (e.g., 7 days) or export them to external storage solutions like Amazon S3 for long-term retention.
To access historical log data beyond the retention period, you can rely on log data exports from Amazon S3, where you can push the logs into Atatus for further analysis.
Yes, Atatus provides users with the flexibility to customize log retention settings. Users can adjust retention periods based on their specific needs, aligning with compliance standards or internal data management policies.


