Analyze access log requests
Inspect NGINX access logs to understand request volume, upstream response times, and HTTP status distribution.
Understand backend routing behavior, concurrency pressure, and traffic anomalies affecting service delivery.
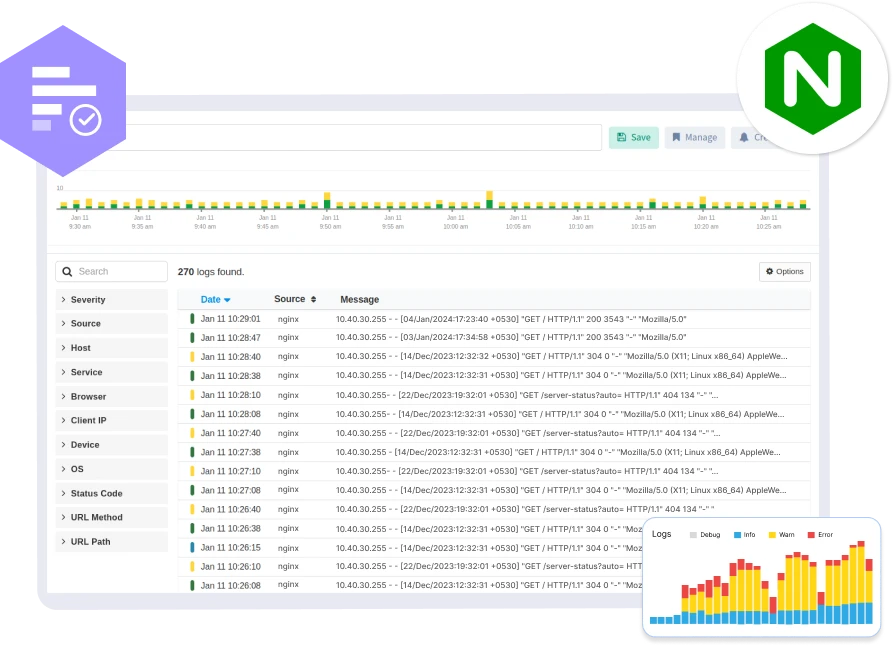
Inspect NGINX access logs to understand request volume, upstream response times, and HTTP status distribution.
Monitor NGINX error logs for upstream connection failures, timeouts, and bad gateway errors.
Analyze NGINX startup and reload logs to identify invalid directives and syntax errors.
Capture NGINX logs generated by rate limiting and request throttling rules.
Inspect NGINX SSL logs to detect certificate issues and TLS negotiation failures.
Analyze logs related to upstream selection and retry logic to understand traffic distribution.
Identify malformed requests, excessive retries, and suspicious traffic patterns from access logs.
Link NGINX log entries with backend service logs for end-to-end request tracing.
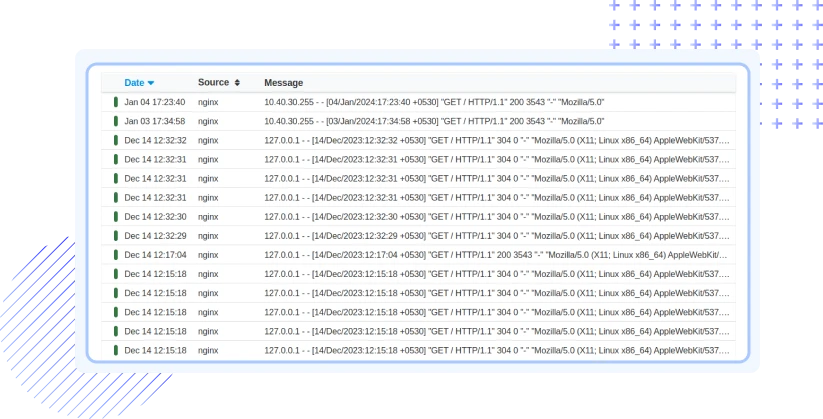
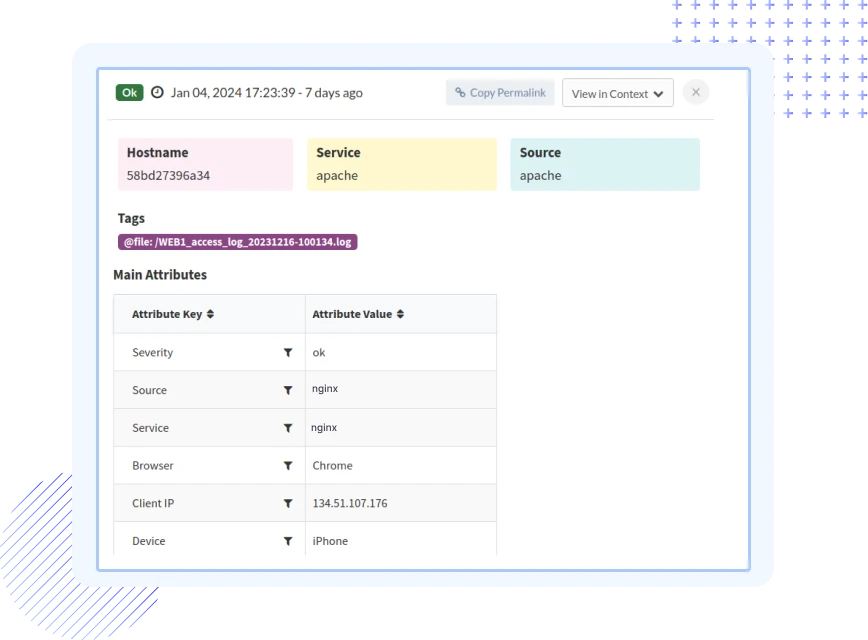

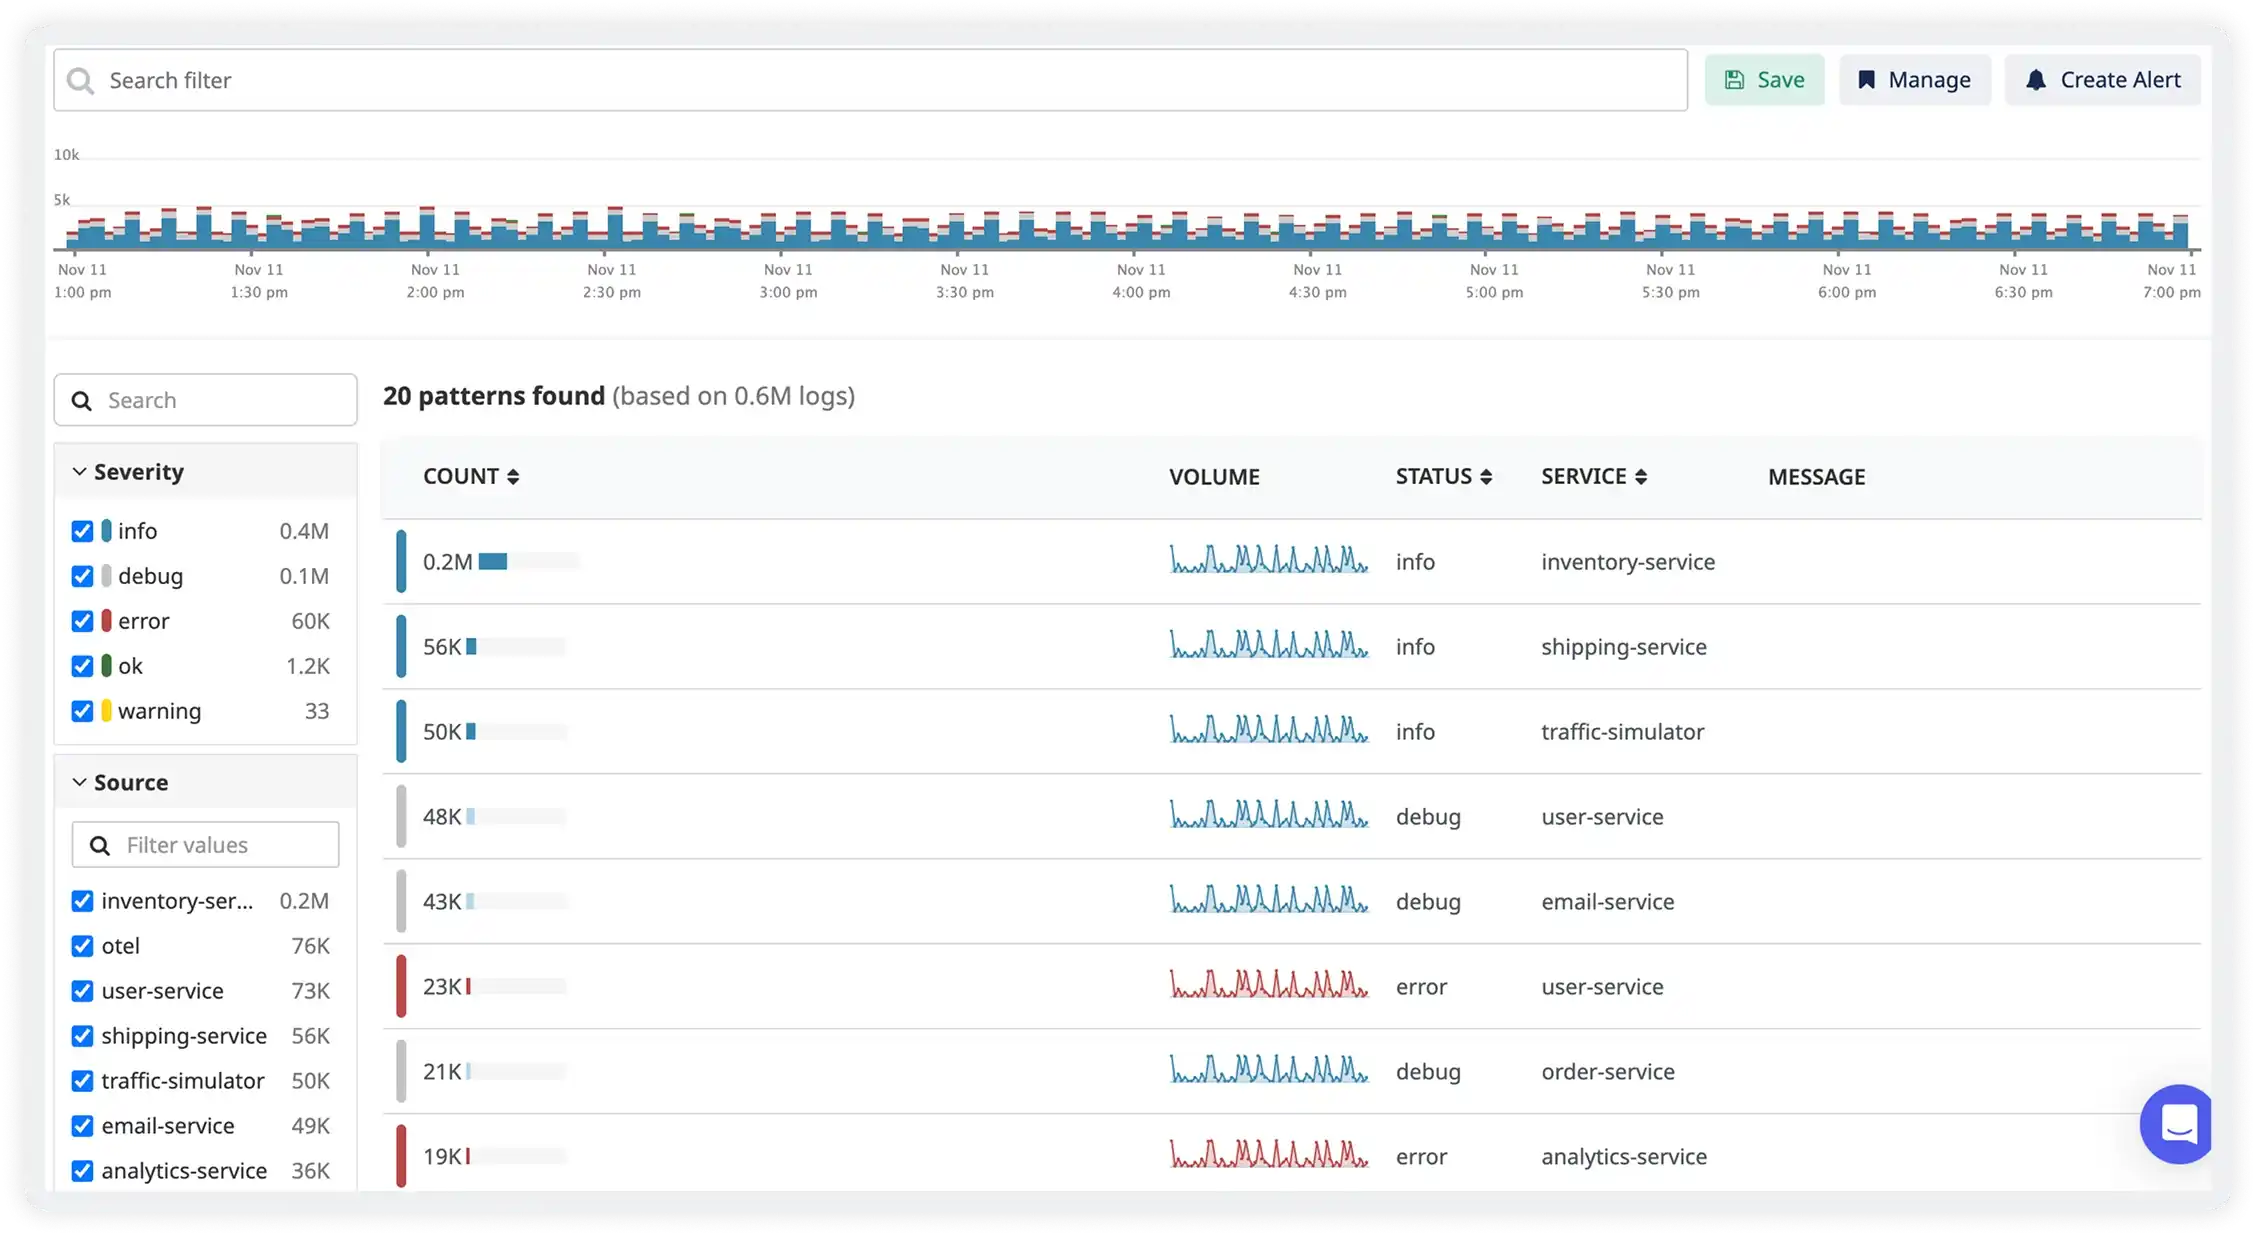
Atatus interprets NGINX access and error logs with upstream and request-level context automatically.
Atatus centralizes logs from all NGINX instances handling ingress and proxy traffic.
Atatus quickly identifies upstream failures, timeouts, and configuration issues.
Atatus triggers alerts on 4xx and 5xx spikes, timeouts, and rejected requests.
Atatus links NGINX events with backend service logs for end-to-end tracing.
Atatus reliably handles NGINX log surges during traffic peaks and deployments.
Atatus adapts to how engineering teams work across development, operations, and reliability.
Debug errors and slow paths with the full context of what happened.
Atatus for developersTrack deployments and see how each release affects stability.
Atatus for DevOpsWatch latency and error rates to ship with less production risk.
Atatus for release engineersPricing, deployment, data and the agent. If something is missing, a person will answer it on a demo call.
Log monitoring in Atatus allows you to gain insights into the behavior of your Nginx applications by collecting and analyzing log data. It helps identify issues, track performance, and troubleshoot errors, leading to improved application reliability and performance.
You can send Nginx logs to Atatus by integrating the Atatus Agent with your Nginx application. The Atatus Agent supports various logging libraries, such as Log4j, Winston, Bunyan and so on. By configuring the agent and updating your application's logging configuration, you can seamlessly send logs to Atatus.
Atatus supports multiple log levels, including INFO, DEBUG, WARN, and ERROR. You can configure your Nginx application to log messages at different levels, allowing you to filter and analyze logs based on severity.
Yes, Atatus enables you to set up alerts based on specific log patterns or occurrences. By creating custom log-based metrics or using predefined log query filters, you can define alert conditions and receive notifications when certain log events match the specified criteria.
Yes, Atatus supports distributed tracing for Nginx applications. By instrumenting your code with the Atatus tracing library, you can trace requests and transactions across distributed components, gaining insights into the entire application's performance.
Log data parsing prioritizes customer security by meticulously anonymizing Personally Identifiable Information (PII) data. Sensitive fields can be completely excluded during the parsing process, ensuring the privacy and compliance of customer information.
In Nginx Logs Monitoring, log pipelines are customizable workflows that allow users to filter, parse, and fine-tune log data based on specific criteria.
Log pipelines can be customized by using diverse filters and defining custom parsing rules. Users have the flexibility to configure pipelines to meet their specific monitoring requirements, ensuring that log data is processed and organized according to their preferences.
Yes, log pipelines can be configured to filter log data based on various attributes such as log source, severity, timestamp, or any custom field. This customization allows users to focus on specific aspects of log data that are most relevant to their monitoring goals.
Saved Views in Nginx Logs Monitoring enable you to create and save custom configurations for different troubleshooting scenarios. This feature simplifies collaboration, allows for quick context switching, and automates repetitive tasks, significantly improving overall efficiency.
If you exceed your log ingestion limits, we would contact you to discuss on stopping further processing new log data or upgrade your subscription.
You can choose to store logs in Atatus for a limited time (e.g., 7 days) or export them to external storage solutions like Amazon S3 for long-term retention.
To access historical log data beyond the retention period, you can rely on log data exports from Amazon S3, where you can push the logs into Atatus for further analysis.
Yes, Atatus provides users with the flexibility to customize log retention settings. Users can adjust retention periods based on their specific needs, aligning with compliance standards or internal data management policies.


