Centralize Python logging output
Collect logs emitted via the Python logging module, structlog, and framework-level loggers from Django, Flask, and FastAPI applications into a unified log stream.
Effortlessly track Python logs, gaining instant insights into errors and refining logging for a more efficient and reliable application.
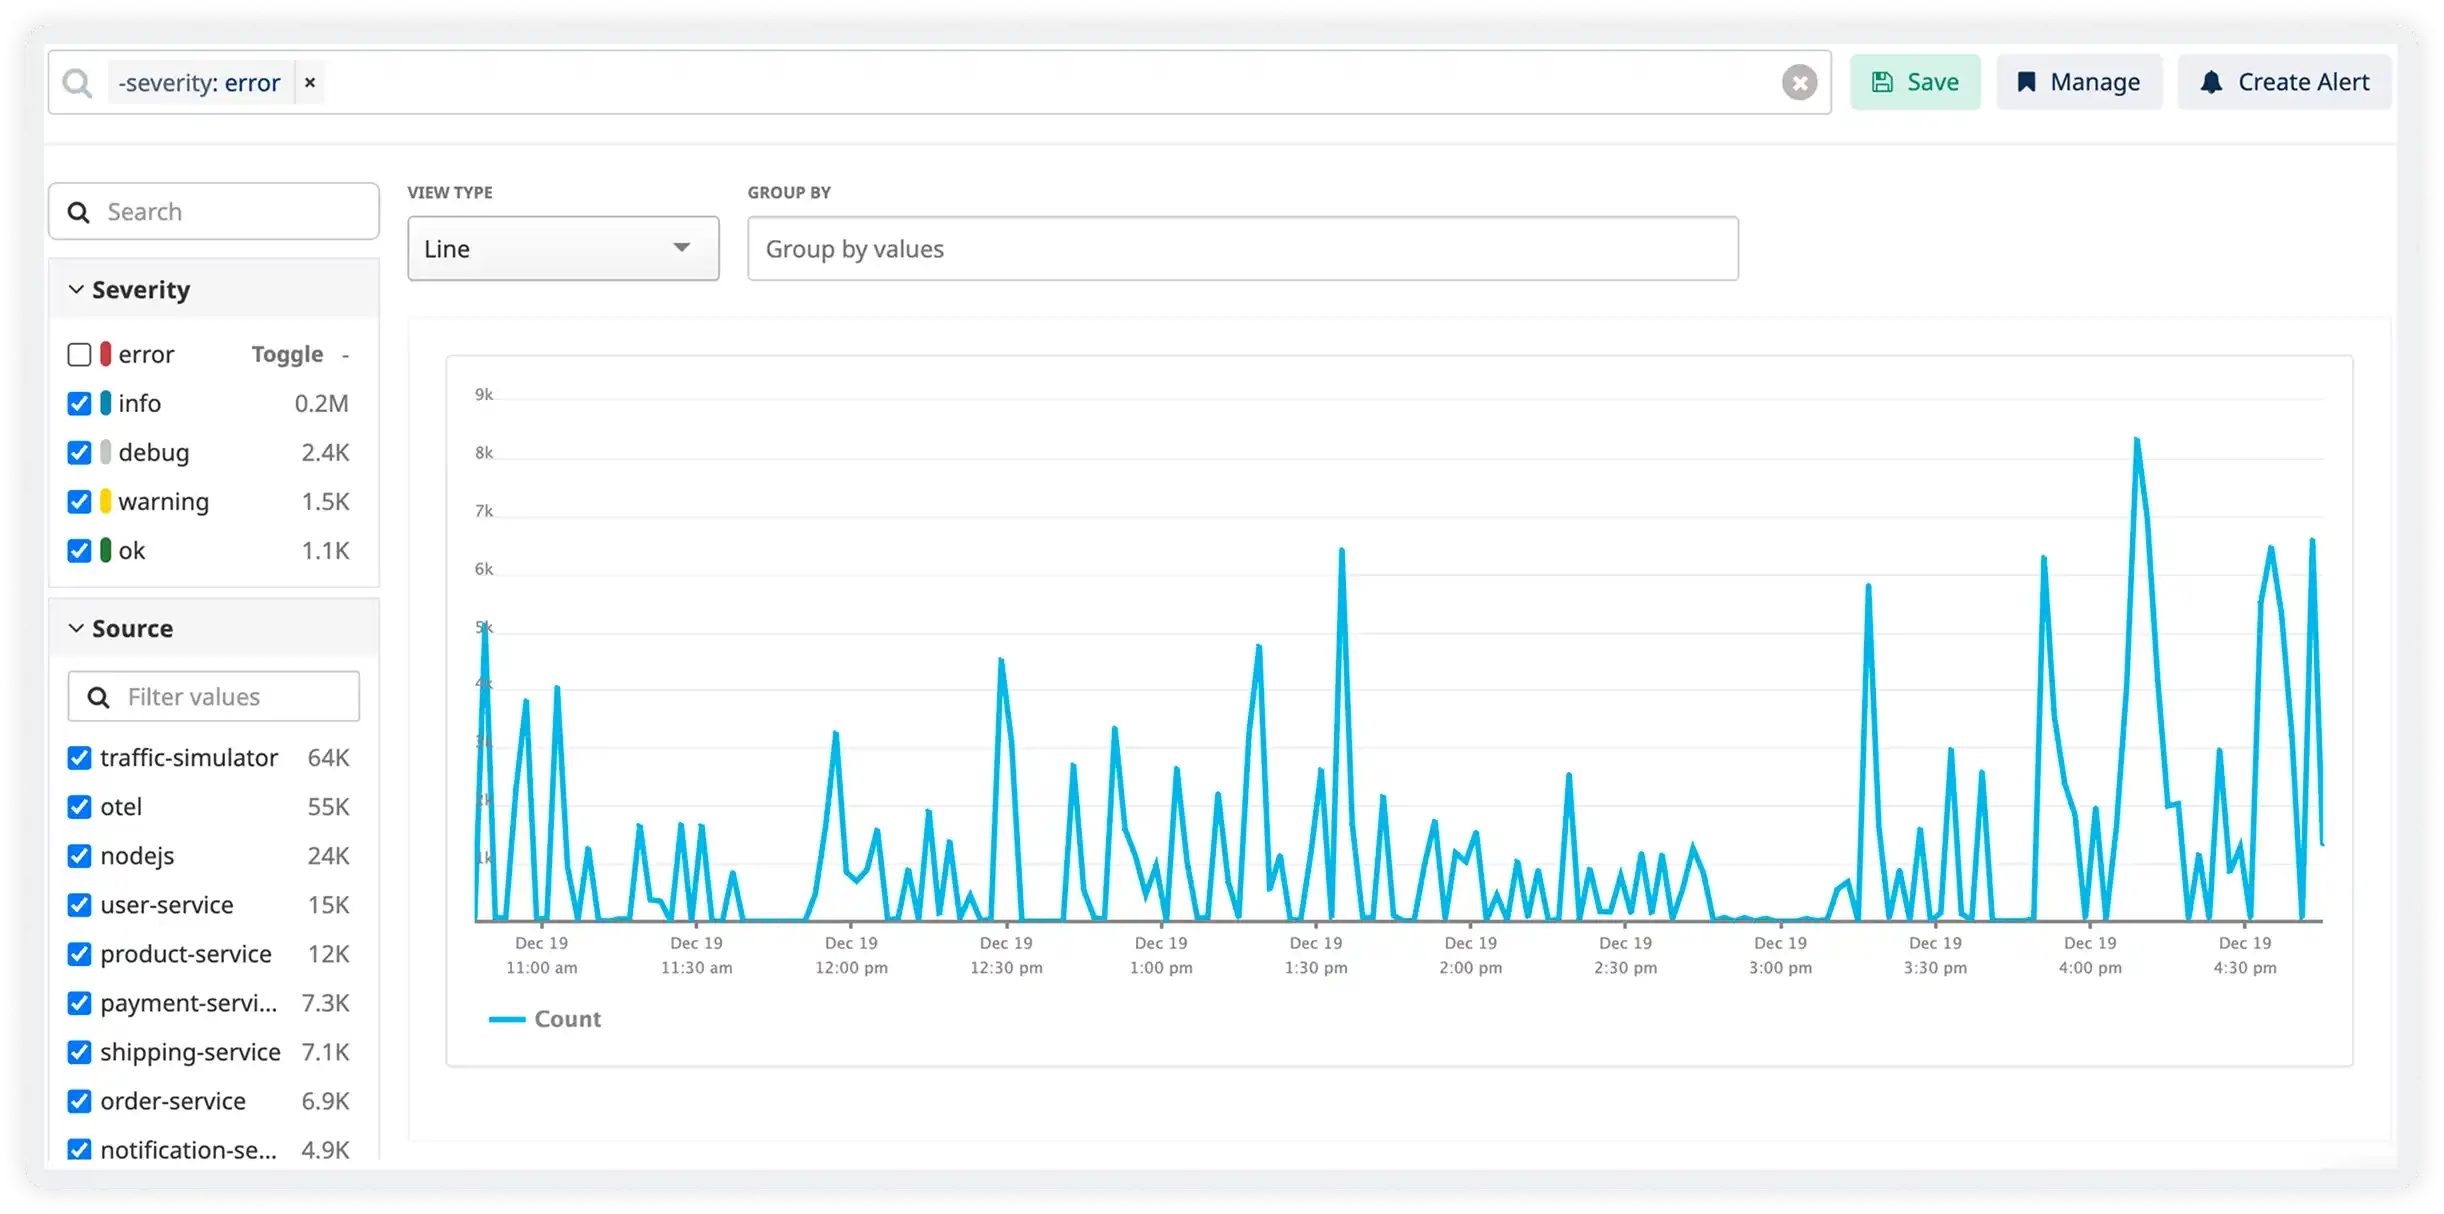
Collect logs emitted via the Python logging module, structlog, and framework-level loggers from Django, Flask, and FastAPI applications into a unified log stream.
Extract fields from JSON logs, logger adapters, and contextual variables such as request IDs, user context, and correlation keys injected at runtime.
Correlate logs generated during request handling, middleware execution, ORM queries, and response processing to analyze slow endpoints and request bottlenecks.
Capture uncaught exceptions, stack traces, and traceback logs raised by Python applications to identify logic errors and failure points.
Maintain request and trace context across asynchronous request handling and background processing in Python applications.
Resolve stack traces to Python modules, functions, and line numbers to quickly locate the origin of runtime failures in application code.
Collect startup and runtime logs that expose missing packages, version conflicts, and import resolution failures in virtual environments.
Track logs generated by multi-process Python runtimes such as Gunicorn, uWSGI, and Celery workers to analyze restarts, crashes, and execution issues.
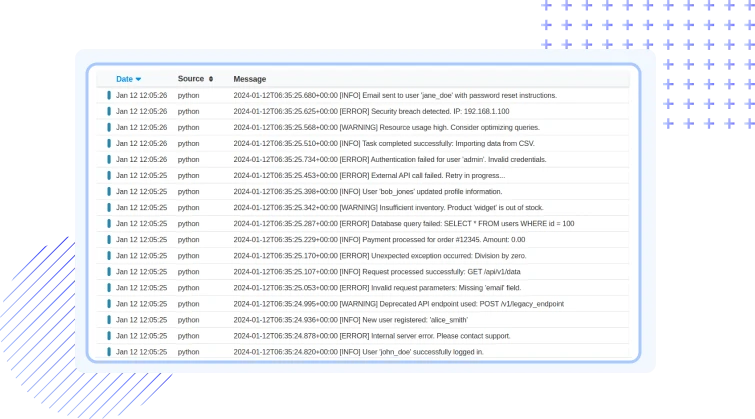
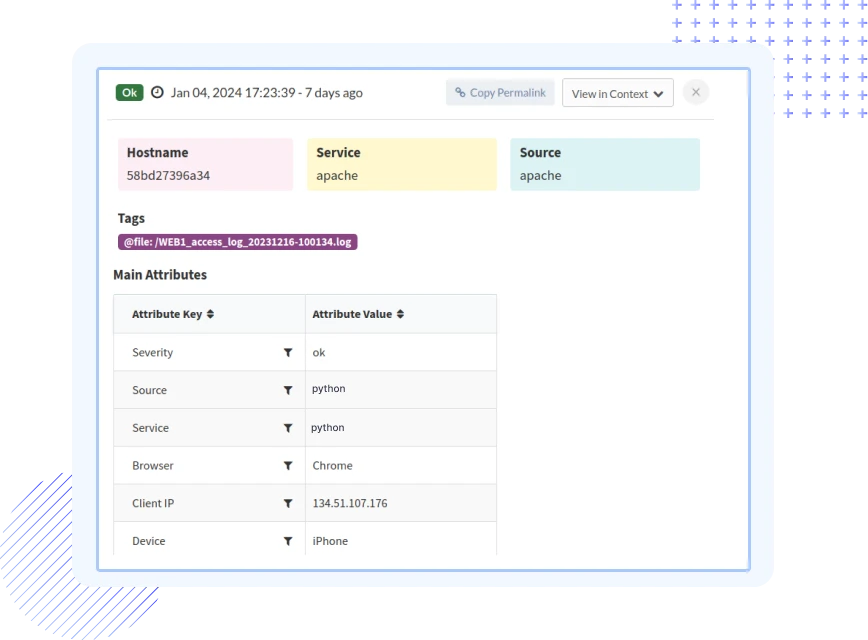

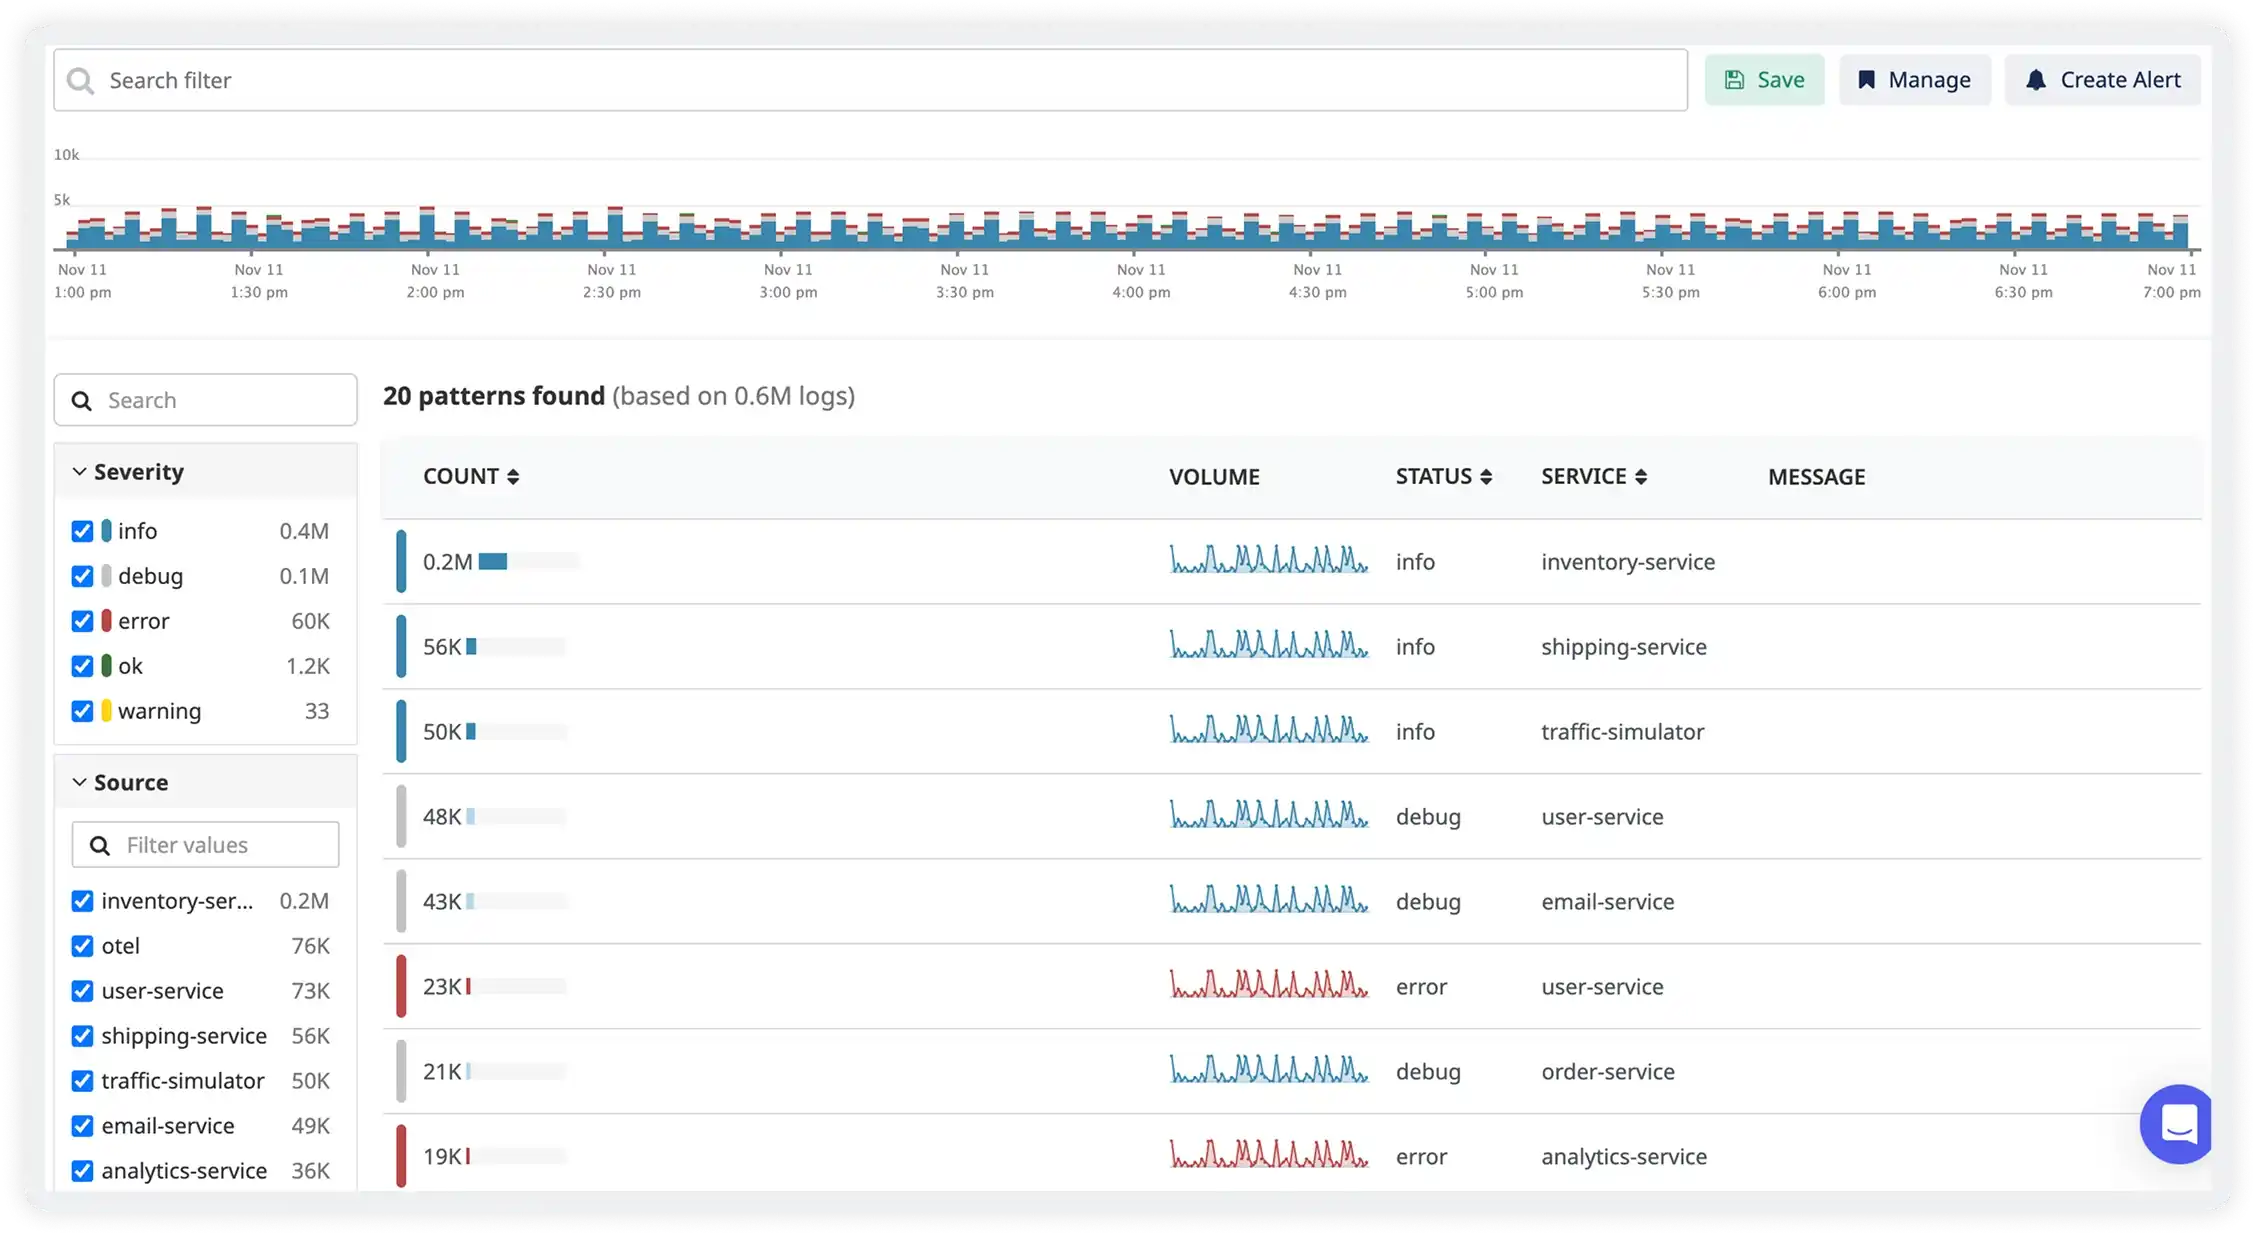
Atatus integrates seamlessly with Python logging frameworks and structured log libraries without invasive changes.
Atatus connects logs from Django, Flask, and FastAPI layers to reflect real request execution paths.
Atatus captures logs from asyncio tasks and background workers with full execution context.
Atatus indexes and groups Python tracebacks to accelerate root cause analysis.
Atatus centralizes logs across containers, VMs, and orchestrated environments.
Atatus stores application and audit logs with configurable retention for production compliance.
Atatus adapts to how engineering teams work across development, operations, and reliability.
Debug errors and slow paths with the full context of what happened.
Atatus for developersTrack deployments and see how each release affects stability.
Atatus for DevOpsWatch latency and error rates to ship with less production risk.
Atatus for release engineersPricing, deployment, data and the agent. If something is missing, a person will answer it on a demo call.
Python Logs Monitoring in Atatus is a comprehensive solution that allows users to track, analyze, and troubleshoot logs generated by Python applications. It provides real-time visibility into log data, helping to identify issues, improve performance, and ensure the health of your Python applications.
Atatus's Python Logs Monitoring integrates seamlessly with your Python applications, capturing log data and centralizing it for easy analysis. The solution offers powerful search and filter capabilities, making it simple to pinpoint specific events or issues within your logs. It also provides alerting features to notify you of critical events.
By offering real-time log streaming and advanced search capabilities, Python Logs Monitoring enables quicker issue identification and resolution. The ability to correlate logs with performance metrics provides a contextual understanding, streamlining the troubleshooting process.
Yes, Atatus provides powerful log filtering and searching capabilities. Users can filter logs based on specific criteria, such as log level, timestamp, or custom keywords. The search functionality allows for efficient navigation through large log datasets.
Yes, Python Logs Monitoring seamlessly integrates with other Atatus products, such as APM (Application Performance Monitoring). This integration allows for a holistic view of your Python applications, combining logs with performance metrics such as Distributed Traces to provide a comprehensive understanding of your application's health.
Log data parsing prioritizes customer security by meticulously anonymizing Personally Identifiable Information (PII) data. Sensitive fields can be completely excluded during the parsing process, ensuring the privacy and compliance of customer information.
In Python Logs Monitoring, log pipelines are customizable workflows that allow users to filter, parse, and fine-tune log data based on specific criteria.
Log pipelines can be customized by using diverse filters and defining custom parsing rules. Users have the flexibility to configure pipelines to meet their specific monitoring requirements, ensuring that log data is processed and organized according to their preferences.
Yes, log pipelines can be configured to filter log data based on various attributes such as log source, severity, timestamp, or any custom field. This customization allows users to focus on specific aspects of log data that are most relevant to their monitoring goals.
Saved Views in Python Logs Monitoring enable you to create and save custom configurations for different troubleshooting scenarios. This feature simplifies collaboration, allows for quick context switching, and automates repetitive tasks, significantly improving overall efficiency.
If you exceed your log ingestion limits, we would contact you to discuss on stopping further processing new log data or upgrade your subscription.
You can choose to store logs in Atatus for a limited time (e.g., 7 days) or export them to external storage solutions like Amazon S3 for long-term retention.
To access historical log data beyond the retention period, you can rely on log data exports from Amazon S3, where you can push the logs into Atatus for further analysis.
Yes, Atatus provides users with the flexibility to customize log retention settings. Users can adjust retention periods based on their specific needs, aligning with compliance standards or internal data management policies.


