Opaque worker lifecycle
Worker spawn, reuse, and termination behavior is not visible at runtime, making saturation hard to explain.
Gain complete visibility into your PHP FPM instances with real-time health, performance, and resource utilization tracking. Detect bottlenecks instantly, optimize resource allocation, and maintain a high-performing, stable application even during traffic surges and resource fluctuations.
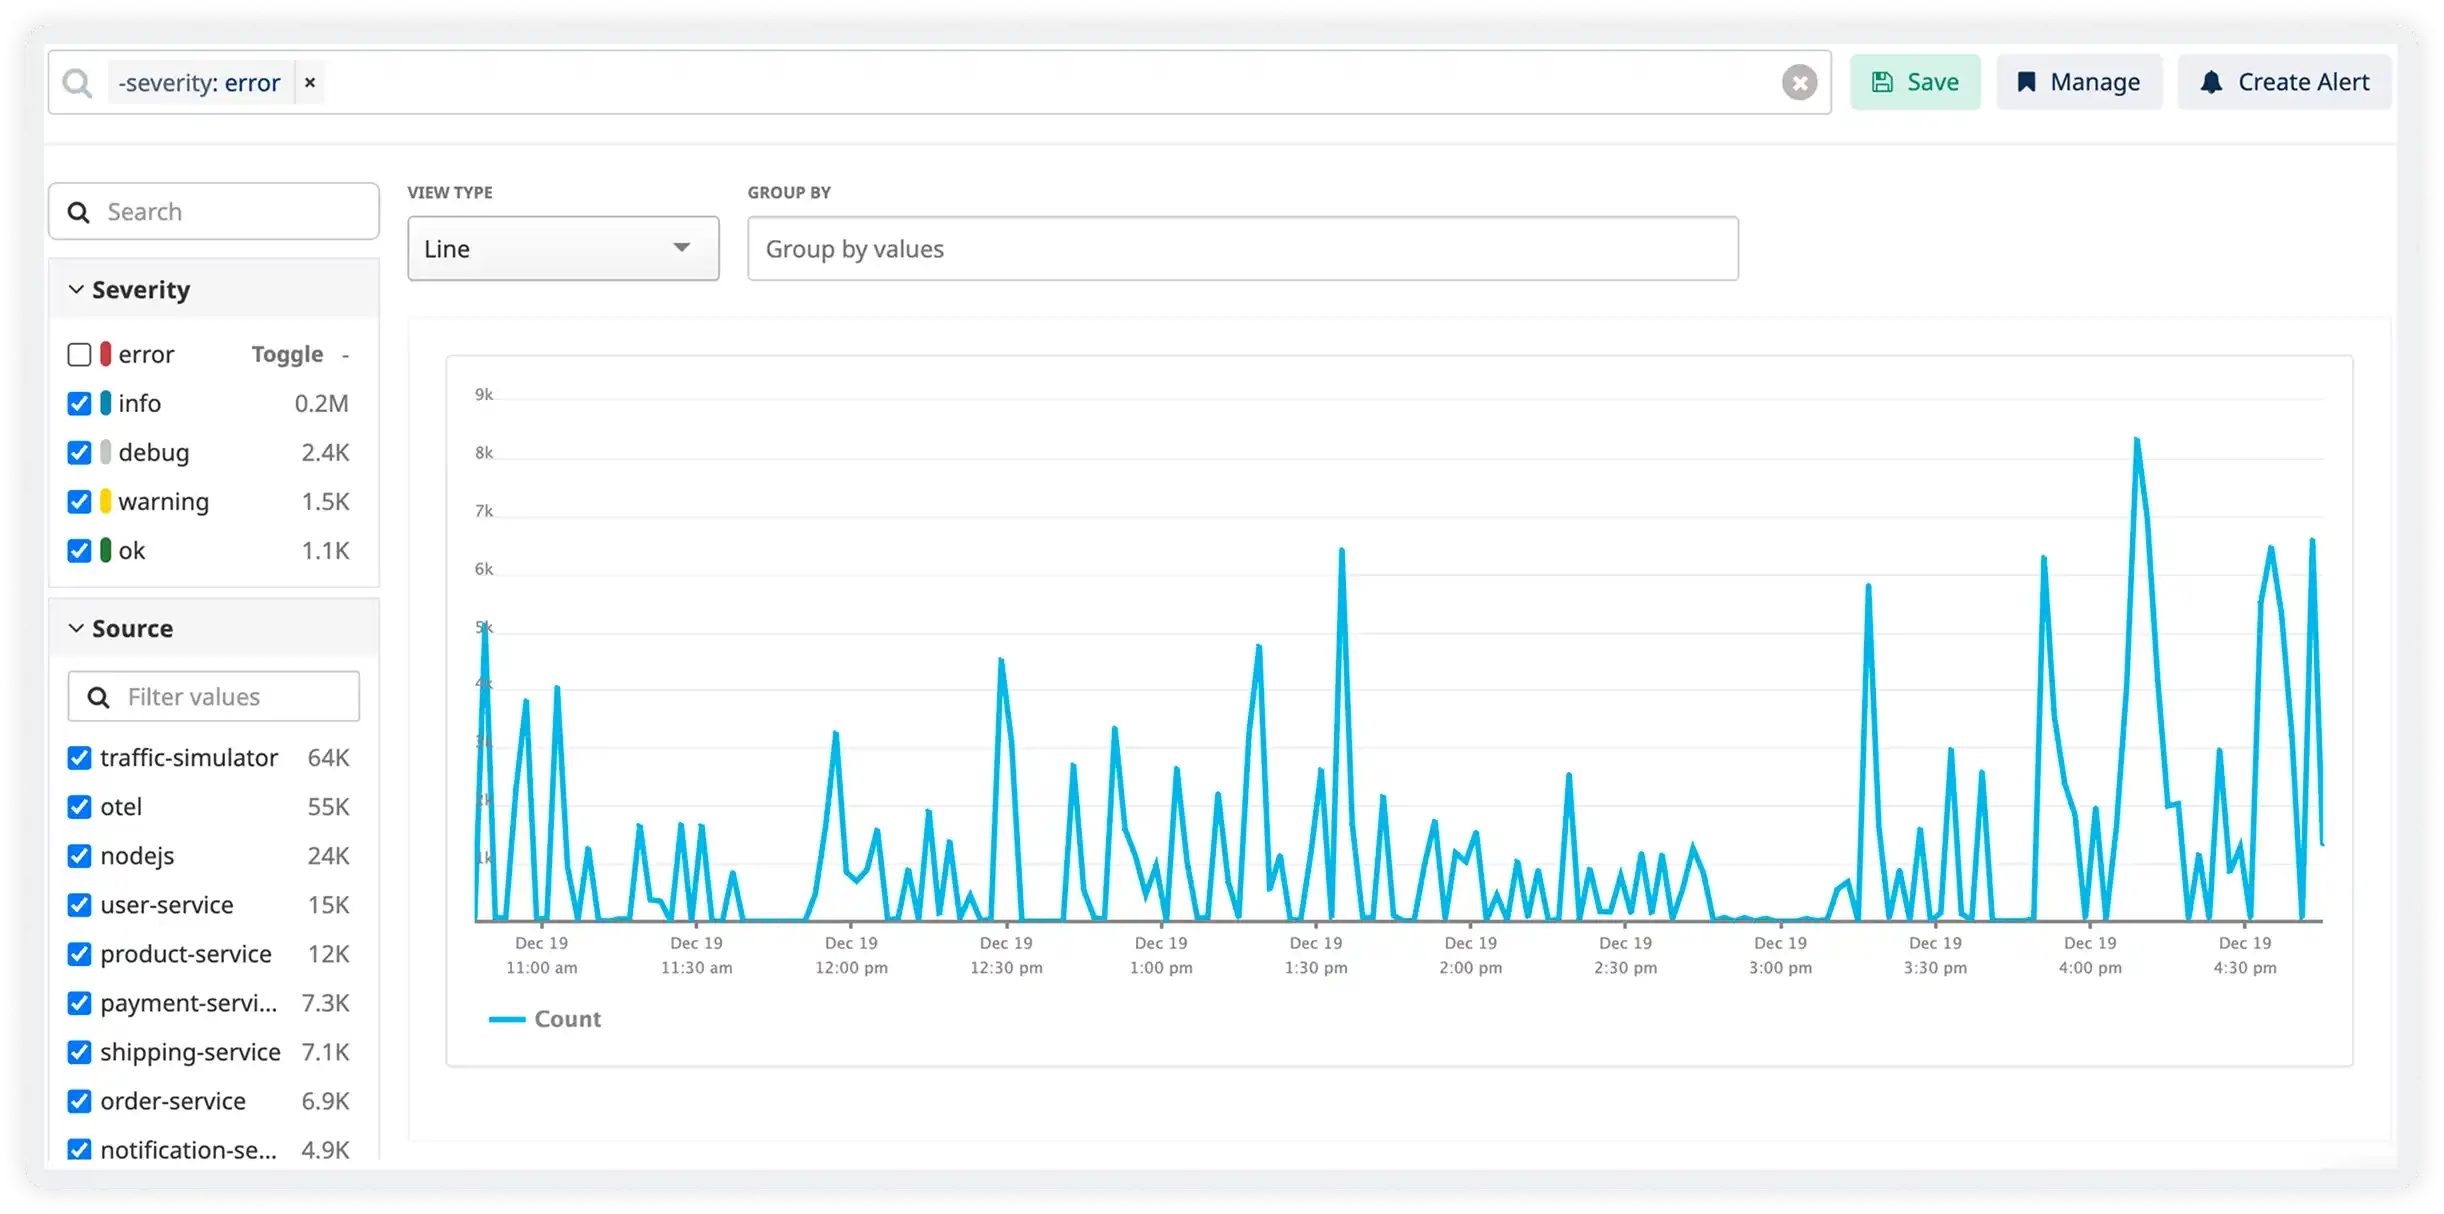
Worker spawn, reuse, and termination behavior is not visible at runtime, making saturation hard to explain.
Highly variable PHP request runtimes block workers unpredictably, with no clear attribution.
Slowlog entries lack request-level context, forcing manual reconstruction of execution paths.
PHP-FPM logs operate at process boundaries, burying meaningful execution signals in volume.
Max children limits are hit under burst traffic without visibility into which code paths caused contention.
Database or external service delays surface as PHP latency, obscuring the true source of slowdown.
Worker restarts discard in-flight execution state, limiting post-incident analysis.
Answering basic performance questions requires SSH access and manual log analysis.
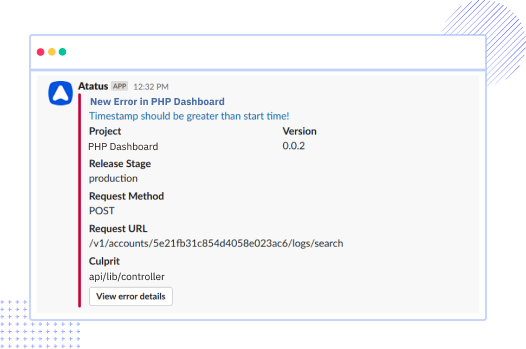
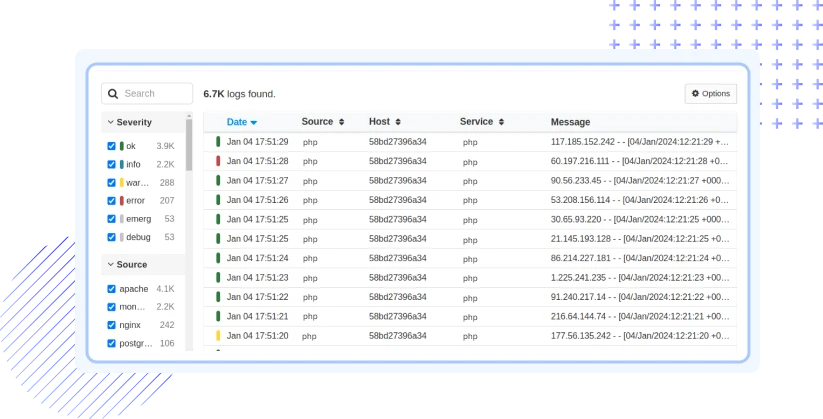
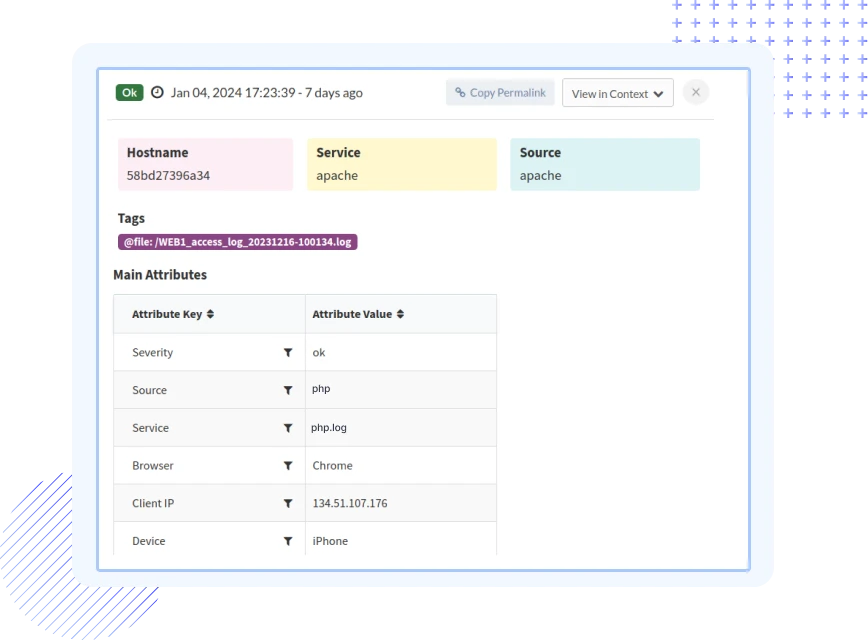
Teams choose Atatus when PHP-FPM behavior must be understood at the execution and process level, not inferred from surface metrics.
Engineers can reason about how individual PHP requests consume workers and execution time.
Production behavior is derived from real execution data instead of averaged assumptions.
Live PHP-FPM state becomes understandable without deep manual investigation.
Fits into existing PHP-FPM setups without altering request handling or deployments.
Observability aligns with how backend engineers debug PHP in real systems.
Teams rebuild execution timelines quickly instead of stitching logs post-failure.
System behavior remains explainable as traffic, workers, and complexity increase.
Platform, SRE, and backend teams operate from the same runtime facts.
Teams tune, deploy, and scale PHP-FPM knowing execution behavior stays visible.
Atatus adapts to how engineering teams work across development, operations, and reliability.
Debug errors and slow paths with the full context of what happened.
Atatus for developersTrack deployments and see how each release affects stability.
Atatus for DevOpsWatch latency and error rates to ship with less production risk.
Atatus for release engineersPricing, deployment, data and the agent. If something is missing, a person will answer it on a demo call.
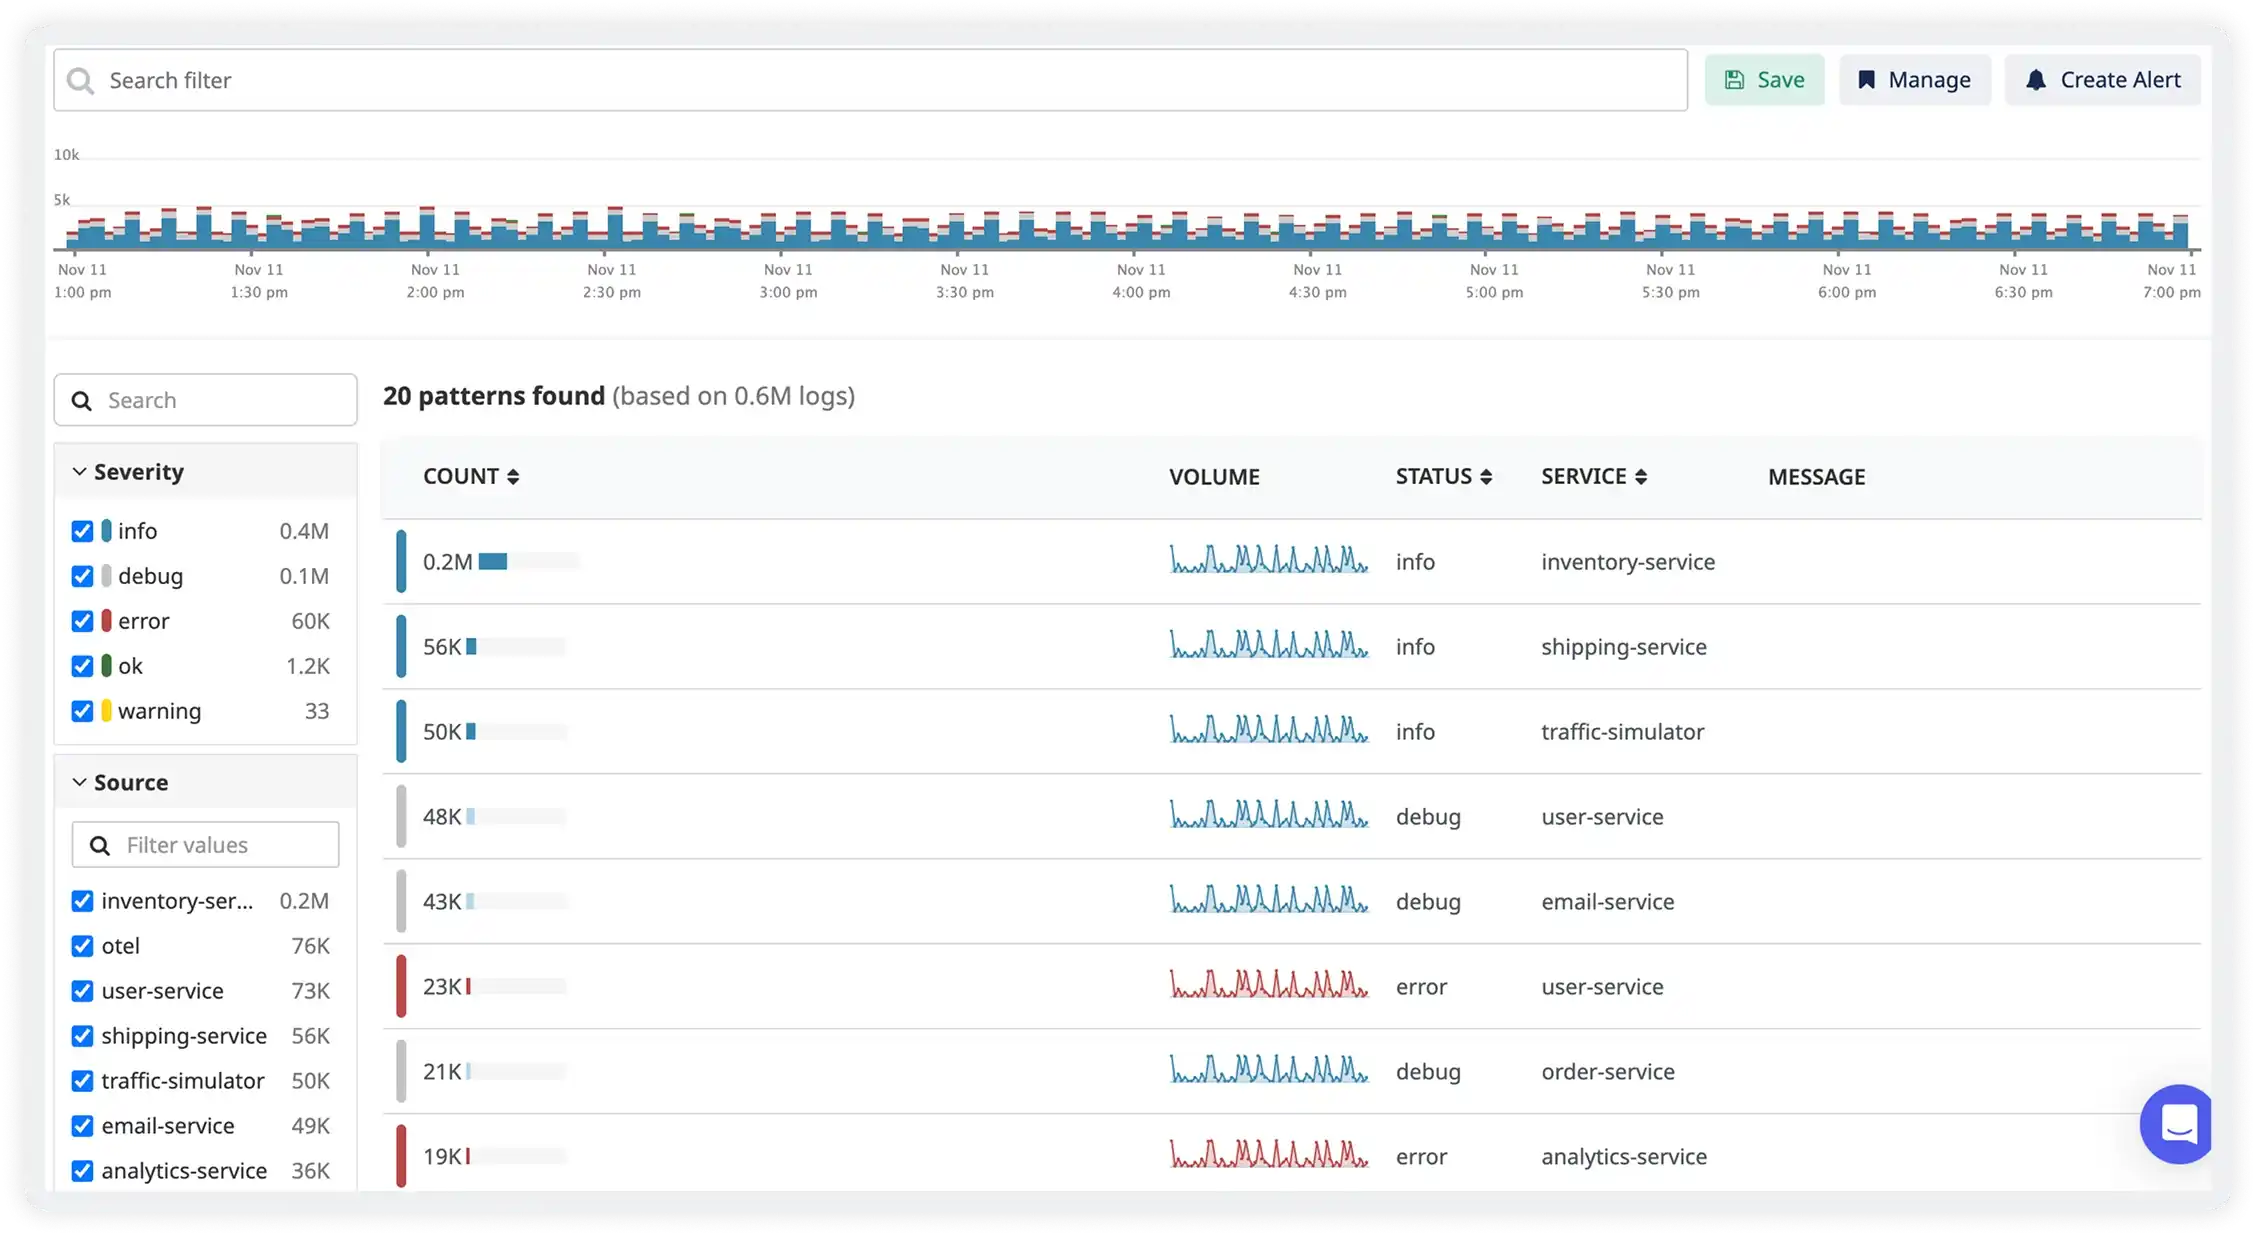
PHP FPM Logs Monitoring in Atatus is a comprehensive solution that allows users to track, analyze, and troubleshoot logs generated by PHP FPM applications. It provides real-time visibility into log data, helping to identify issues, improve performance, and ensure the health of your PHP FPM applications.
Atatus's PHP FPM Logs Monitoring integrates seamlessly with your PHP FPM applications, capturing log data and centralizing it for easy analysis. The solution offers powerful search and filter capabilities, making it simple to pinpoint specific events or issues within your logs. It also provides alerting features to notify you of critical events.
By offering real-time log streaming and advanced search capabilities, PHP FPM Logs Monitoring enables quicker issue identification and resolution. The ability to correlate logs with performance metrics provides a contextual understanding, streamlining the troubleshooting process.
Yes, Atatus provides powerful log filtering and searching capabilities. Users can filter logs based on specific criteria, such as log level, timestamp, or custom keywords. The search functionality allows for efficient navigation through large log datasets.
Yes, PHP FPM Logs Monitoring seamlessly integrates with other Atatus products, such as APM (Application Performance Monitoring). This integration allows for a holistic view of your PHP FPM applications, combining logs with performance metrics such as Distributed Traces to provide a comprehensive understanding of your application's health.
Log data parsing prioritizes customer security by meticulously anonymizing Personally Identifiable Information (PII) data. Sensitive fields can be completely excluded during the parsing process, ensuring the privacy and compliance of customer information.
In PHP FPM Logs Monitoring, log pipelines are customizable workflows that allow users to filter, parse, and fine-tune log data based on specific criteria.
Log pipelines can be customized by using diverse filters and defining custom parsing rules. Users have the flexibility to configure pipelines to meet their specific monitoring requirements, ensuring that log data is processed and organized according to their preferences.
Yes, log pipelines can be configured to filter log data based on various attributes such as log source, severity, timestamp, or any custom field. This customization allows users to focus on specific aspects of log data that are most relevant to their monitoring goals.
Saved Views in PHP FPM Logs Monitoring enable you to create and save custom configurations for different troubleshooting scenarios. This feature simplifies collaboration, allows for quick context switching, and automates repetitive tasks, significantly improving overall efficiency.
If you exceed your log ingestion limits, we would contact you to discuss on stopping further processing new log data or upgrade your subscription.
You can choose to store logs in Atatus for a limited time (e.g., 7 days) or export them to external storage solutions like Amazon S3 for long-term retention.
To access historical log data beyond the retention period, you can rely on log data exports from Amazon S3, where you can push the logs into Atatus for further analysis.
Yes, Atatus provides users with the flexibility to customize log retention settings. Users can adjust retention periods based on their specific needs, aligning with compliance standards or internal data management policies.


