An AI SRE is software that takes on the first part of an incident investigation. It groups the alerts one failure sets off, reads the metrics, traces, logs and recent changes around them, and proposes a likely root cause with the evidence behind it and a way to confirm it. It doesn't replace the on-call engineer. What it returns is a hypothesis, and a person still decides whether it's right and what to do about it.
That makes the useful questions practical ones: what an AI SRE needs to see, where it tends to go wrong, and how to check its answer quickly. This guide covers each of them, how much access to give one, and how Atatus AI SRE handles them.
Table of Contents
- What an AI SRE does during an incident
- What an AI SRE needs to see
- Where AI root cause analysis goes wrong
- How to check an AI root cause before you act on it
- How much access to give an AI SRE
- How Atatus AI SRE works
- How to tell whether it's helping
- An AI SRE checklist
- Frequently asked questions
What an AI SRE does during an incident
Troubleshooting has a well-known shape. Google's SRE book describes it as a loop: given what you can observe, "we iteratively hypothesize potential causes for the failure and try to test those hypotheses" (Effective Troubleshooting). An AI SRE runs the same loop, with a language model doing the reasoning and your monitoring data as its tools:
- Group the alerts. One failure sets off alerts on several services and hosts. The AI SRE uses the service map and the timing to decide which belong to the same failure, so there is one thing to investigate instead of ten.
- Gather the context. For each affected service, host, database or pod, it pulls what an engineer would open next: metrics against their normal range, failing traces, slow queries, error logs, Kubernetes events and recent deploys.
- Form hypotheses. From that data it proposes possible causes, such as a slow query on a shared database, a deploy that introduced an error, or a node running out of memory.
- Test them against the data. It checks which explanation fits the timing and covers the symptoms, and queries for more data where the picture is incomplete.
- Report. It returns the most likely cause, the evidence for it, how confident it is, the alternatives it considered, and steps to confirm and fix it.
The engineer's job changes from collecting data across dashboards to judging an argument. That is faster when the argument is good, and the argument is only as good as the data behind it.
It doesn't change what comes first in an outage. The SRE book is blunt about it: "Stopping the bleeding should be your first priority; you aren't helping your users if the system dies while you're root-causing." Roll back, fail over or shed load first, and let the investigation run alongside.
What an AI SRE needs to see
An AI SRE can only reason about data it can query. Most weak answers trace back to a gap here, not to the model.
- Traces that cross services. Distributed traces show which service calls which. Without them, an AI SRE can see that two services are slow at the same time, but not which one is waiting on the other.
- Logs tied to requests. Logs that carry trace IDs can be read next to the request that wrote them. Logs, traces and metrics covers how the three fit together.
- Infrastructure mapped to services. Knowing that a service runs on a given host or pod lets it connect a CPU or memory problem to the requests it slows down.
- A normal range for each metric. "Response time is 400 ms" means little on its own. "Response time is four times its usual value" is evidence.
- A record of changes. Deploys, configuration changes and scaling events. The SRE book's advice applies to an AI too: "Recent changes to a system can be a productive place to start identifying what's going wrong."
- Detection that means something. If rules fire on every short spike, the AI starts from noise. See alert fatigue for how to tune them.
Anything you don't monitor, such as a third-party API, a managed queue or the network between regions, shows up only as a symptom on the services that depend on it. An AI SRE can point at the edge of what it sees, but not past it.
Where AI root cause analysis goes wrong
- Correlation read as cause. The first metric to move isn't always the cause. It may be the first symptom of something that isn't monitored. In the SRE book's own case study, engineers chased a datastore call that rose with latency, until they found that requests for static files were slow too, which meant the correlation "was spurious".
- The recent deploy gets the blame. A deploy shortly before an incident is an easy suspect. Sometimes it's guilty, and sometimes it just happened to be there.
- Missing data reads as healthy. A service that stopped reporting can look quiet rather than broken. Check that the data an analysis relied on was actually arriving.
- A fluent story with thin evidence. Language models write convincing explanations. A well-written paragraph isn't evidence. The data it points to is.
- One cause where there are several. Real failures often have more than one contributing factor. The SRE book warns that there may be "multiple factors, each of which individually is not the cause, but which taken jointly are causes."
- Problems with no signal. A pricing bug or a wrong business rule can break things for users without moving any metric. No AI SRE finds what the telemetry doesn't show.
How to check an AI root cause before you act on it
Treat the answer like a root cause from a teammate who was in a hurry: probably useful, and worth a few minutes of checking. These checks are quicker than doing the investigation yourself.
- Open the evidence. Every claim should point to something you can open: a trace, a query, a log line or a metric chart. A claim with nothing behind it is a guess.
- Check the order of events. The cause should change before the symptoms do. If the "cause" moved after the errors started, it is more likely a symptom.
- Check that it explains every symptom. A slow query explains slow checkout requests. It doesn't explain a spike in 401 errors on login. Symptoms left over point to a second cause, or a different one.
- Read the alternatives. A good analysis says what else it considered and why it ruled it out. If an alternative was dismissed for a weak reason, check it yourself.
- Run a test that could prove it wrong. Run
EXPLAINon the suspected query (EXPLAIN ANALYZEreally runs the statement, so wrap any write in a transaction you roll back), read the previous logs of a restarted pod, compare a slow host with its healthy neighbors, or roll back on one instance. The SRE book notes that "Some tests may not be definitive, only suggestive", so know which kind you ran. - Read confidence as the model's own estimate. A confidence score says how sure the analysis is, not how often it is right. It becomes useful once you compare it with how past analyses turned out.
- Re-run when you learn more. Add what you found, such as "the deploy was rolled back at 14:10 and errors continued", and run the analysis again. New facts should change the answer.
After the incident, record whether the AI was right. That record tells you how far to trust it next time.
How much access to give an AI SRE
AI SREs come with different levels of autonomy:
- Investigate only: it reads monitoring data and reports. Nothing changes in production.
- Suggest: it proposes a fix, and a person applies it.
- Act with approval: it can run actions such as a restart or a rollback after someone approves each one.
- Act on its own: it runs actions without asking.
Start with investigation only. Move up a level only for actions that are safe to repeat and easy to undo, and only once you have a record of the AI being right. Before you connect one, also ask:
- Which data is sent to the language model provider, and is it kept or used for training? Error messages, SQL statements and log lines can contain personal data.
- Can you use your own model provider account?
- Who on your team can read the analyses?
- Is every analysis and action recorded?
- Is there a limit on how often it runs, and what does each run cost?
How Atatus AI SRE works
Atatus AI SRE is in early access and isn't on for every account yet. Ask the Atatus team to turn it on for yours.
It has two parts. Problems detects and groups related issues and picks the root cause without AI. AI Analysis is an investigation you run on a Problem, with a language model doing the reasoning.
Problems: related issues grouped, root cause tagged
Once detection is on, Problems runs a built-in set of detection rules on your APM, browser, infrastructure and Kubernetes data. They are listed on the Problem Policies tab under Alerting, where you can turn each rule on or off, adjust it, or reset it to its default. Detection is off by default: until you tick the Detection checkbox on that tab, no Problems are raised. These rules are separate from your own alert policies.
When rules fire on connected entities, such as a service and the service it calls, or a pod and the node it runs on, and their issues open within 10 minutes of each other, Atatus groups them into one Problem. It scores each affected entity, mainly on how many of the other affected entities depend on it and how early its issues opened, and tags the issues on the top entity as the root cause and the rest as symptoms. When one entity clearly leads, the Detected Root Cause panel shows it with a confidence percentage. When none does, the Problems list shows the root cause as Analyzing or Inconclusive. A Problem on a single entity stays at Analyzing.
The Problems list shows each Problem's impact, severity, status, affected entities, root cause, duration and when it was detected. From a Problem you can acknowledge, resolve or re-open it, and leave comments for the rest of the team. A Problem resolves on its own when all its issues close. The Problems docs explain each field.
AI Analysis: an investigation you can check
When the cause isn't clear, or you want the reasoning behind it, click AI Analysis on the Problem. It runs only when you ask. It hands the work to the specialists that match the Problem's entities, for APM, infrastructure, databases and Kubernetes, and each one uses a language model to query Atatus data much as an engineer would:
- APM: service health, transactions and their spans, deploy markers, error trends, failed traces, database calls and runtime metrics.
- Logs: error-log patterns for the affected services.
- Infrastructure: host health, top processes, disk I/O and host metrics.
- Databases: when the Problem includes a database, query statistics, slow queries, execution plans, query samples and deadlocks from database monitoring.
- Kubernetes: pod failures, events, nodes, workloads, pending pods and volumes.
- Topology: which services call each other and where they run.
It only reads data. It doesn't restart services, roll back deploys or edit code, and it doesn't read your source code.
The result is laid out for the checks above. The Primary tab gives the root cause with a status, such as Likely, and a confidence percentage, the AI reasoning, and each piece of evidence with its type, its source and its own confidence. Below that are validation tests to confirm the cause yourself, the other possibilities it considered, and a recommended action. When the evidence is too thin, it titles the result "Unable to determine root cause" instead of presenting a guess as the cause.
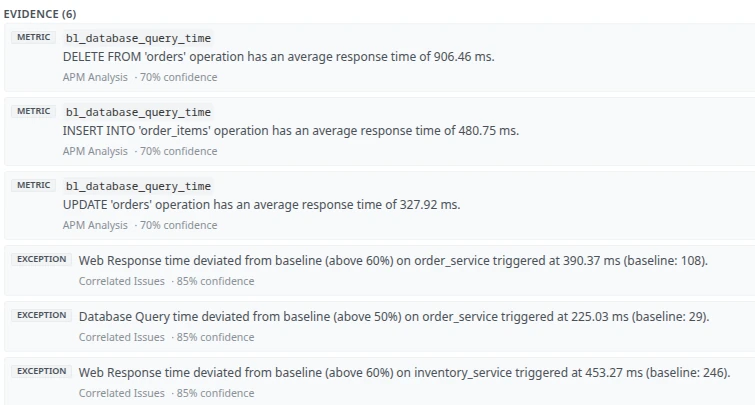
The other tabs fill in the rest. Contributing lists secondary factors with their weight, Alternatives shows the hypotheses it rejected or is still investigating, and Prevention suggests longer-term changes. The Action plan turns the recommended action and the most urgent prevention steps into a checklist of Critical and High steps. Your team can add its own steps at any priority and mark steps as done.
Until Problems confirms a root cause on its own, the Detected Root Cause panel shows the AI's conclusion labeled as the current best hypothesis, so nobody mistakes it for a confirmed cause.
When you learn something new, click Re-analyze inside the AI Analysis panel and add it as context, for example "the 14:00 deploy was rolled back and errors continued". The Re-analyze button in the page header runs it again without context. Each run is saved as a version labeled with the model and provider behind it, and the steps your team added to the action plan carry over. Mark each run as helpful or not helpful, with an optional note on what was wrong. The AI Root Cause Analysis docs walk through each tab.
AI Analysis runs on a model Atatus provides, within a monthly limit. Account owners and admins can add their own provider key under Settings, in LLM Keys, and mark it as primary, so analyses run on their own provider account and don't count toward that limit. A primary key has no fallback, so pick a model your provider still offers. The list doesn't include current Anthropic or Gemini models yet, so keys for those providers won't work for now.
Investigate from your own AI assistant
If your team already works with an AI coding assistant, the Atatus MCP Server connects it to the same monitoring data. Assistants that support the Model Context Protocol, such as Claude Code, Cursor, VS Code and Codex CLI, can call tools like diagnose_service, get_recent_deployments, correlate_deploy_with_incident, analyze_logs and get_kubernetes_events while you investigate from your editor. All but one of its tools only read data. Problems and alert incidents aren't available through it yet. See Introducing the Atatus MCP Server.
Getting started
- Ask for access. Ask the Atatus team to turn on Atatus AI SRE for your account.
- Connect your services. Install APM agents with tracing turned on, using the Enable Tracing option in the setup steps, so traces show which services call which, the Infrastructure Agent on your hosts, and the Atatus Helm chart on your Kubernetes clusters, so Problems can link issues across them. PHP has no tracing option, so install the One Agent on those hosts to show their calls.
- Turn on detection. On the Problem Policies tab under Alerting, tick the Detection checkbox, which is off by default, then turn off or adjust rules that don't fit your services.
- Work from the Problems page during an incident, and run AI Analysis when the cause isn't obvious.
- Check the answer against its evidence, validation tests and alternatives, then mark whether it helped.
How to tell whether it's helping
- Time from the first alert to a confirmed cause. It is the part of MTTR an AI SRE most directly shortens. Compare incidents where the team used it with those where it didn't.
- How often it was right. Keep your own log of each analysis, whether it held up, and why it missed: missing data, a wrong guess, or a cause outside what it can see. Atatus saves helpful and not-helpful marks, but doesn't report on them yet.
- Problems per failure. One failure should open one Problem, not several.
- Incidents users report first. If users or support still notice outages before monitoring does, the gap is in detection, not in analysis.
An AI SRE checklist
- Services are traced end to end, logs carry trace IDs, and hosts and pods are mapped to the services they run.
- Deploys and configuration changes are recorded where the AI SRE can see them.
- Detection rules are tuned so one failure opens one Problem.
- Mitigation comes first, and the investigation runs alongside it.
- Every root cause is checked against its evidence, the order of events, the alternatives and a test before anyone acts on it.
- The AI SRE only investigates until it has a record of being right.
- You know which data goes to the model provider and who can read the analyses.
- Each analysis is recorded as right or wrong, and the misses are reviewed.
Frequently asked questions
What is an AI SRE?
An AI SRE is software that investigates production incidents the way an on-call engineer would. It groups related alerts, queries metrics, traces, logs and recent changes, and proposes a likely root cause with evidence, a confidence level and steps to confirm and fix it. A person checks the answer and decides what to do.
Will an AI SRE replace site reliability engineers?
No. It takes over the slow part of an investigation, gathering and correlating data, but someone still has to judge the answer, choose a fix and weigh the risk of changing production. SRE work beyond incidents, such as setting reliability targets, planning capacity and removing the causes of repeat incidents, stays with people.
What is the difference between an AI SRE and AIOps?
AIOps usually means machine learning applied to event and metric streams: grouping alerts, reducing noise and detecting anomalies. An AI SRE goes a step further and investigates. It queries your monitoring tools, forms and tests hypotheses, and explains its conclusion. Many AI SREs use AIOps-style correlation as their first step.
How accurate is AI root cause analysis?
It depends on the data more than on the model. With connected traces, logs, infrastructure data and change history, it has the best chance with common failures such as a slow query, a bad deploy or a crashing pod. Causes outside your telemetry, failures with several contributing factors and bugs that don't move any metric are much harder. Track how often your own analyses are right instead of relying on a vendor's figure.
Is it safe to give an AI SRE access to production?
Read-only access is the safe place to start: the AI SRE queries monitoring data and changes nothing. Before you connect one, find out which data is sent to the language model provider and whether it's kept. Allow actions such as restarts or rollbacks only with approval, and only once it has a track record.
Does Atatus AI SRE change anything in my systems?
No. AI Analysis only reads Atatus monitoring data. It doesn't restart services, roll back deploys or edit code. Fixes stay with your team, in the action plan.
Atatus AI SRE groups related issues into one Problem, tags the root cause, and runs AI Analysis with evidence, validation tests and an action plan your team can check. It's in early access, so ask the Atatus team to turn it on for your account. See the Problems docs, and Atatus Alerting for the alert rules and notifications you already use.