Prometheus Monitoring
Break down data silos and unlock deep observability across your infrastructure with Atatus. Monitor Prometheus metrics, logs, and traces in one platform. No need to manage complex Prometheus storage or dashboards manually.
Prometheus Self-Hosting Challenges
Without managed Prometheus, teams face these critical operational challenges:
Prometheus Scaling and Operational Overhead
Self-hosted Prometheus requires managing storage, scaling, high availability, and backups, consuming significant engineering time and infrastructure resources.
"As a DevOps engineer, I spend 2 days per month dealing with Prometheus storage issues, sharding, and federation instead of improving our applications."
Limited Long-Term Storage
Prometheus local storage is designed for short-term data (weeks), requiring complex remote storage solutions for long-term retention and analysis.
"As an SRE, we can only analyze the last 15 days of metrics in Prometheus, making it impossible to investigate issues that happened last month."
Lack of Multi-Tenancy and Access Control
Prometheus lacks native multi-tenancy, making it difficult to isolate metrics between teams or provide secure access to different user groups.
"As a platform lead, I have to run 5 separate Prometheus instances because we can't securely isolate metrics between teams in a single instance."
Query Performance Issues at Scale
PromQL queries become slow with large datasets and high cardinality metrics, impacting dashboard load times and alerting responsiveness.
"As a monitoring administrator, our Grafana dashboards take 30 seconds to load because Prometheus queries timeout with our growing metric volume."
Complex Federation and Cross-Cluster Queries
Querying metrics across multiple Prometheus instances requires complex federation setups, making global visibility and cross-region analysis difficult.
"As a global operations lead, I can't create a single dashboard showing metrics from all our regional Prometheus deployments without complex federation."
Alert Manager Configuration Complexity
Setting up Prometheus Alertmanager with proper routing, grouping, and silencing rules requires deep expertise and is error-prone.
"As a platform engineer, configuring Alertmanager YAML files is so complex that we've had production alerts silently failing for weeks due to configuration errors."
Managed Prometheus,
Zero Operational Overhead
Focus on monitoring your infrastructure, not managing Prometheus servers. Scale effortlessly with unified observability.
Reduced Operational Overhead
Eliminate the hassle of managing Prometheus servers—Atatus manages it all for you. Focus on scaling your infrastructure, not managing your monitoring stack.
Enhanced Observability
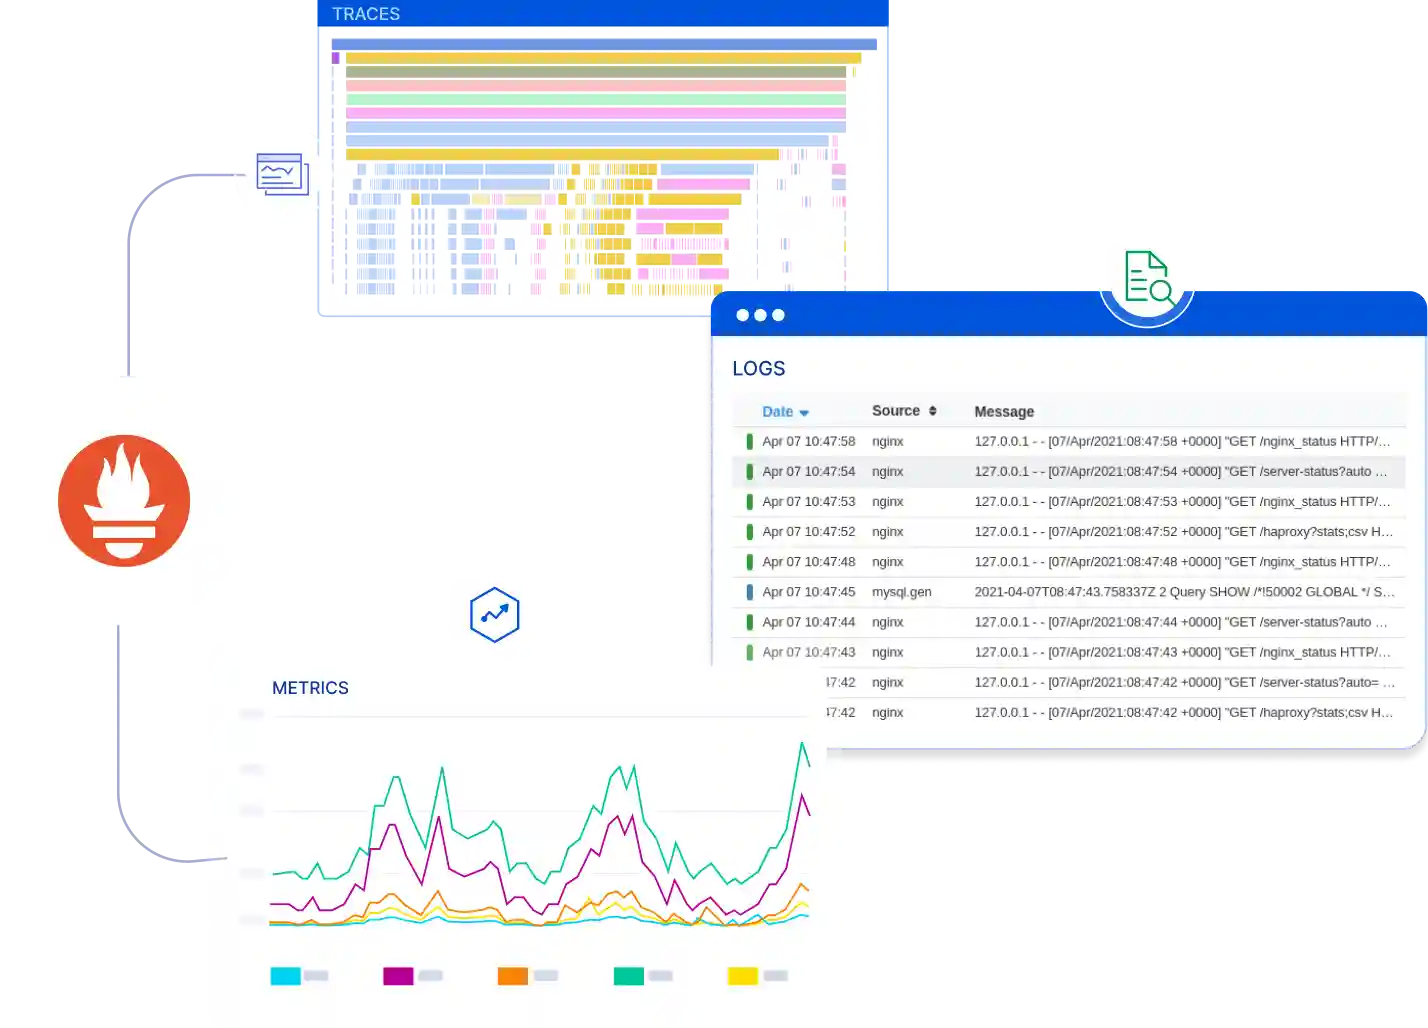
Get full-stack visibility with metrics, traces, and logs in one place. Atatus unifies your data for deep performance insights and faster troubleshooting.
Effortless Scalability
Monitor millions of metrics effortlessly—Atatus scales with your infrastructure. Built to handle large-scale environments with horizontal scaling and high availability.
How Atatus Managed Prometheus Eliminates Operational Overhead
Focus on monitoring, not managing Prometheus infrastructure
Fully Managed Prometheus
Atatus handles all Prometheus operations - storage, scaling, backups, and updates. Focus on monitoring your applications, not managing Prometheus infrastructure.
Unlimited Metric Retention
Store Prometheus metrics for years without complex remote storage setup. Query historical data seamlessly alongside recent metrics.
Built-in Multi-Tenancy
Native team isolation, role-based access control, and separate workspaces. Securely share metrics between teams while maintaining data boundaries.
Fast Query Performance
Optimized query engine handles high-cardinality metrics and complex PromQL queries instantly. Dashboards load in seconds, not minutes.
Global Metric Aggregation
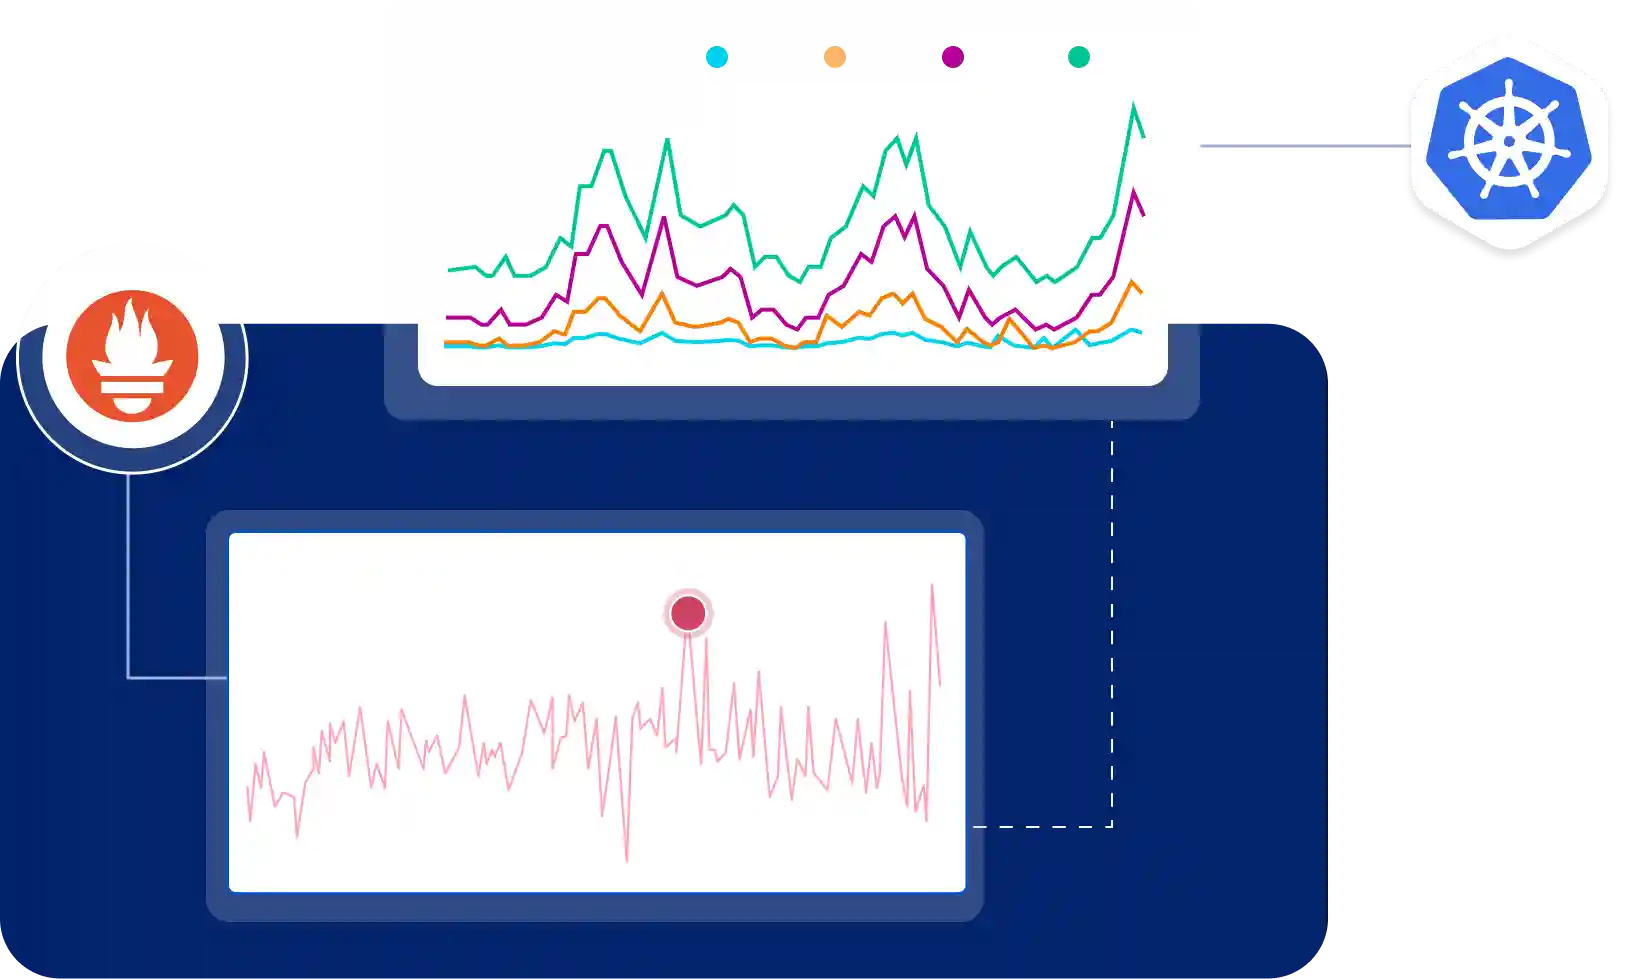
Query metrics across all your environments, regions, and clusters from a single unified view. No federation setup required.
Compatible with Prometheus Ecosystem
Full compatibility with Prometheus exporters, PromQL, Grafana, and alerting rules. Drop-in replacement for self-hosted Prometheus.
Everything You Need for
Prometheus Monitoring
Enterprise-grade Prometheus management with zero operational overhead
Seamless Prometheus Metric Ingestion
- Ingest Prometheus metrics directly from exporters and instrumented applications
- Centralize Prometheus data without manual reconfiguration or pipeline changes
- Collect consistent metrics from Prometheus targets alongside other telemetry signals
- View and analyze Prometheus metrics in the same context as traces and logs
Unified Cross-Tool Analysis
- Merge Prometheus metrics with traces, logs, and service data automatically
- Correlate container and application metrics with request-level traces
- Connect metrics and logs to understand failures and performance issues faster
- Gain a unified view of system behavior across applications and infrastructure
Flexible Querying and Alerting
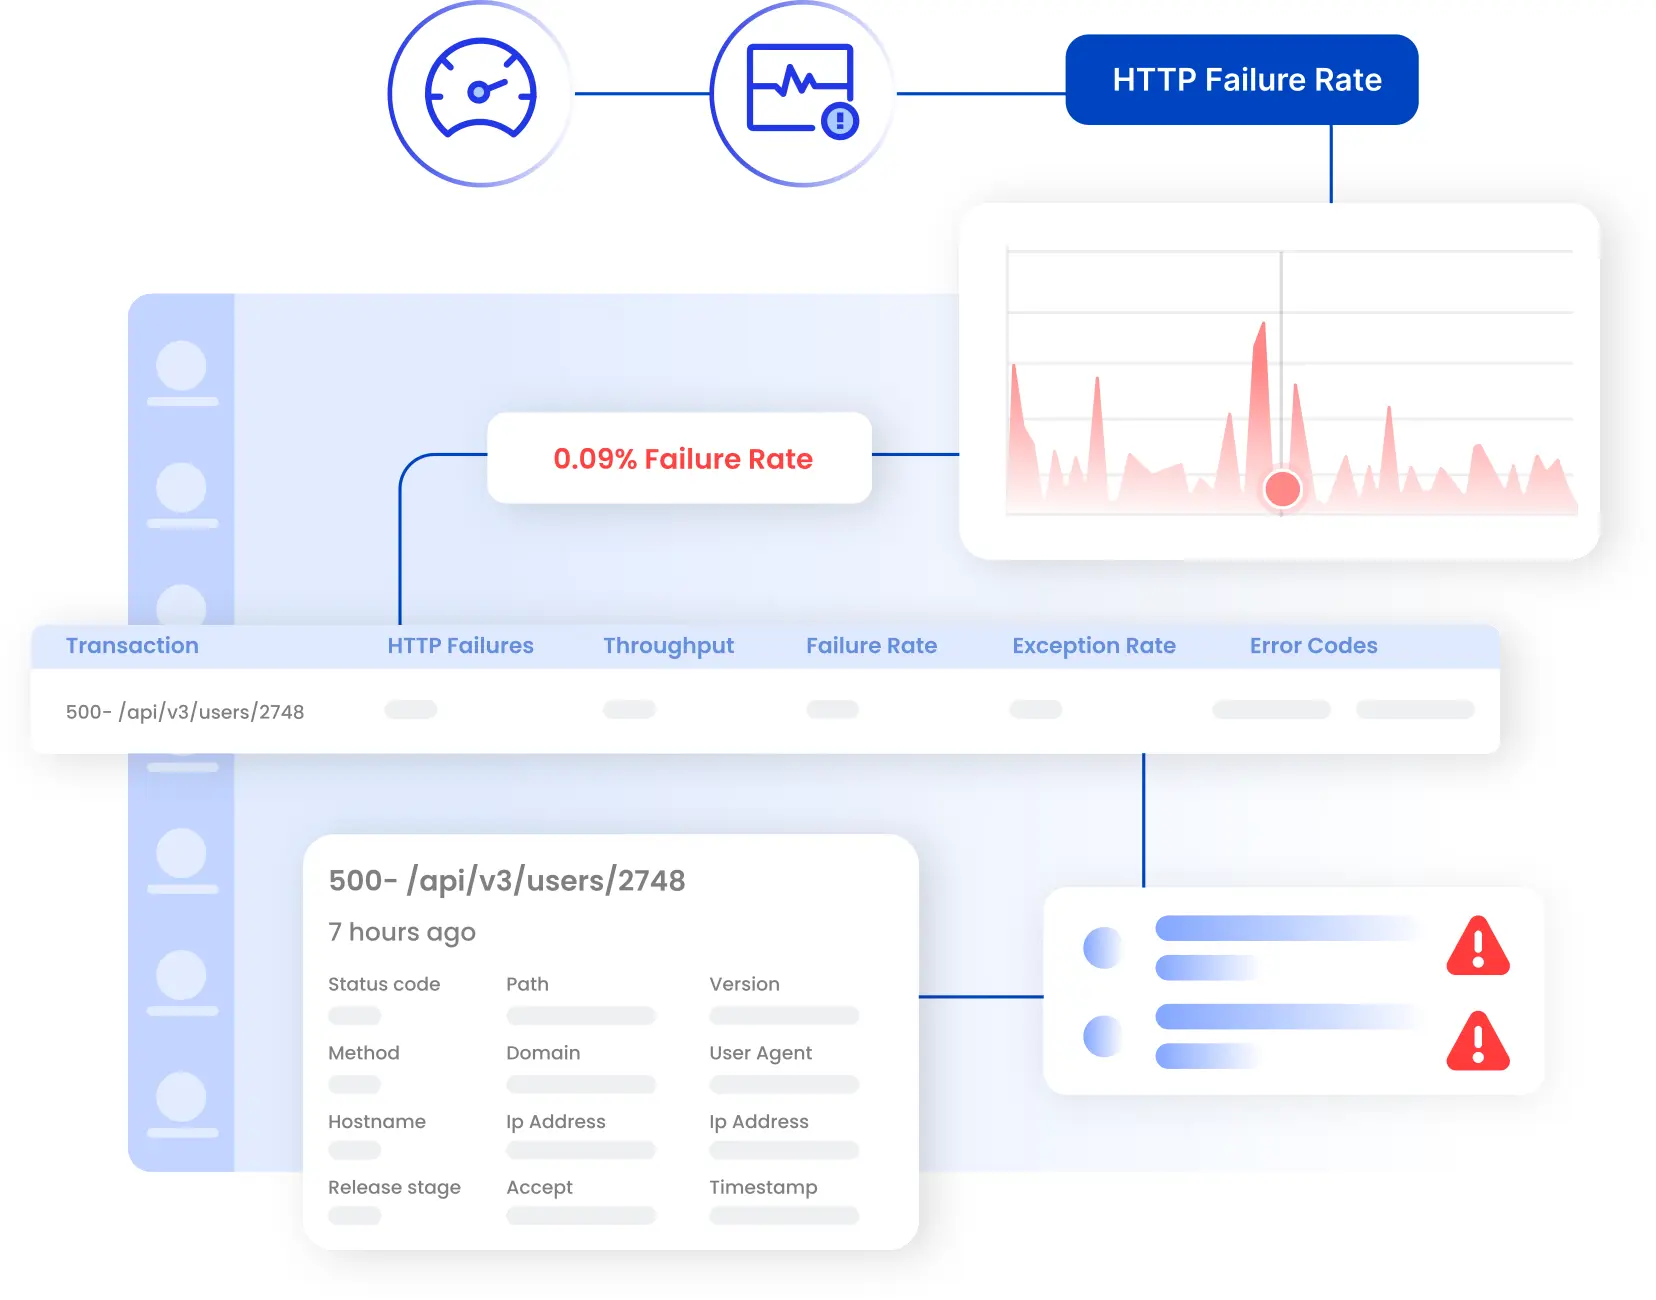
- Query Prometheus metrics with flexible filtering and grouping options
- Build dashboards and alerts directly from saved metric queries
- Monitor key indicators across services and environments continuously
- Get notified when critical metric patterns or thresholds appear
Managed Prometheus in 3 Simple Steps
Get enterprise-grade Prometheus monitoring without managing infrastructure. No credit card required.
Connect Your Prometheus Instance
Simply configure your Prometheus remote write to send metrics to Atatus. No complex setup or infrastructure changes required—start streaming metrics in minutes.
Auto-Discover & Collect Metrics
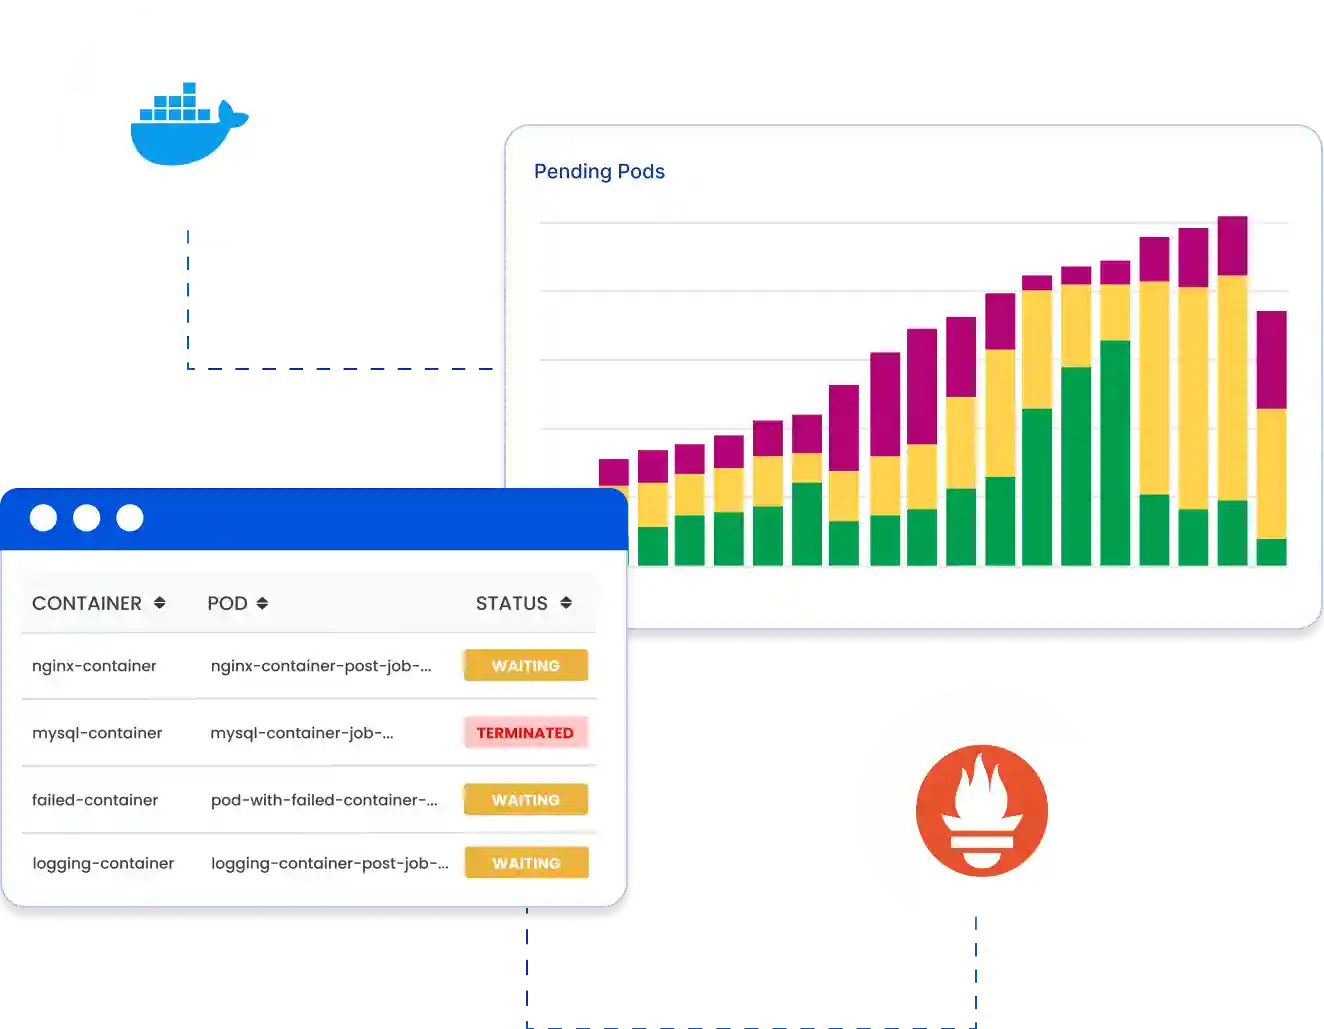
Atatus automatically discovers and collects metrics from your Prometheus-instrumented services. Monitor Redis, NGINX, Kubernetes, and more with zero manual configuration.
Monitor & Scale Effortlessly
Access pre-built dashboards for instant visibility. Set smart alerts based on thresholds or anomalies. Scale monitoring across millions of metrics without managing storage or infrastructure.