Your traces say “slow.”
Profiling says exactly why.
Atatus Continuous Profiling captures what your code is doing in production - function by function, line by line, so your engineers fix real bottlenecks, not guesses. Flame graphs from live traffic in under 5 minutes.
![]() 14-day free trial
14-day free trial
![]() Under 1% CPU overhead
Under 1% CPU overhead
![]() Works in production
Works in production
![]() Setup in 5 minutes
Setup in 5 minutes

13×
Faster API response after fixing profiler-surfaced bottleneck
Intelligence Fusion customer
<1%
Production CPU overhead - profiling runs always-on
Measured across Node.js, Java, Go
5 min
Average time to first flame graph after install
No code changes required
40%
Cloud cost reduction by right-sizing after profiling insights
Reported by customers 6mo post-adoption
Performance issues that hide in plain sight
Which function is actually slow
Tracing tells you a span took 3 seconds. Profiling tells youvalidate_cart()at line 142 calleddb.query()47 times when it should have called it once. That's the difference between a 2-hour debugging session and a 10-minute fix.
Whether a new deploy made things worse
Your monitoring says p99 latency went up after the release. But which service? Which function? Which commit? Profiling shows you a side-by-side function-level diff between v2.3 and v2.4 - so you know exactly what to roll back or fix.
Why your cloud bill keeps growing
You keep adding servers because the app is slow. But the app is slow because 3 functions are inefficient. Fixing those functions means you scale down, not up. Profiling shows you exactly which code is consuming the most CPU across your entire fleet.
Find the exact function
slowing your app before it hits all your users
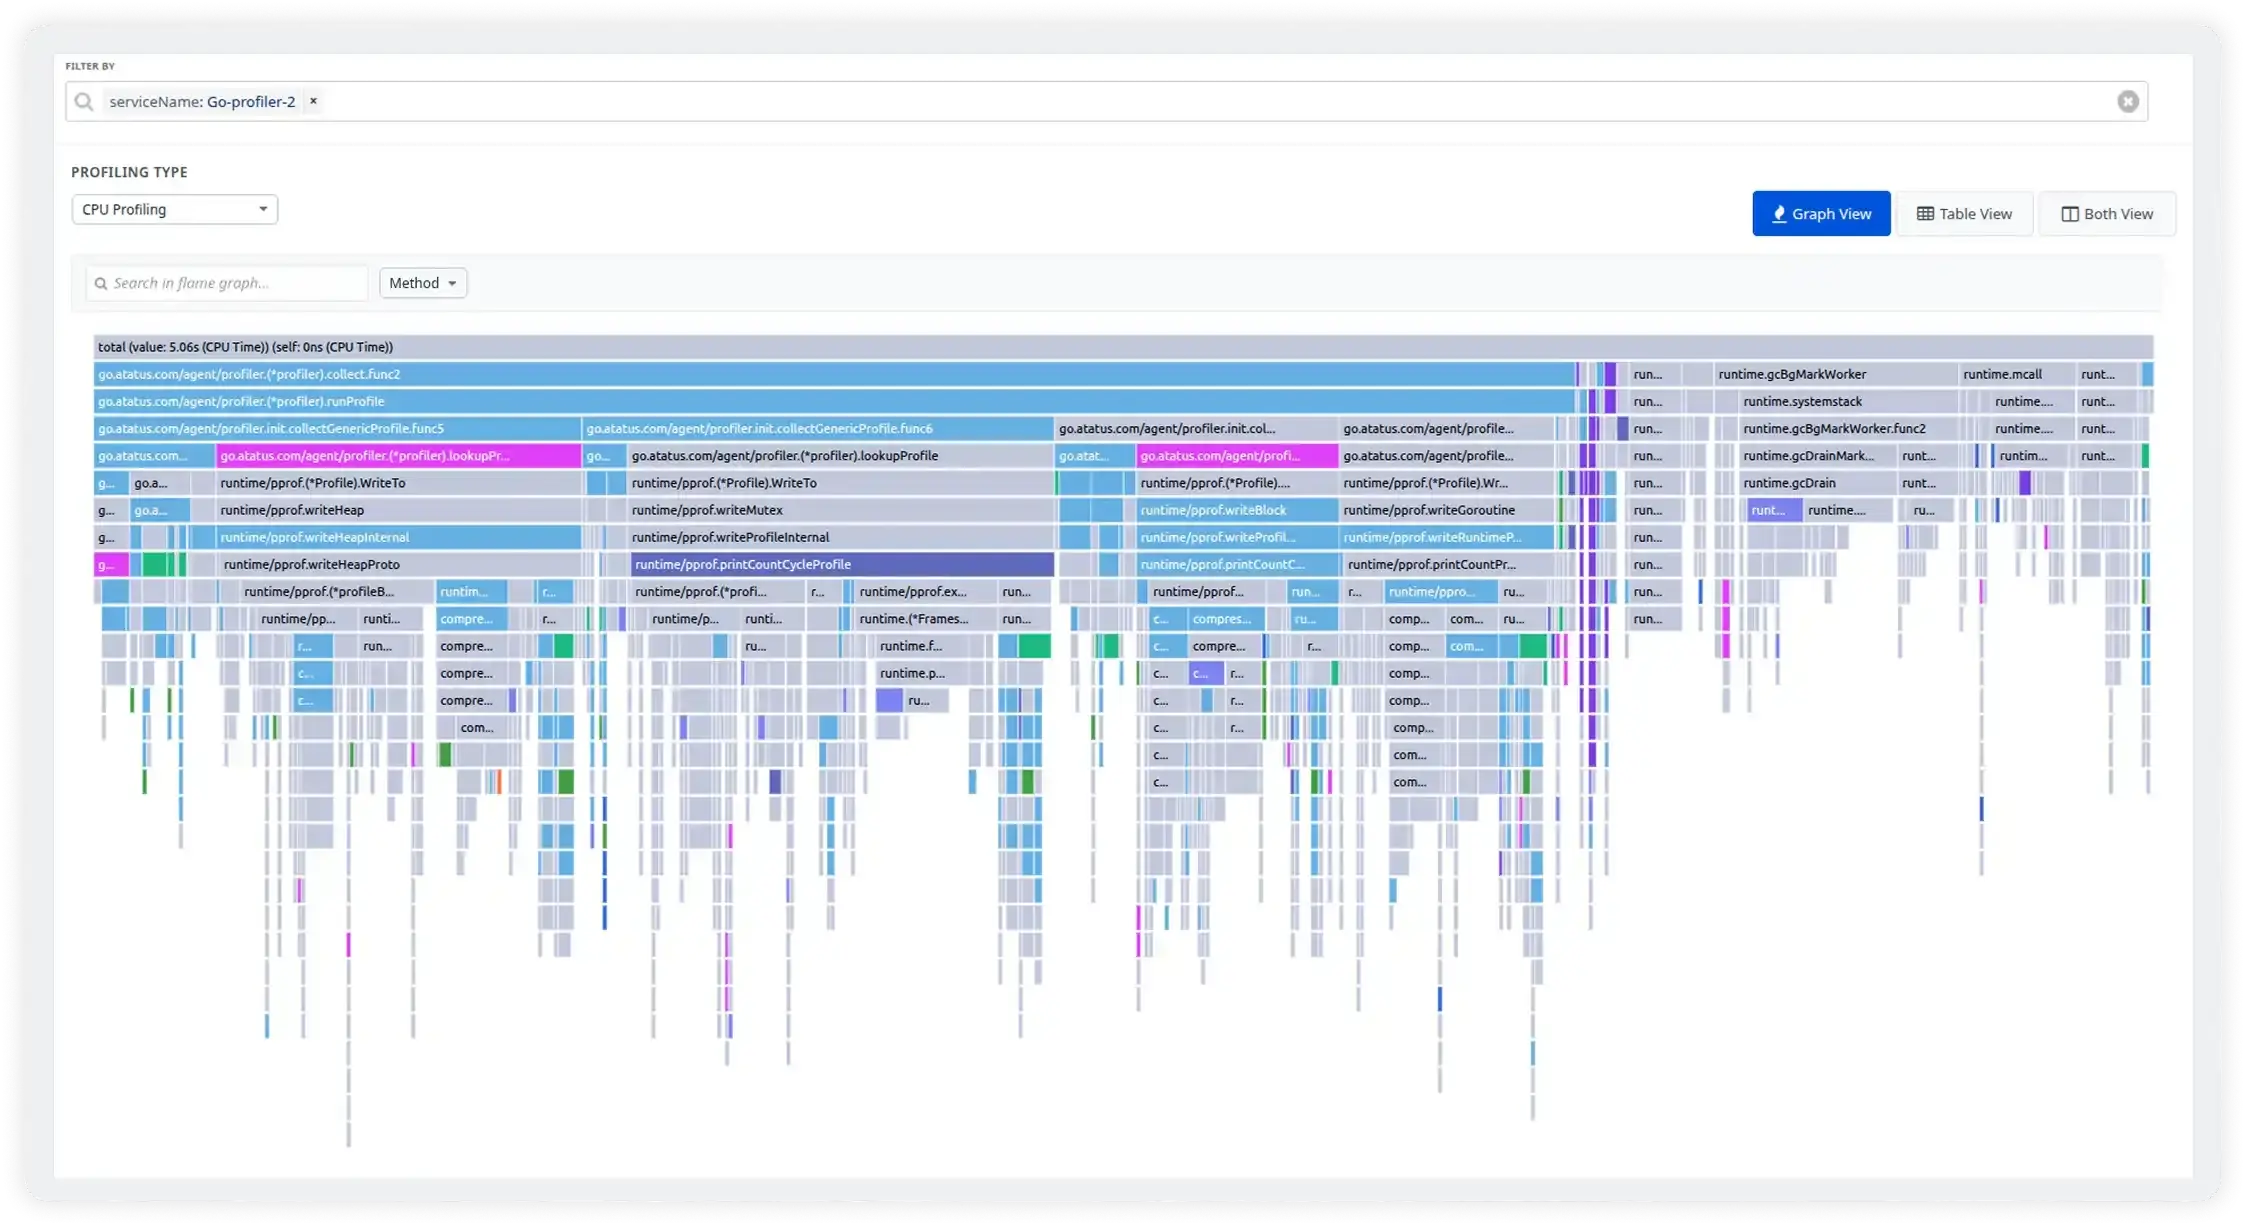
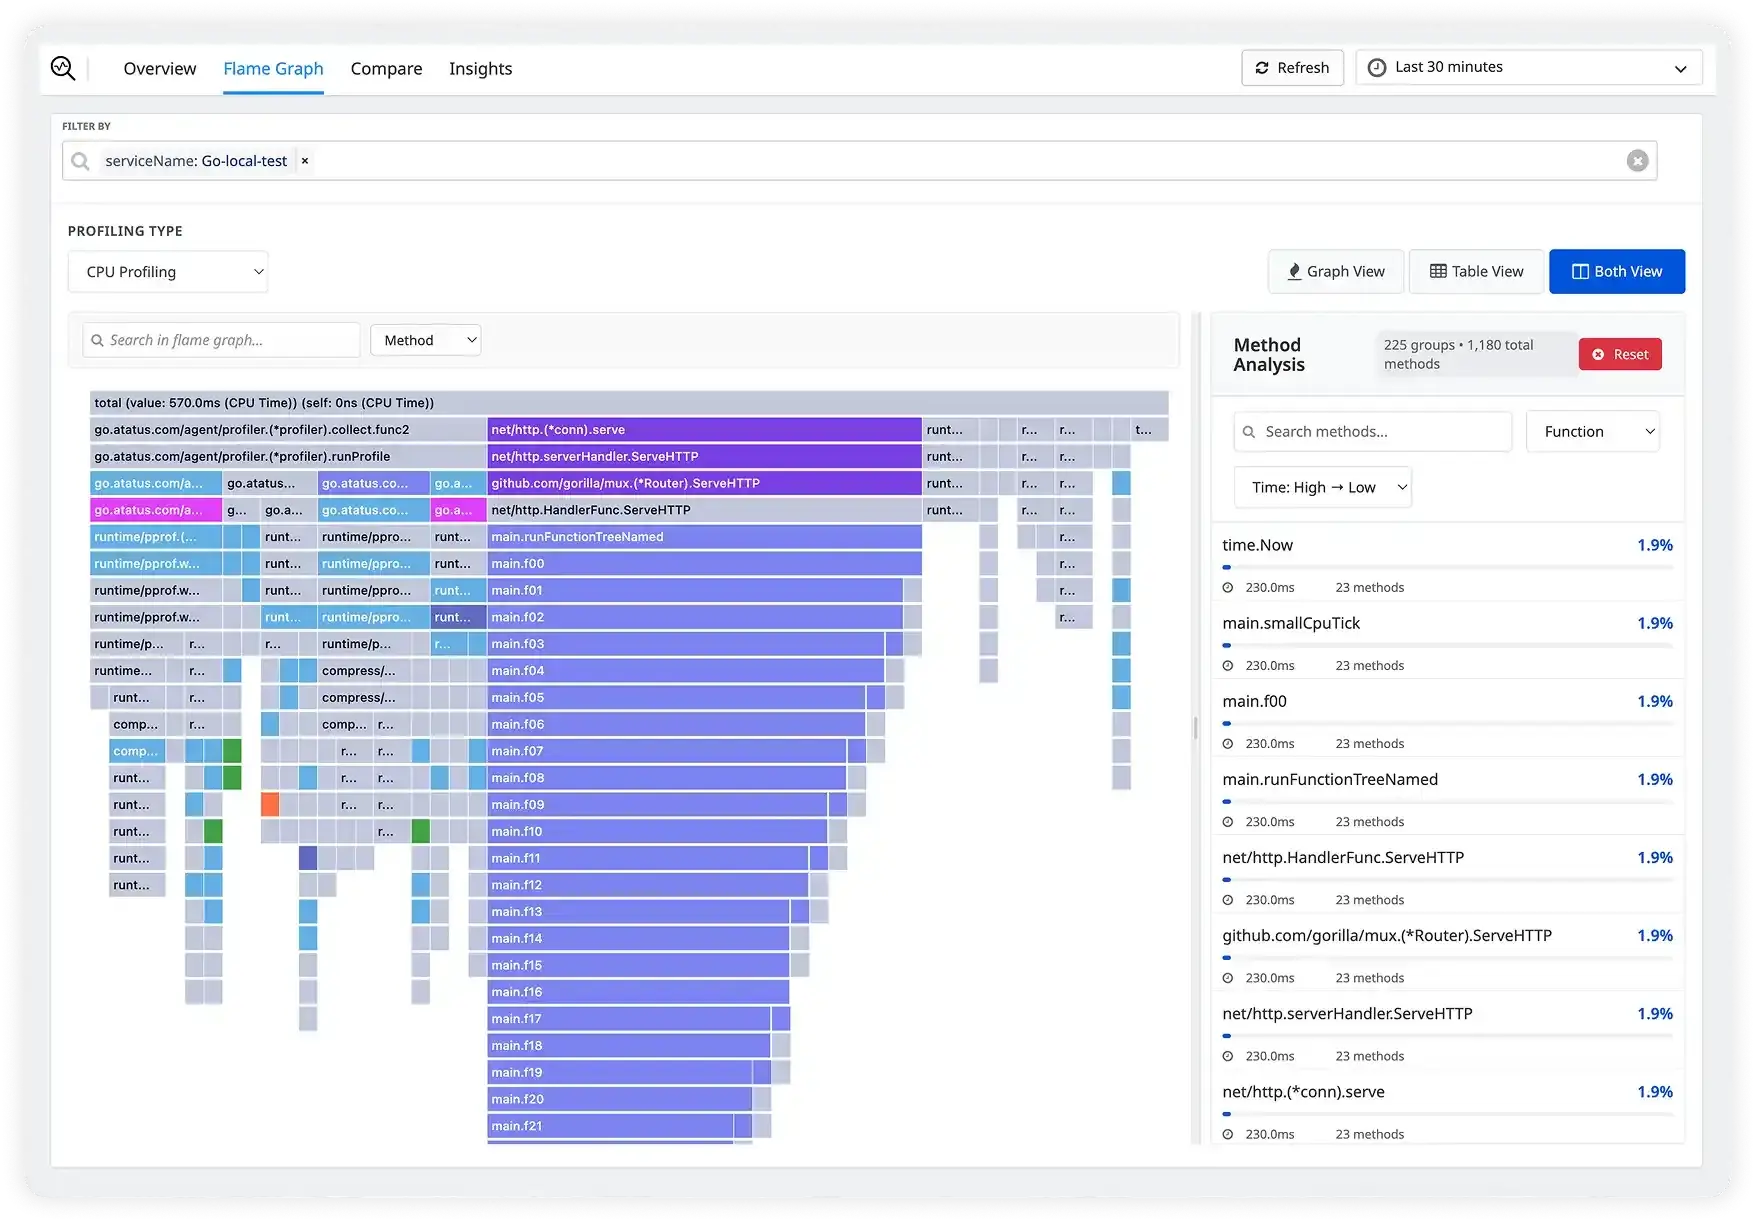
See exactly where your app spends every millisecond
Atatus samples your call stack every 10ms and builds an interactive flame graph. The widest bar is your biggest problem. Click it; Atatus takes you to the file and line number. No reproduction needed.
- CPU time, memory allocations, I/O waits, GC pauses, and lock contention per function
- Filter by service, endpoint, host, version, or any custom tag
- Automatic N+1 query detection with suggested consolidation
- Diff any two time ranges to isolate what changed
Slow trace? One click to the responsible function
Atatus automatically correlates every APM trace with profiling data. Click any slow span and see the exact flame graph for that request. Logs, traces, and profiles in one screen, at the same time.
- Profiling linked to every APM trace automatically, no extra config
- Thread-level visibility: CPU, lock wait, I/O, GC pauses inside any span
- Full OpenTelemetry compatibility; no vendor lock-in
- Correlate with logs at the same timestamp for full context

Know within minutes if your new deploy made things worse
Every deploy is automatically tagged. Compare profiling data side by side across any two versions and get alerted the instant a function starts consuming more CPU than before. Roll back with data, not instinct.
- Automatic version tagging with every deploy, zero configuration
- Function-level comparison across versions, time ranges, or canary groups
- Regression alerts before 100% of traffic hits a bad release
- Compare canary vs stable, blue vs green, or any custom segment
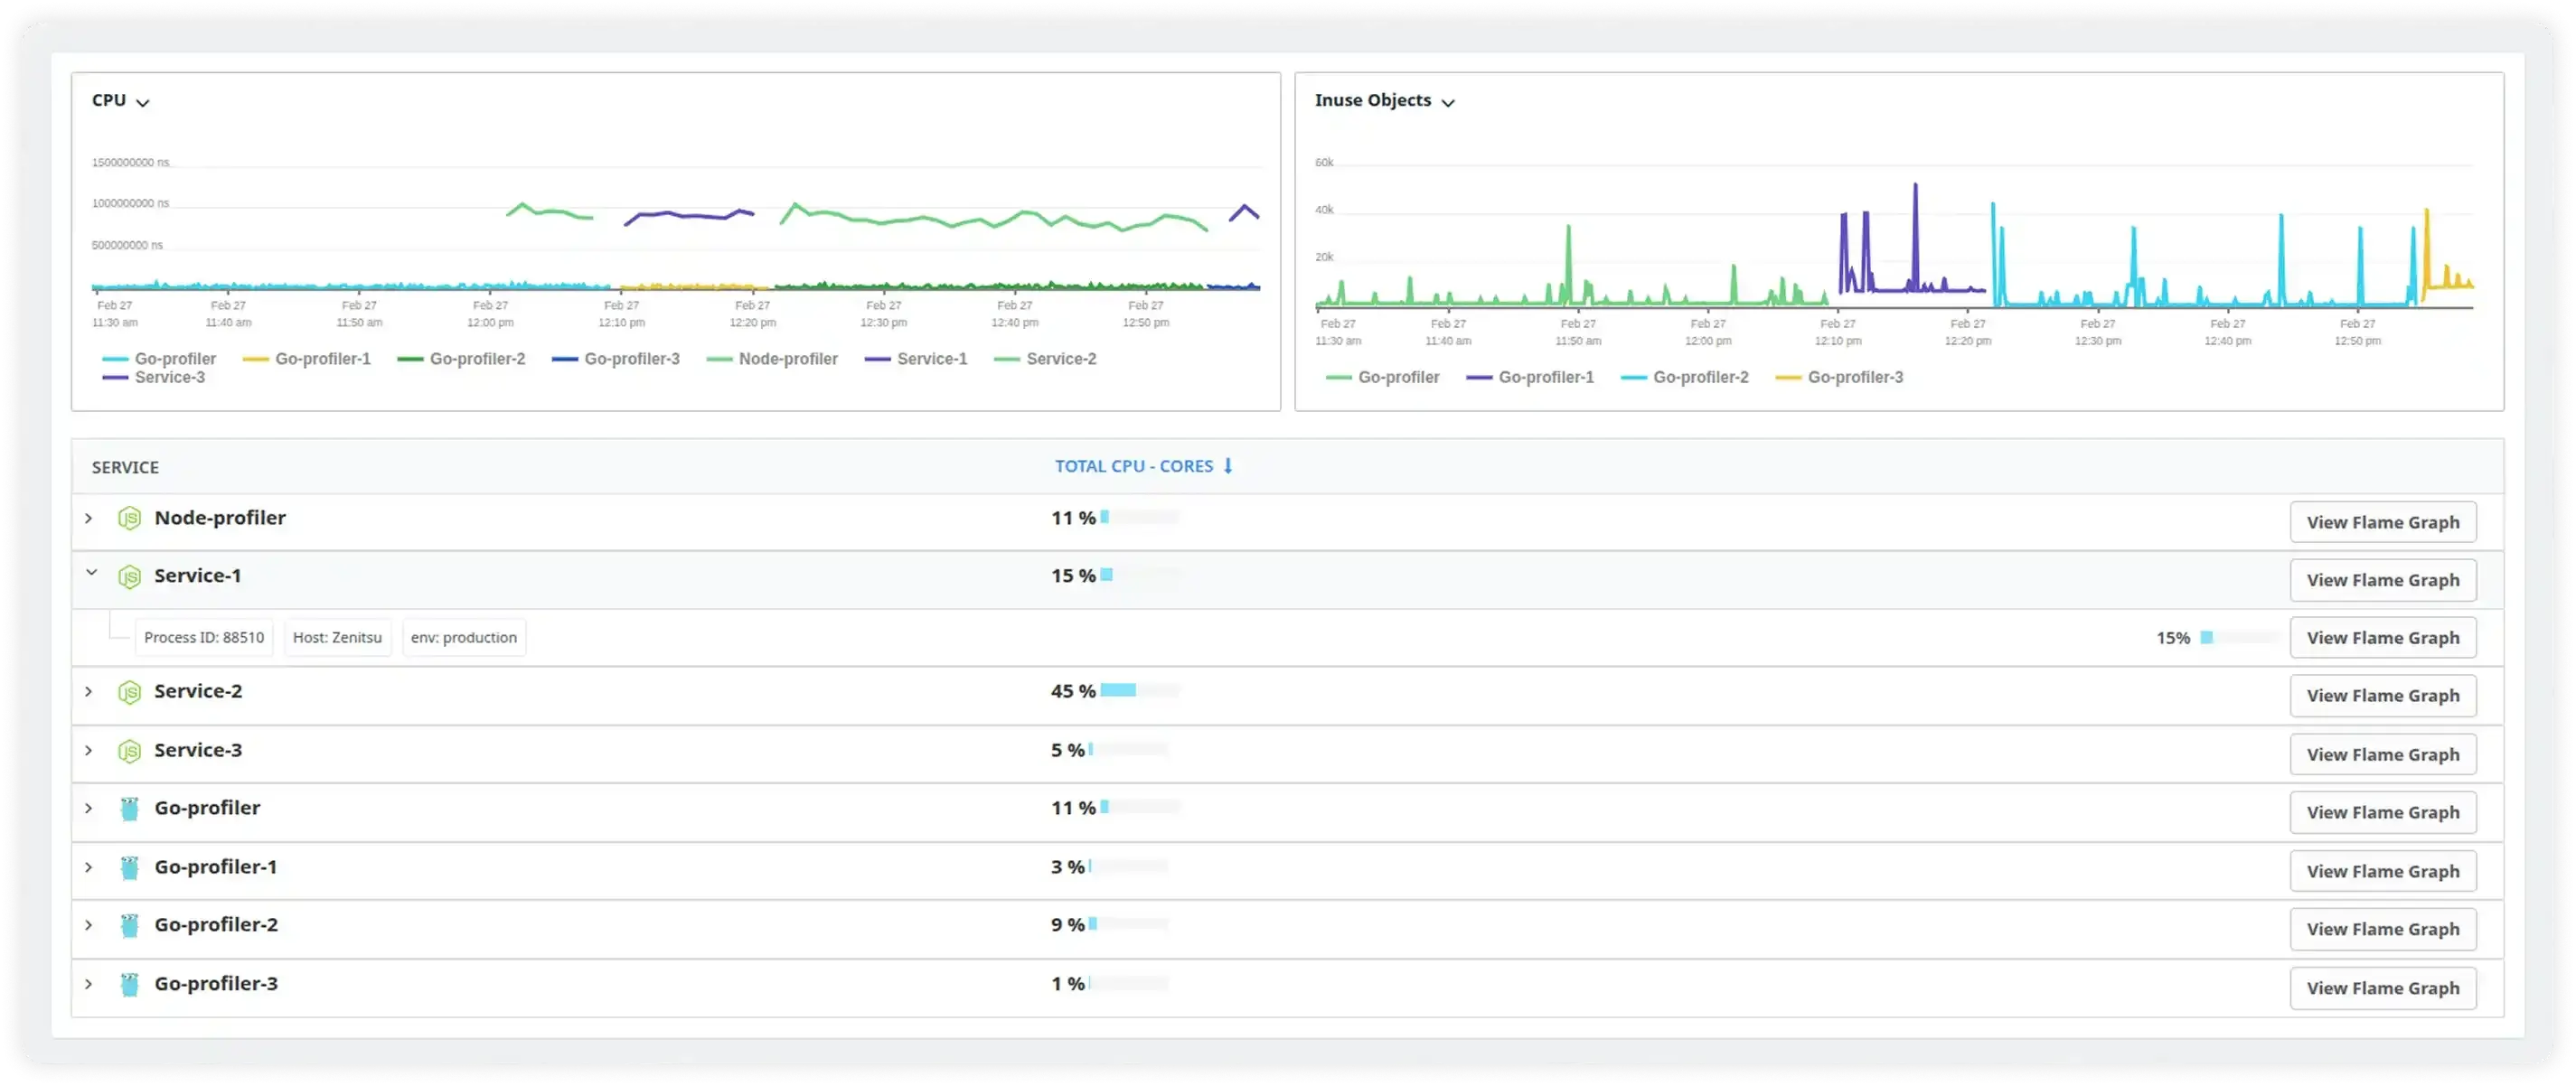
Fix the code. Shrink the servers. Reduce the bill.
When you don't know which code is expensive, you scale infrastructure to cope. Profiling shows you exactly which functions consume the most CPU, so you optimize the code, right-size servers, and reduce your AWS or GCP bill.
- CPU and memory attributed per service, endpoint, and function
- Fleet-wide view: the most expensive code across all your services
- Infrastructure downsizing recommendations based on actual data
- Track cost impact over time as optimizations land
Supported Languages & Runtimes
Atatus Continuous Profiling works with your entire stack
First flame graph in
under 5 minutes
No code changes to your application logic. Install the agent, set one flag, deploy profiling starts immediately.
Install the SDK
One package install. pip, npm, gem, or maven - your language, your choice.
Enable Profiling
Set profiling_enabled=True. No instrumentation in your app code needed.
Deploy to Production
Profiling starts immediately. Under 1% CPU overhead, no noticeable latency impact.
Find & Fix
Open the Atatus dashboard. See your flame graph. Identify the bottleneck. Fix it.
Every performance problem, solved at the source
Continuous profiling replaces guesswork with evidence for every kind of slowness your team encounters.
Slow API Endpoints
Don't just know a request took 4 seconds — know it was validate_cart.py:142 making 47 redundant database calls. Fix it once, permanently.
Memory Leaks
Track heap allocations over time. See which function is retaining objects it shouldn't. Catch leaks before they crash production with an OOM error.
N+1 Database Queries
Automatically surface N+1 query patterns that only appear under real production load. Get the exact call stack, the count, and a suggested fix.
Deployment Regressions
Know within minutes of a deploy whether new code introduced a performance regression. Roll back with confidence — backed by data, not instinct.
Background job performance
Profile your workers, queues, and cron jobs. Find out why that nightly job takes 4 hours when it should take 20 minutes.
Cloud Cost Reduction
Identify which services consume the most CPU relative to their workload. Optimize the code, right-size the servers, and reduce your AWS or GCP bill.
"Using Atatus Continuous Profiling, we identified an N+1 query pattern that was slowing our checkout by 3 seconds. After the fix, our API p99 latency dropped from 4.2s to 380ms and we decommissioned 4 EC2 instances."