Monitor 1000+ Microservices Without the Chaos
Enterprise-scale systems demand enterprise-grade observability. Unified monitoring across multi-cloud environments, SOC 2 compliant, with automated service discovery and intelligent alerting, so your teams can focus on innovation, not firefighting.
Common Challenges You Face
Real problems experienced by teams like yours every day
Multiple Teams, Fragmented Tools
"Each team uses different monitoring tools. We can't get a holistic view of system health or track dependencies across teams."
Compliance and Security Requirements
"We need SOC 2, HIPAA, and GDPR compliance, role-based access control, and audit logs, which most tools don't support properly."
High Cardinality Data Overwhelms Tools
"Our microservices generate millions of unique metric combinations. Most tools either crash or charge us insane amounts."
Multi-Cloud Complexity
"We run on AWS, Azure, and on-prem. Managing monitoring across environments is a nightmare with fragmented visibility."
Eliminate Downtime That Costs Your Business Millions
- Real User Monitoring provides complete visibility into customer experience across all regions and devices so you can proactively address performance issues before they impact revenue.
- Synthetic Monitoring continuously tests critical business transactions and API endpoints from multiple locations to detect outages before customers report them
- Intelligent Alerting reduces alert fatigue by 80% with ML-powered anomaly detection that notifies teams only when genuine issues require attention.
- Auto-Discovery automatically maps your entire application topology and dependencies so nothing falls through the monitoring gaps during rapid infrastructure changes.
Reduce Mean Time to Resolution by 70%
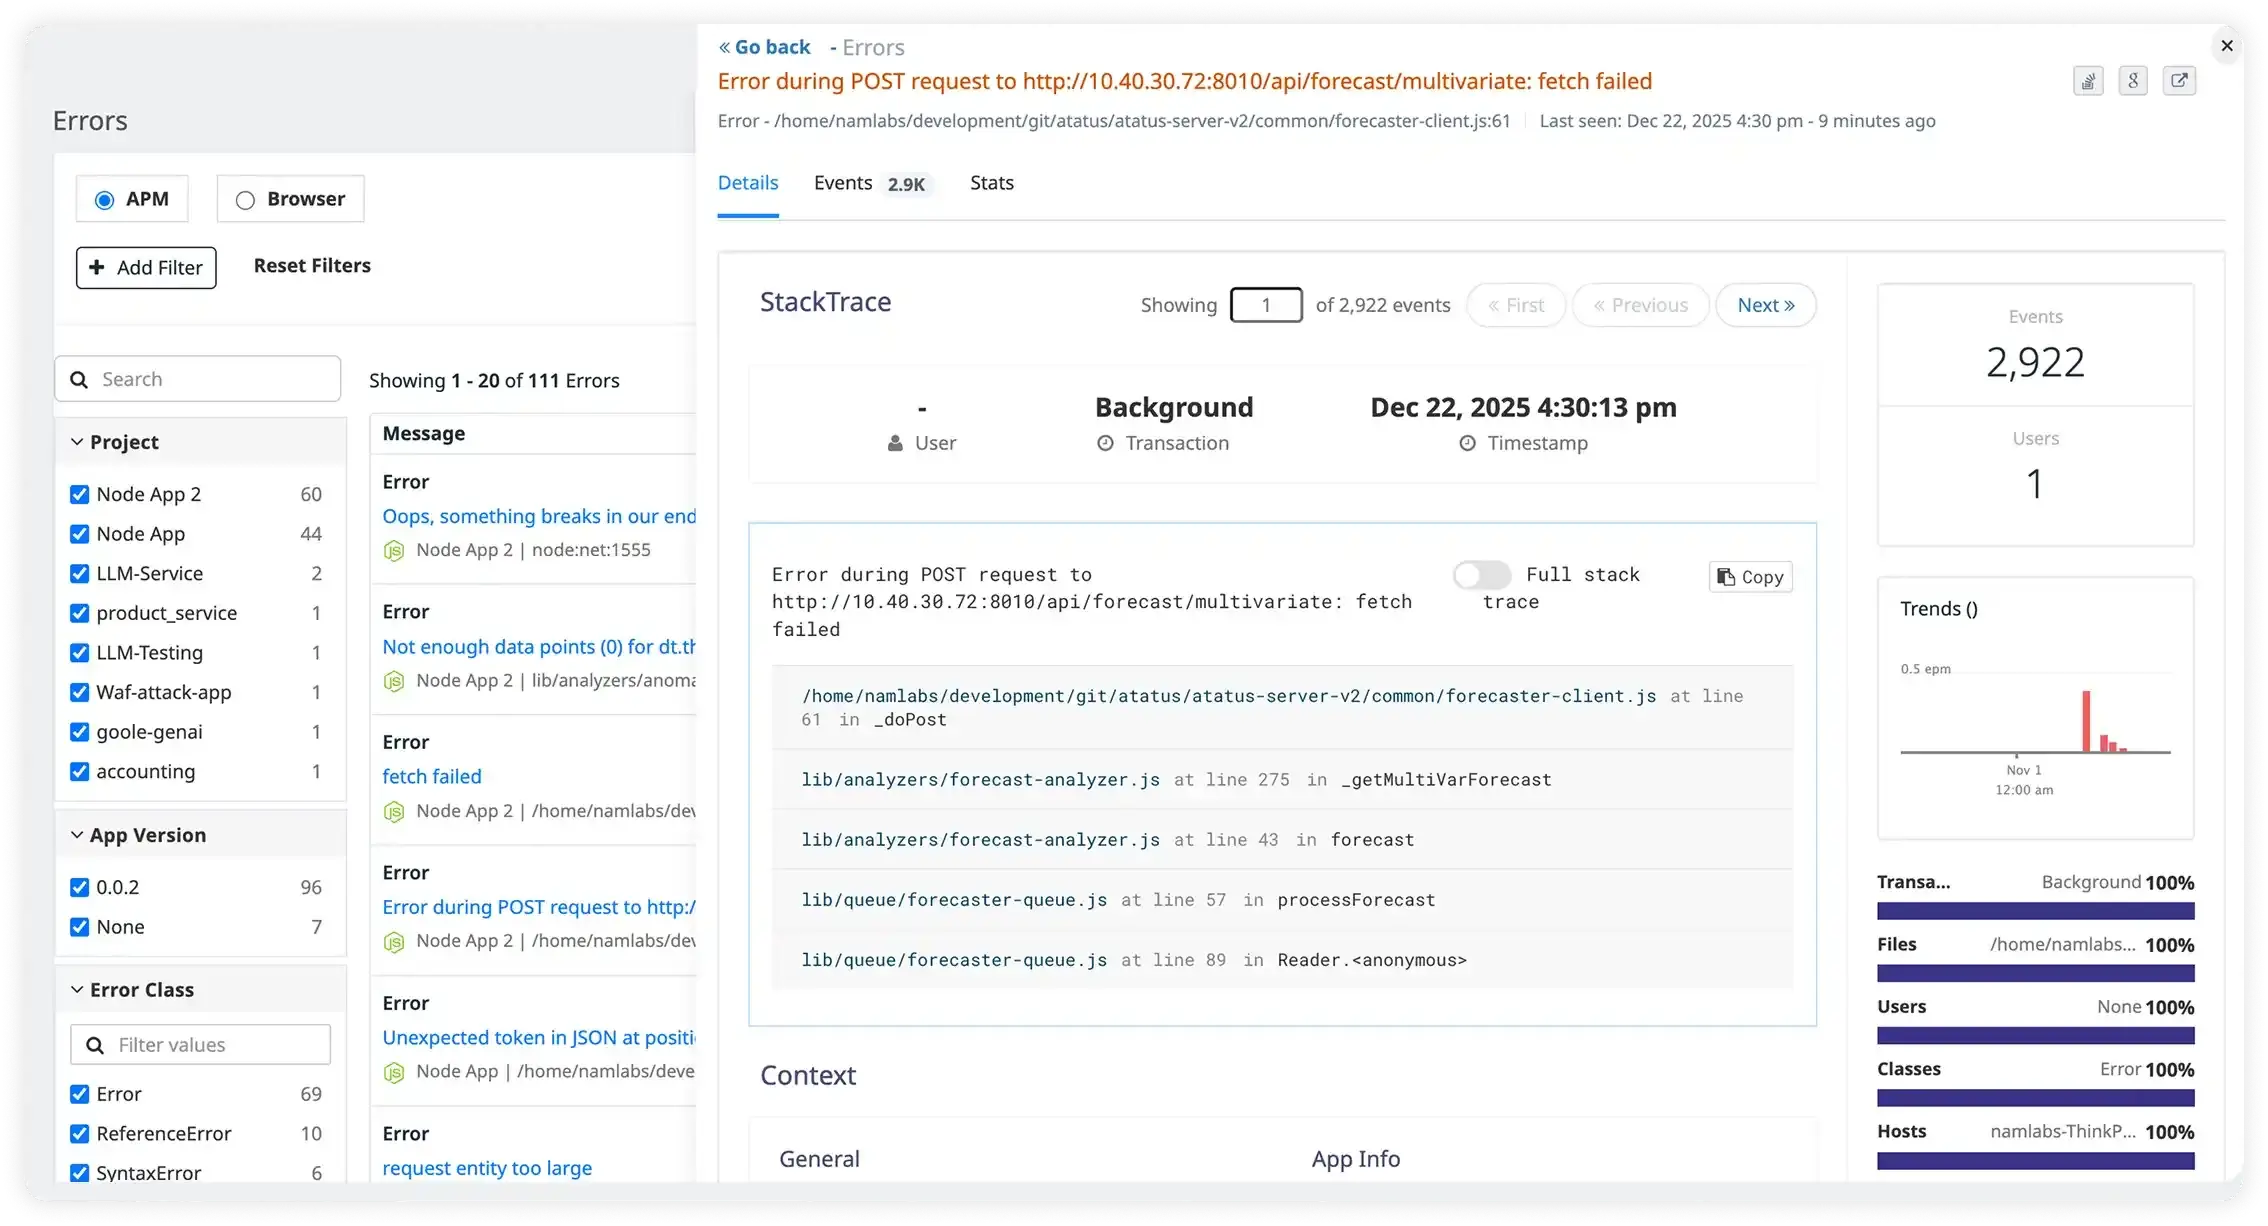
- Distributed Tracing eliminates hours of troubleshooting by showing the exact service, API call, or database query causing slowdowns in your microservices architecture.
- Root Cause Analysis correlates errors across frontend, backend, infrastructure, and third-party services to pinpoint issues in minutes instead of days.
- Session Replay lets your team see exactly what users experienced during errors, eliminating the need for customers to file detailed bug reports.
- Code-Level Diagnostics identifies the specific lines of code, SQL queries, or external API calls responsible for performance bottlenecks.
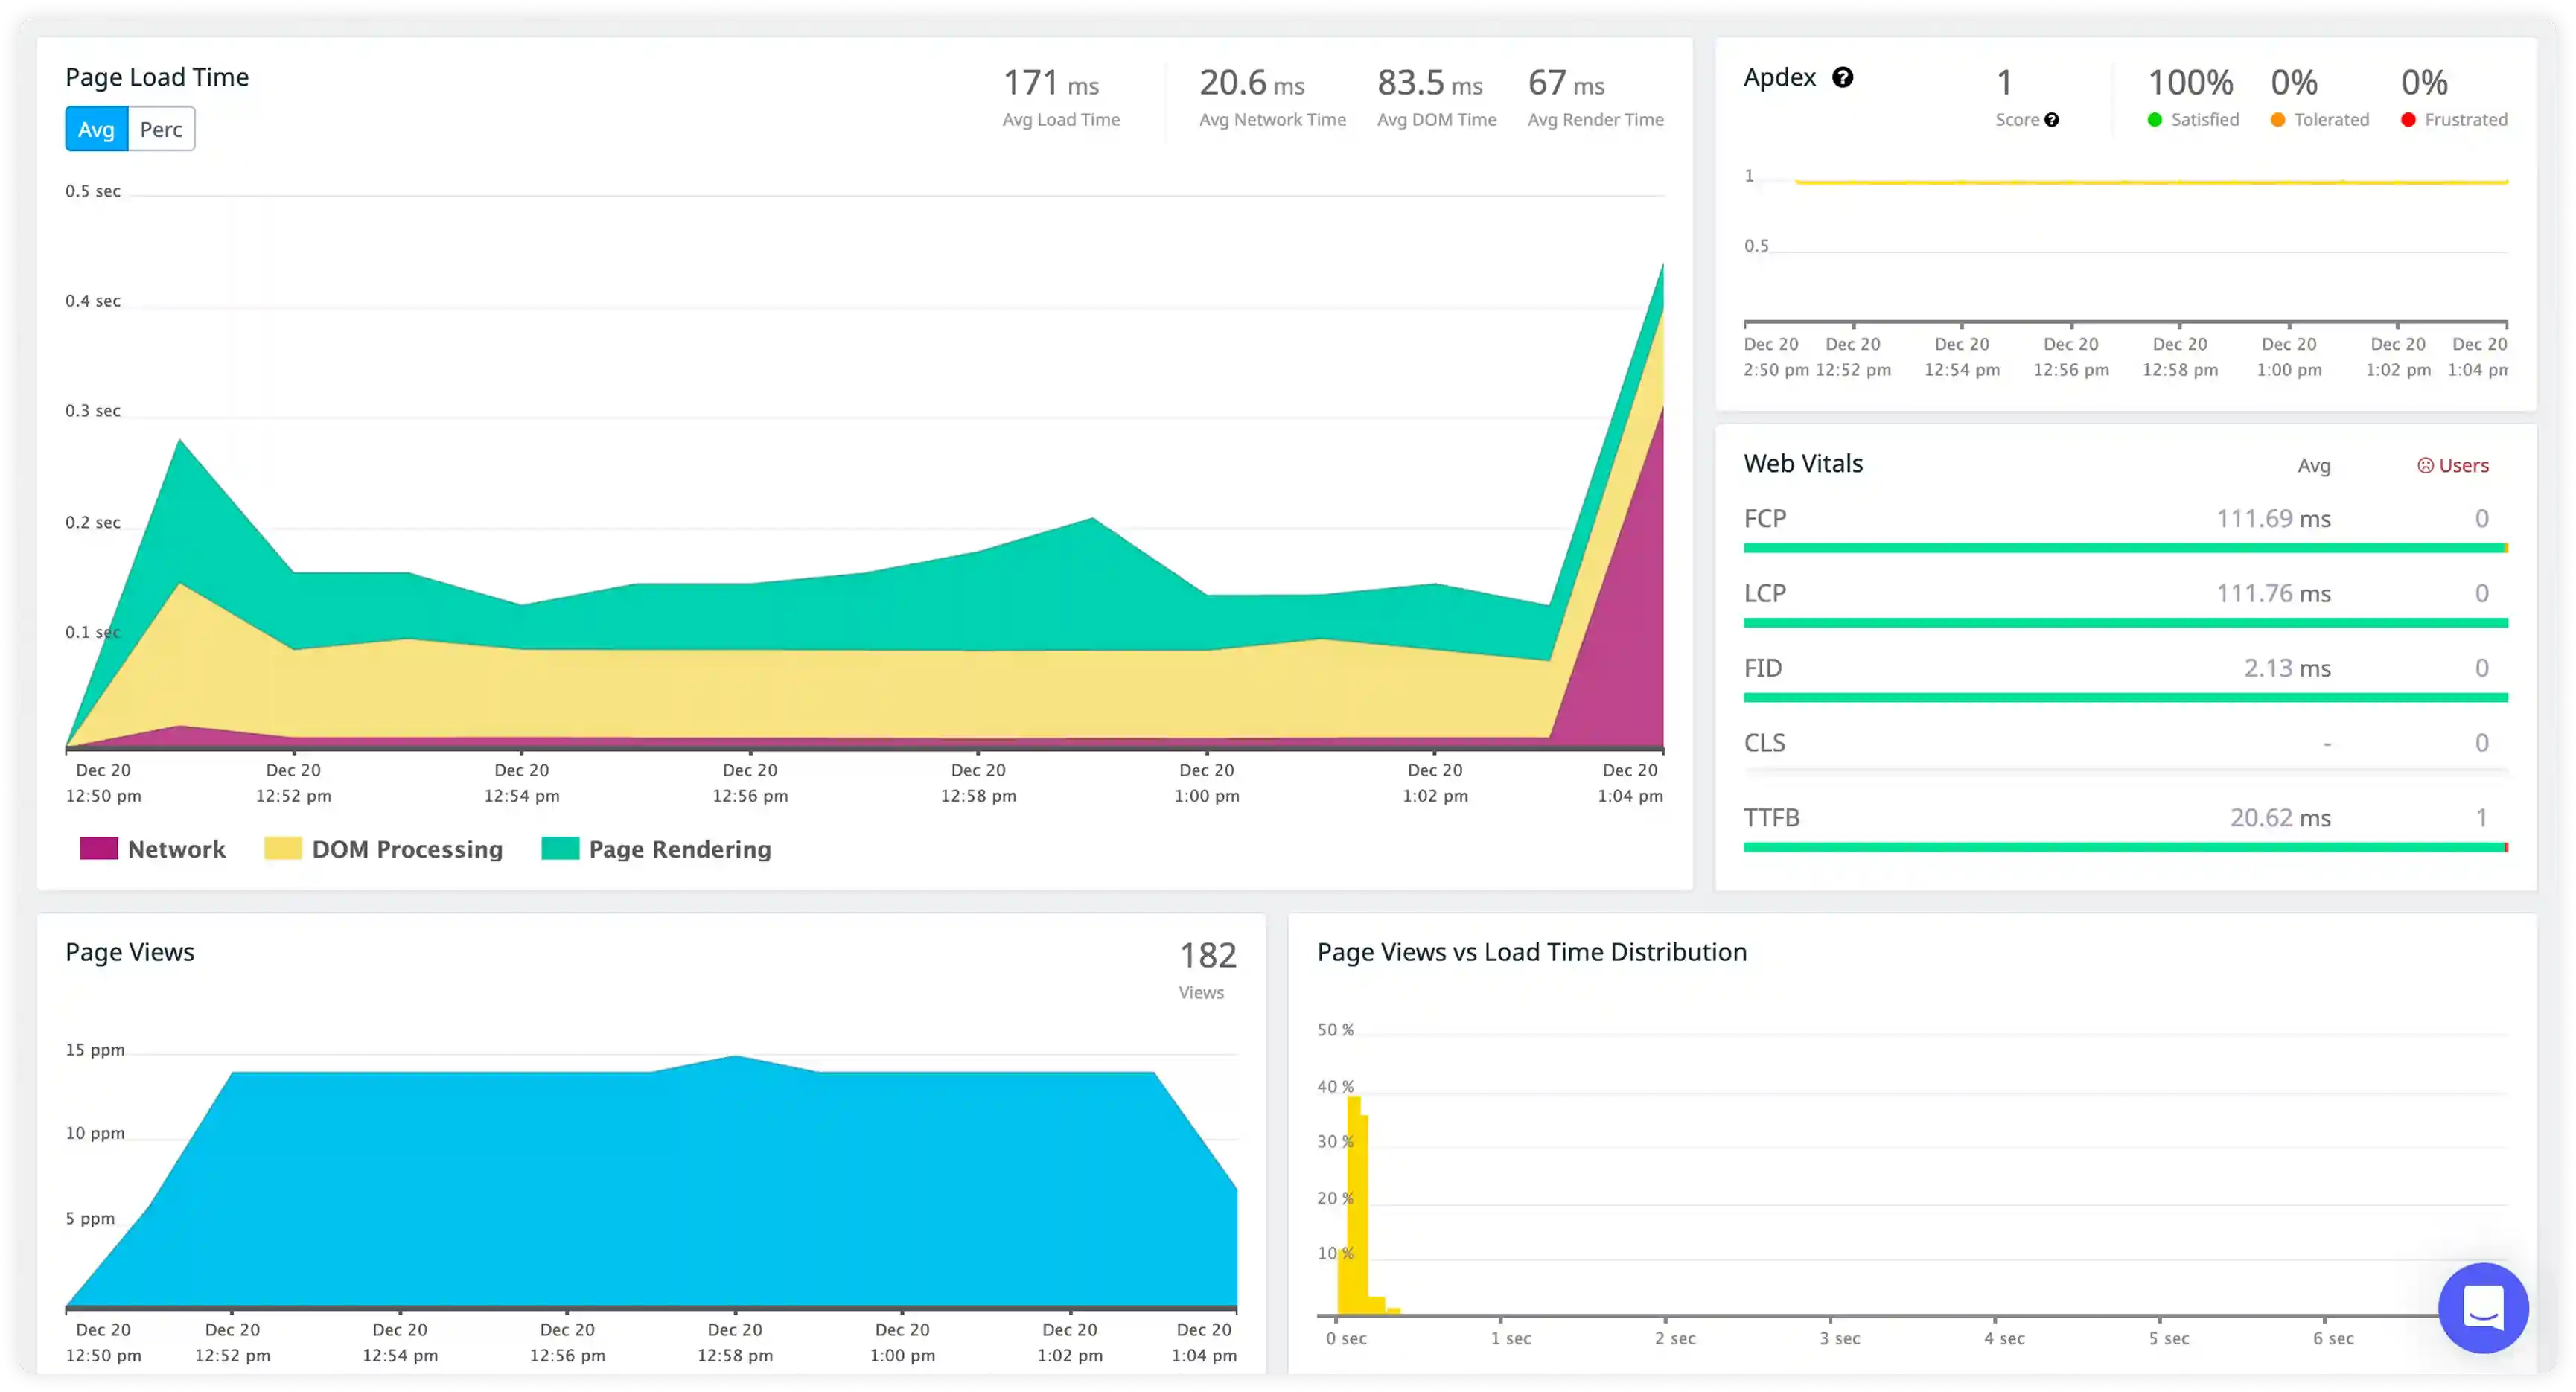
Monitor and Optimize Application Performance at Scale
- APM provides deep visibility into application performance to identify slow transactions, API calls, and database queries impacting user experience.
- Database Monitoring identifies slow queries, connection pool issues, and inefficient database operations across SQL and NoSQL databases.
- Infrastructure Monitoring tracks CPU, memory, disk, and network usage across servers and containers to optimize resource allocation.
- External Services Monitoring measures performance of third-party APIs and cloud services to identify dependencies causing bottlenecks.

Accelerate Issue Resolution with Team Collaboration
- Unified Dashboards provide centralized visibility into application health, infrastructure metrics, and user experience for development, operations, and business teams.
- Integration with DevOps Tools connects to Slack, PagerDuty, Jira, and incident management platforms to streamline workflows and accelerate response times.
- Customizable Alerts route notifications to the right teams based on service ownership, severity levels, and business impact to improve accountability.
- Performance Reports generate automated summaries of application health, SLA compliance, and incident trends for stakeholder updates and executive reviews.
How Atatus Transforms Your Operations
Measurable improvements across your DevOps workflows and business metrics
Unified Enterprise-Wide Observability
100+ teams on one platformCentralize monitoring across all teams, services, and environments with role-based access and team-specific dashboards.
DevOps Impact
Single source of truth for all observability data with proper access controls
Business Impact
Break down silos and enable cross-team collaboration during incidents
Enterprise Security & Compliance
SOC 2 + HIPAA certifiedSOC 2 Type II, HIPAA, GDPR compliant with SSO, RBAC, audit logs, and on-premises deployment options.
DevOps Impact
Meet security requirements without compromising observability capabilities
Business Impact
Pass audits faster and close enterprise deals without security blockers
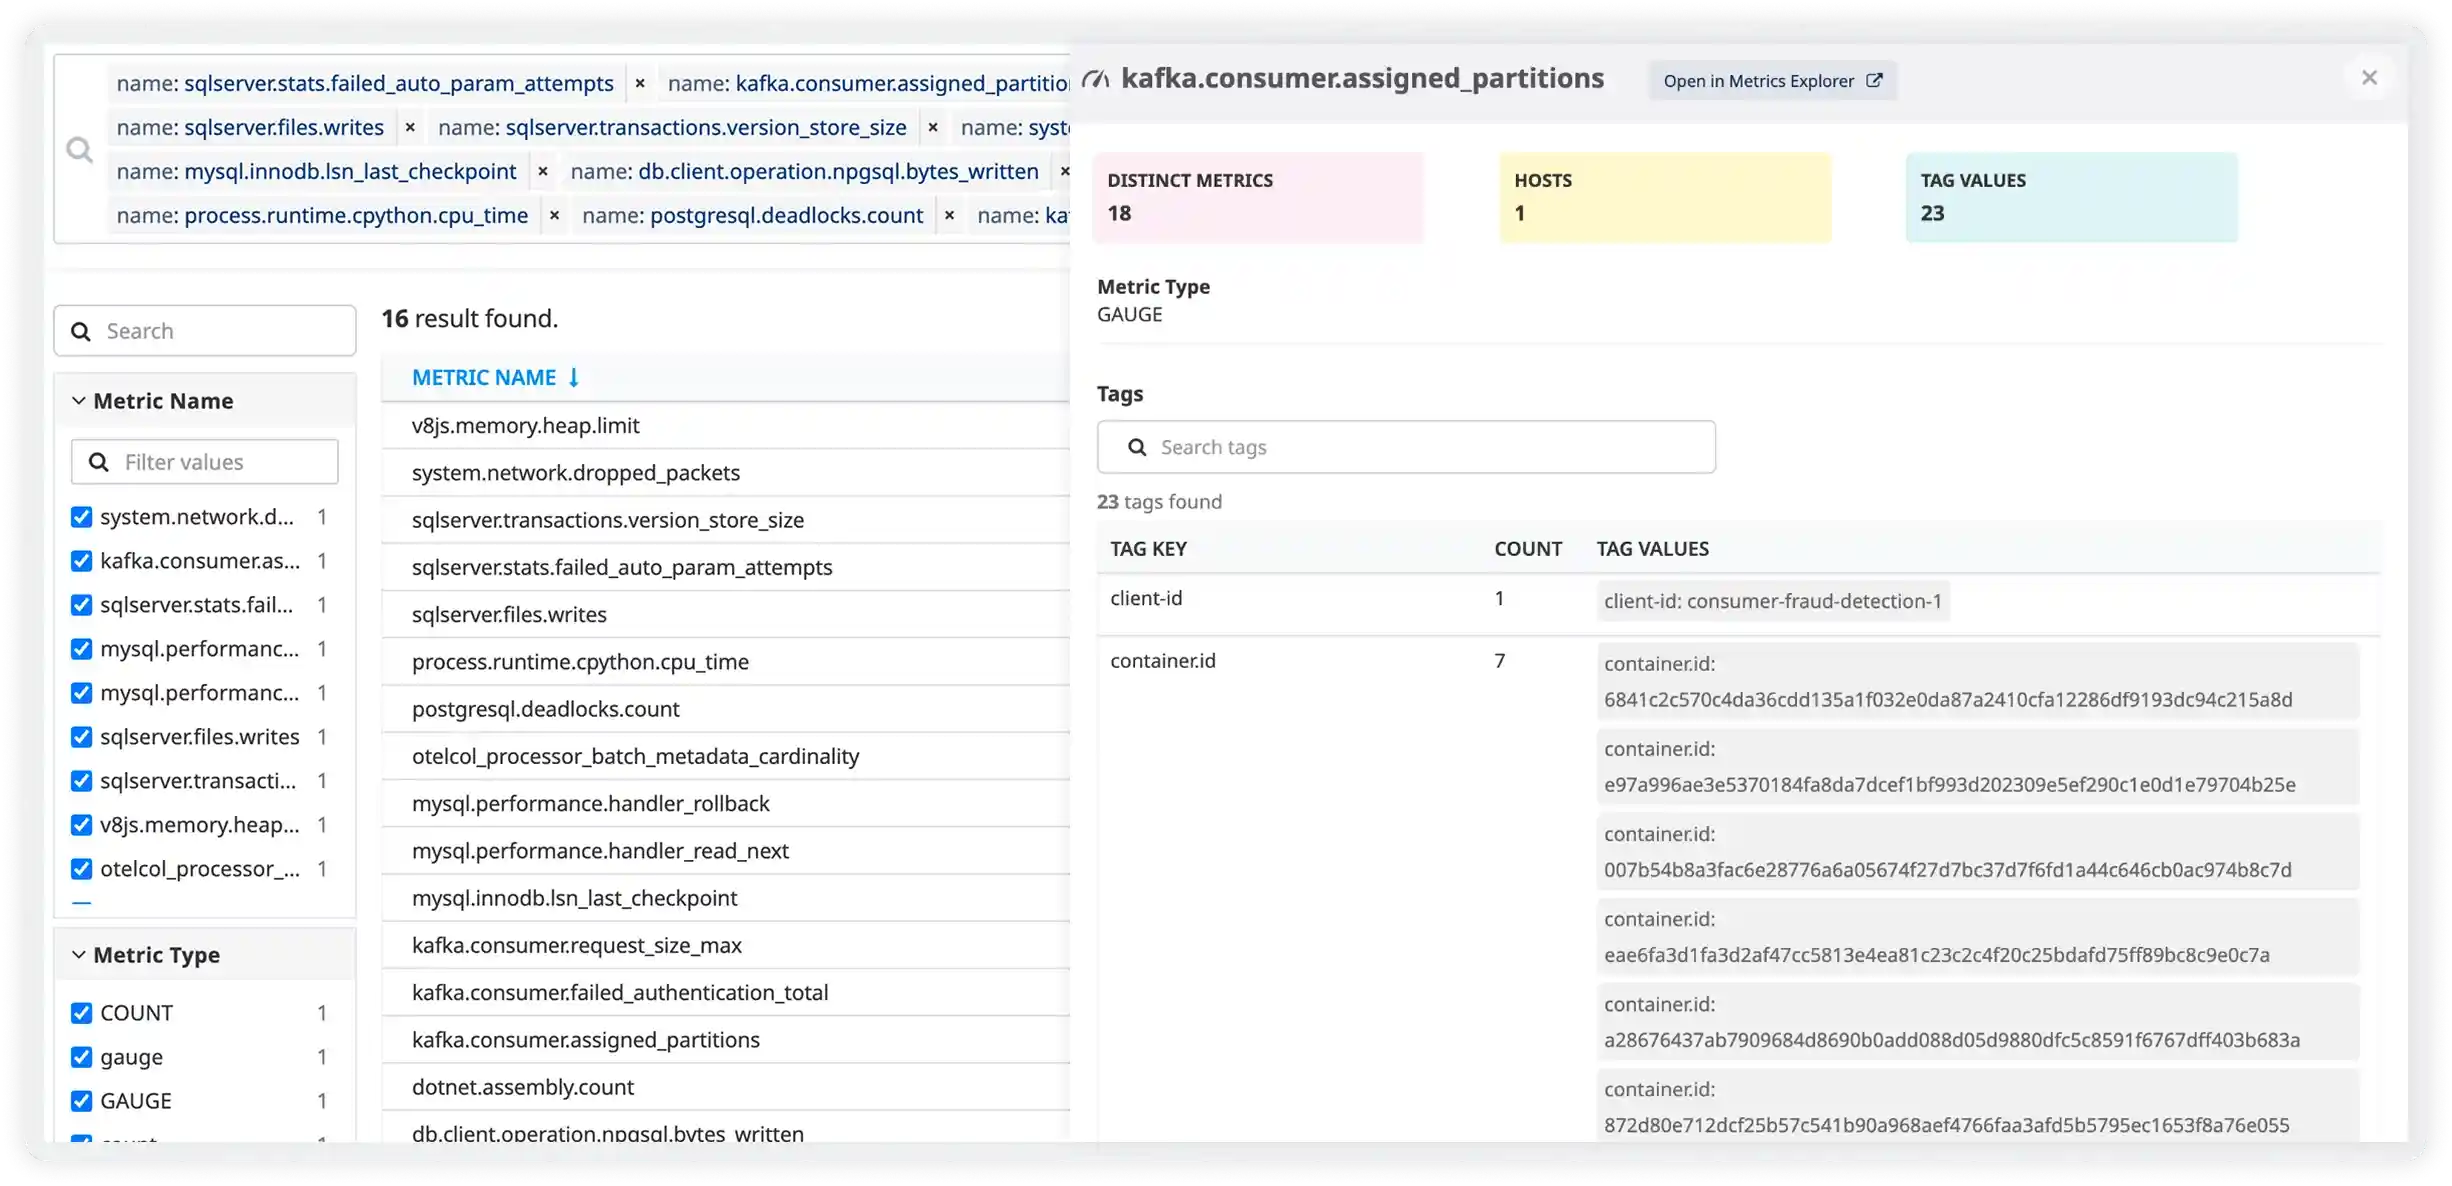
Handle High-Cardinality Data at Scale
10M+ unique time seriesPurpose-built for enterprise scale with efficient indexing that handles millions of unique time series without breaking.
DevOps Impact
Monitor every microservice, container, and user segment without hitting limits
Business Impact
Predictable pricing even as you scale to thousands of services
Unified Observability for Every Engineering Team
Atatus adapts to how engineering teams work across development, operations, and reliability.
Developers
Trace requests, debug errors, and identify performance issues at the code level with clear context.
DevOps
Track deployments, monitor infrastructure impact, and understand how releases affect application stability.
Release Engineer
Measure service health, latency, and error rates to maintain reliability and reduce production risk.
Powering better performance
for modern teams
Feedback from teams improving monitoring and debugging workflows
"Solid Product even better support", The integration path is incredibly simple/easy and the overall interface is very intuitive. That said, I had a handful of odd use cases that the support team was incredibly responsive in helping me work through.

Wes D
Site Reliability Engineer