13 Best Performance Monitoring Tools for Java in 2026
The Java programming language is simple to learn and use, and it is frequently used by web developers to create applications. However, monitoring the performance of a Java-based application might be difficult because it is not a simple process. Implementing multiple monitoring tools to track Java logs, metrics, infrastructure data, and other operational factors is necessary for troubleshooting inefficiencies.
For efficient Java performance tuning, it's critical to monitor the proper aspects and use the right tools. The following is a list of our top Java performance monitoring tools.
What is Java Performance Monitoring?
Java performance monitoring is the process of tracking and analyzing the behavior of Java applications in real time across development, staging, and production environments. It involves collecting JVM metrics, identifying memory leaks, analyzing garbage collection patterns, and monitoring thread activity to ensure your applications run efficiently and reliably.
Performance monitoring tools for Java use techniques like sampling traces, tracking transaction timings, and capturing exceptions to help developers detect and resolve bottlenecks. Whether you're optimizing startup time, reducing latency, or preventing CPU overutilization, Java monitoring tools provide the insights needed to maintain application health at scale.
Also Read: A complete guide to Java Application Performance Monitoring
Once you're familiar with the basics, it's worth exploring the tools that can help you monitor and optimize Java applications more effectively. Here are 13 top Java performance monitoring tools you should consider for improving your Java application performance.
Top 13 Java Performance Monitoring Tools
- Atatus APM
- SolarWinds AppOptics
- Stagemonitor
- SolarWinds Server & Application Monitor
- JProfiler
- Pingdom Server Monitor
- Eclipse Memory Analyzer
- Atatus RUM
- Sematext Experience
- Atatus Logs Monitoring
- Sematext Logs
- LightStep
- xRebel
1. Atatus APM
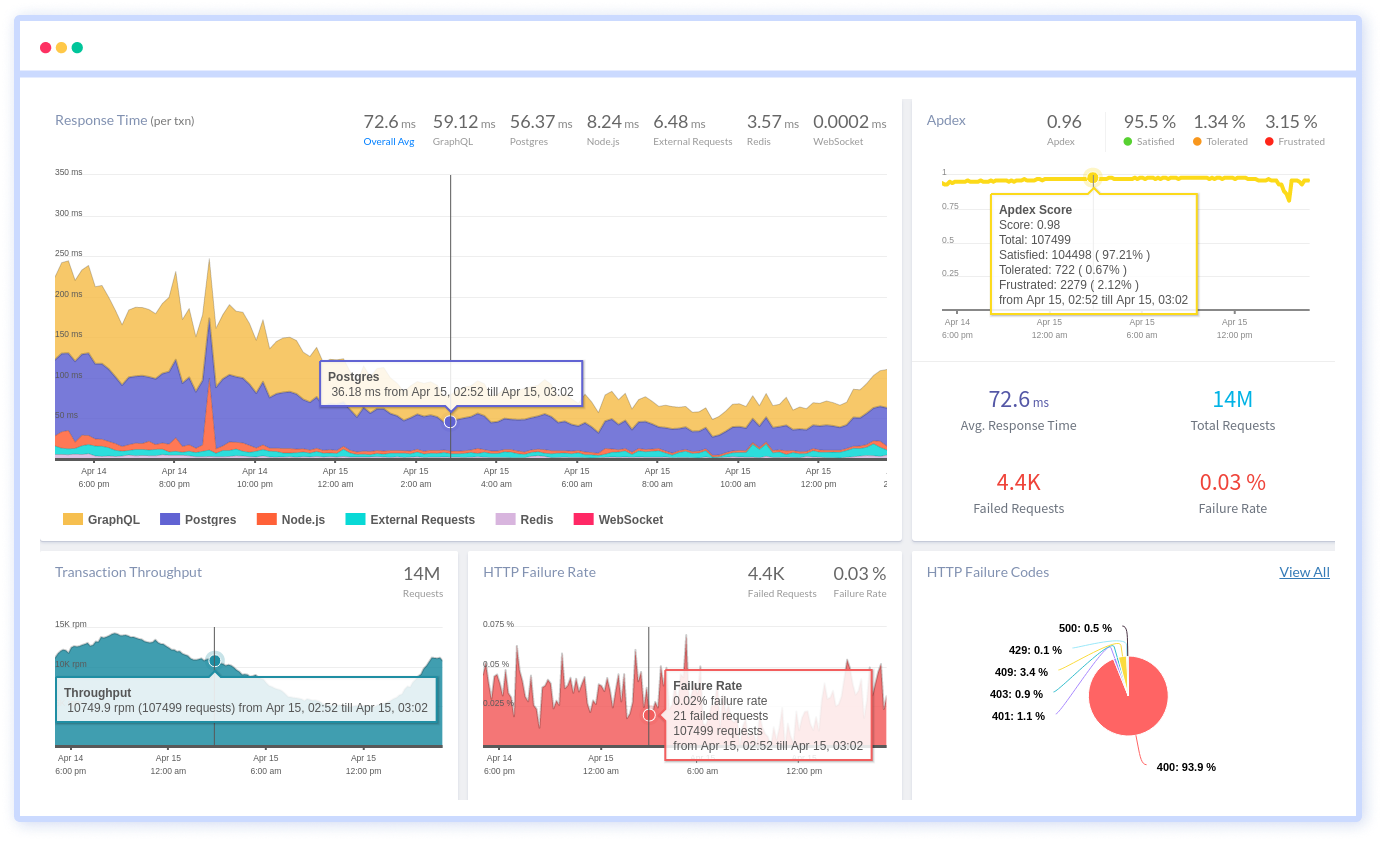
Atatus provides end-to-end visibility into Java performance with application monitoring tools. With Java monitoring, you can get valuable insights on performance bottlenecks and enhance your application.
It records all requests made to your Java applications without forcing you to make any changes to your source code. You can get a clear picture of how your methods, database statements, and external requests affect your users' experience.
In your Java application, you can automatically visualize end-to-end business transactions. With Java Monitoring, you can keep track of the amount and types of failed HTTP status codes and application crashes. On every business transaction, you can also evaluate response time to find Java performance issues and Java errors.
You can view the most common Java HTTP failures and obtain detailed information on each request, as well as custom data, to determine the root cause of the issues. To solve Java exceptions and errors, you can get all the necessary information, such as class, message, URL, request agent, and version.
Examine how much time is spent in code blocks, database queries, external services, templates, message queues, and other areas of delayed Java requests. In the context of the original request, view logs, infrastructure metrics, and VM metrics.
2. SolarWinds AppOptics
SolarWinds AppOptics is a full-service monitoring solution for infrastructure and applications. Distributed tracing, custom, and pre-configured alerts and metrics, and customized dashboards are all available to users. AppOptics can also be used as a Java monitoring tool, allowing IT professionals to examine Java application performance down to the code level.
AppOptics can also be used as a Java performance optimizer, allowing developers to see their Java infrastructure from end to end. Developers can use this real-time data to improve their troubleshooting procedures for any Java application. Developers can tune their applications utilizing granular insights into process availability, Java memory use, active threads, and response times due to Java virtual machine (JVM) metrics.
The Java performance monitor from AppOptics features a simple user interface and open connections with the Snap and Telegraf ecosystems. Users can also add custom and pre-configured plug-ins, as well as design their own, giving them more options while monitoring Java web applications.
3. Stagemonitor
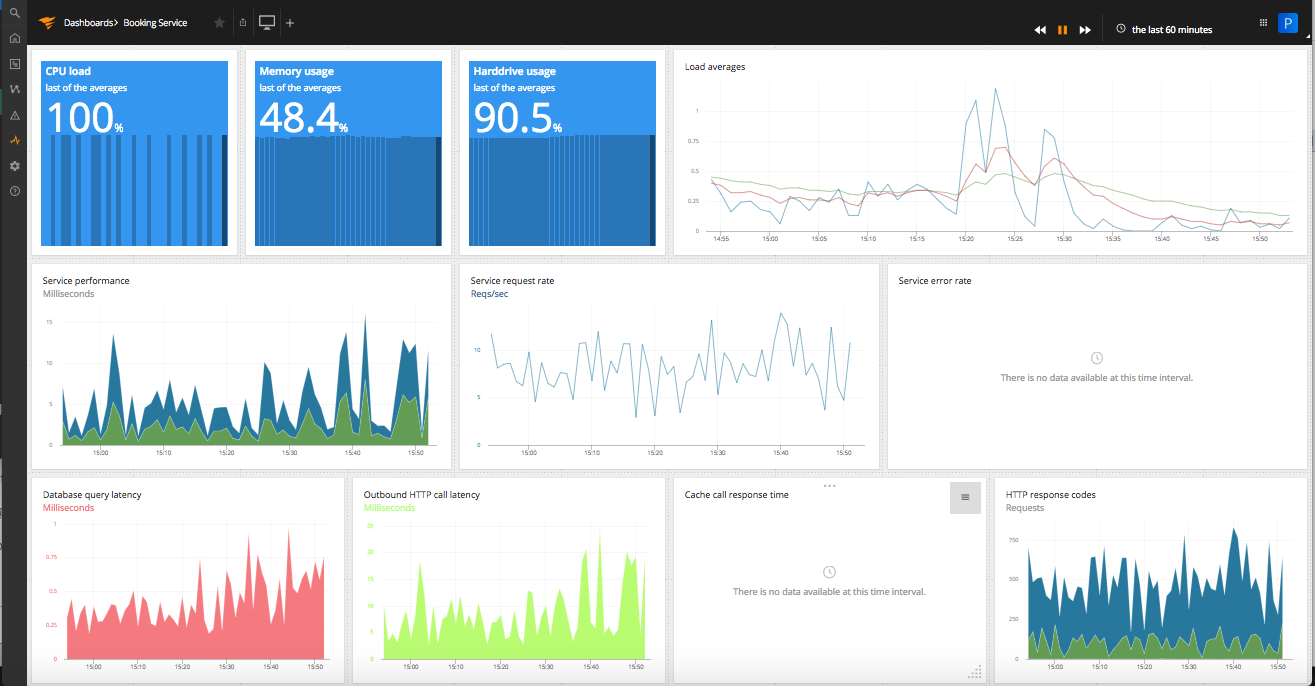
Stagemonitor is a monitoring tool for clustered application stacks created by the community. That means you can use it to monitor the development, testing, and production of JVM-based applications across several servers while keeping overhead to a minimum. Elasticsearch, Graphite, and InfluxDB are examples of time series databases (TDSB).
You can use Stagemonitor to view historical or real-time data from the cluster or developer server, as well as establish custom alerts and thresholds for each JVM metric. You may also make custom dashboards to visualize and analyze metrics.
4. SolarWinds Server & Application Monitor
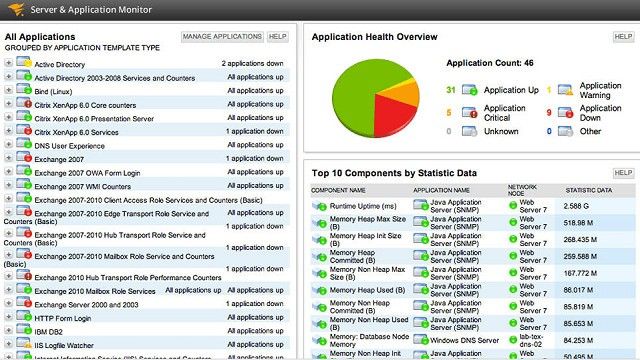
SolarWinds Server & Application Monitor is a Java server monitoring and performance optimization tool for on-premises Java servers. Real-time notifications allow you to troubleshoot issues before they become larger problems. Developers can be warned about problems in production via custom and built-in alerts, which can be set to report issues across key metrics.
With the ability to run pre-made reports or create custom reports, SolarWinds Server & Application Monitor makes it simple to run the reports you need to stay on top of Java monitoring best practices. SolarWinds Server & Application Monitor measures memory, application, concurrency, and database performance in Java application servers.
Garbage collections, memory heap size, heap used, and non-heap used are all memory metrics. It also provides application data such as compiler time and runtime uptime. Blocking time, blocked count, threads started count, wait time, and wait count are all used to calculate concurrency metrics.
Standard Java Profilers
Java profilers provide insight into all JVM metrics (memory, CPU, JVM threads, garbage collection), as well as the ability to examine heap dumps for fine-grained memory analysis. They keep track of all method calls and memory use, allowing developers to quickly drill down into the call structure and identify the places that use the most CPU and memory.
5. JProfiler
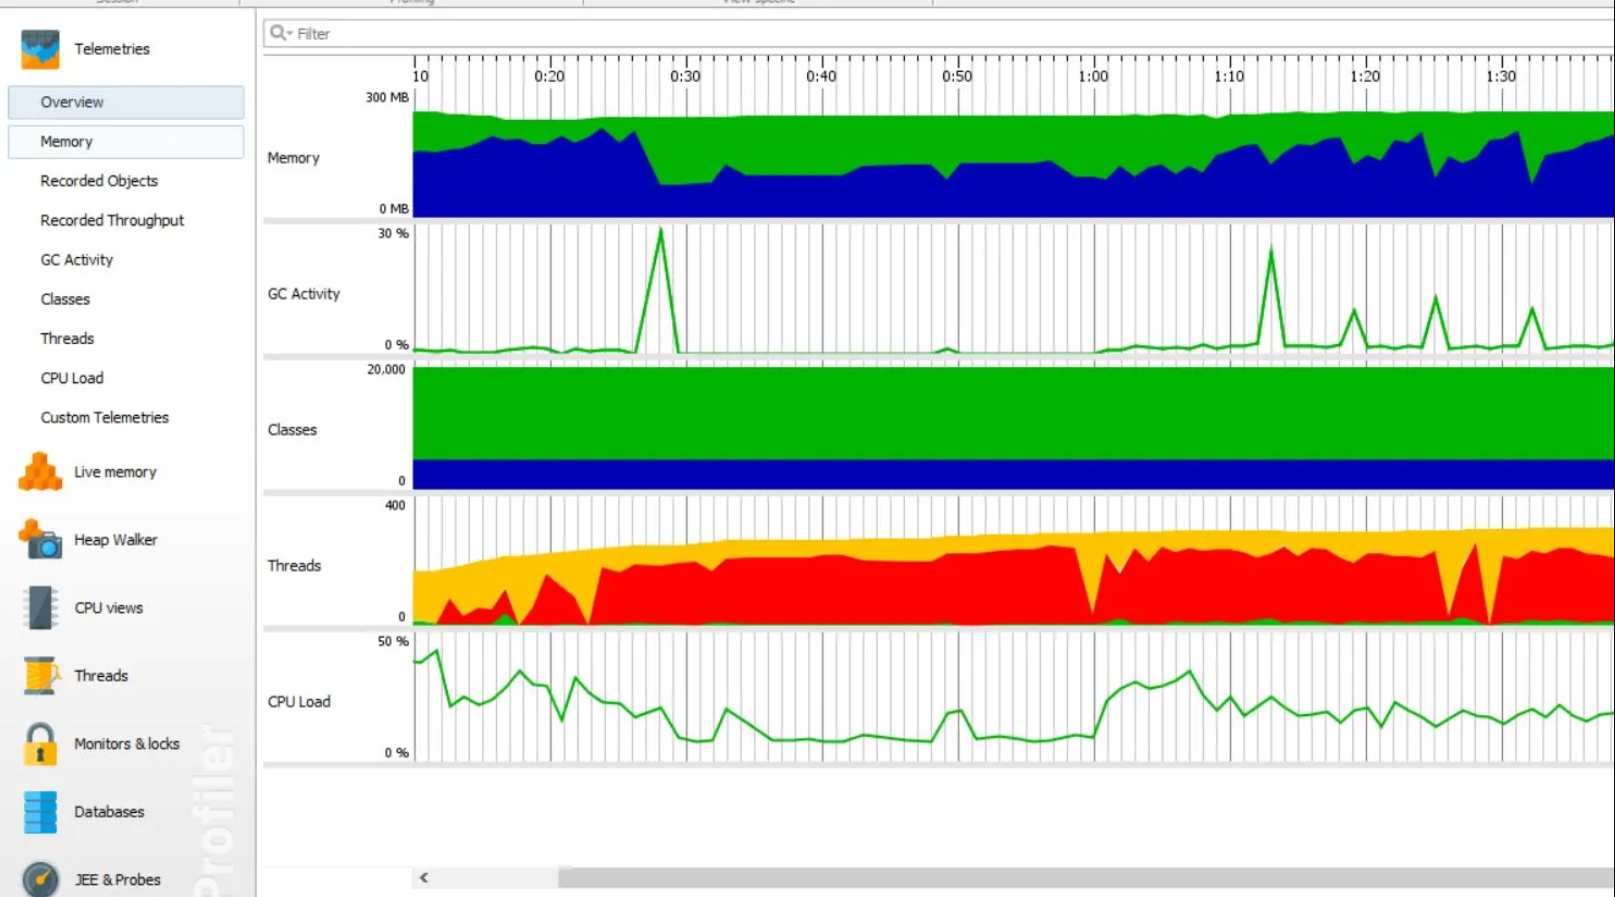
JProfiler is a full-featured JVM profiler that collects all of the data you'd expect from a profiler. It supports live profiling of local and remote sessions, offline profiling and triggers, snapshot comparison, heap dump analysis, automatic request tracking for Kotlin coroutines, Thread starts, java.util.concurrent executors, AWT, and SWT events, and automatic request tracking for Kotlin coroutines.
If both Java Virtual Machines are profiled with JProfiler, it can even trace HTTP requests, RMI calls, web services calls, and remote Enterprise Java Beans calls traveling from one JVM to another.
JProfiler gives you a quick overview of your memory utilization, including details on objects, allocation trees, and hotspots. The heap and its contents can be examined, as well as CPU data for hotspot analysis, call graphs, and method statistics. JProfiler allows you to profile threads, collect telemetry from the Java virtual machine, and much more.
JMX Monitoring
Many developers use the JMX console to manage and analyze Java logs, as it gives information on the health and resources of a JVM. JMX monitoring uses real-time querying to get information from the JMX console's MBeans (Managed Beans). Another process that must be automated to be completed efficiently is this one.
6. Pingdom Server Monitor
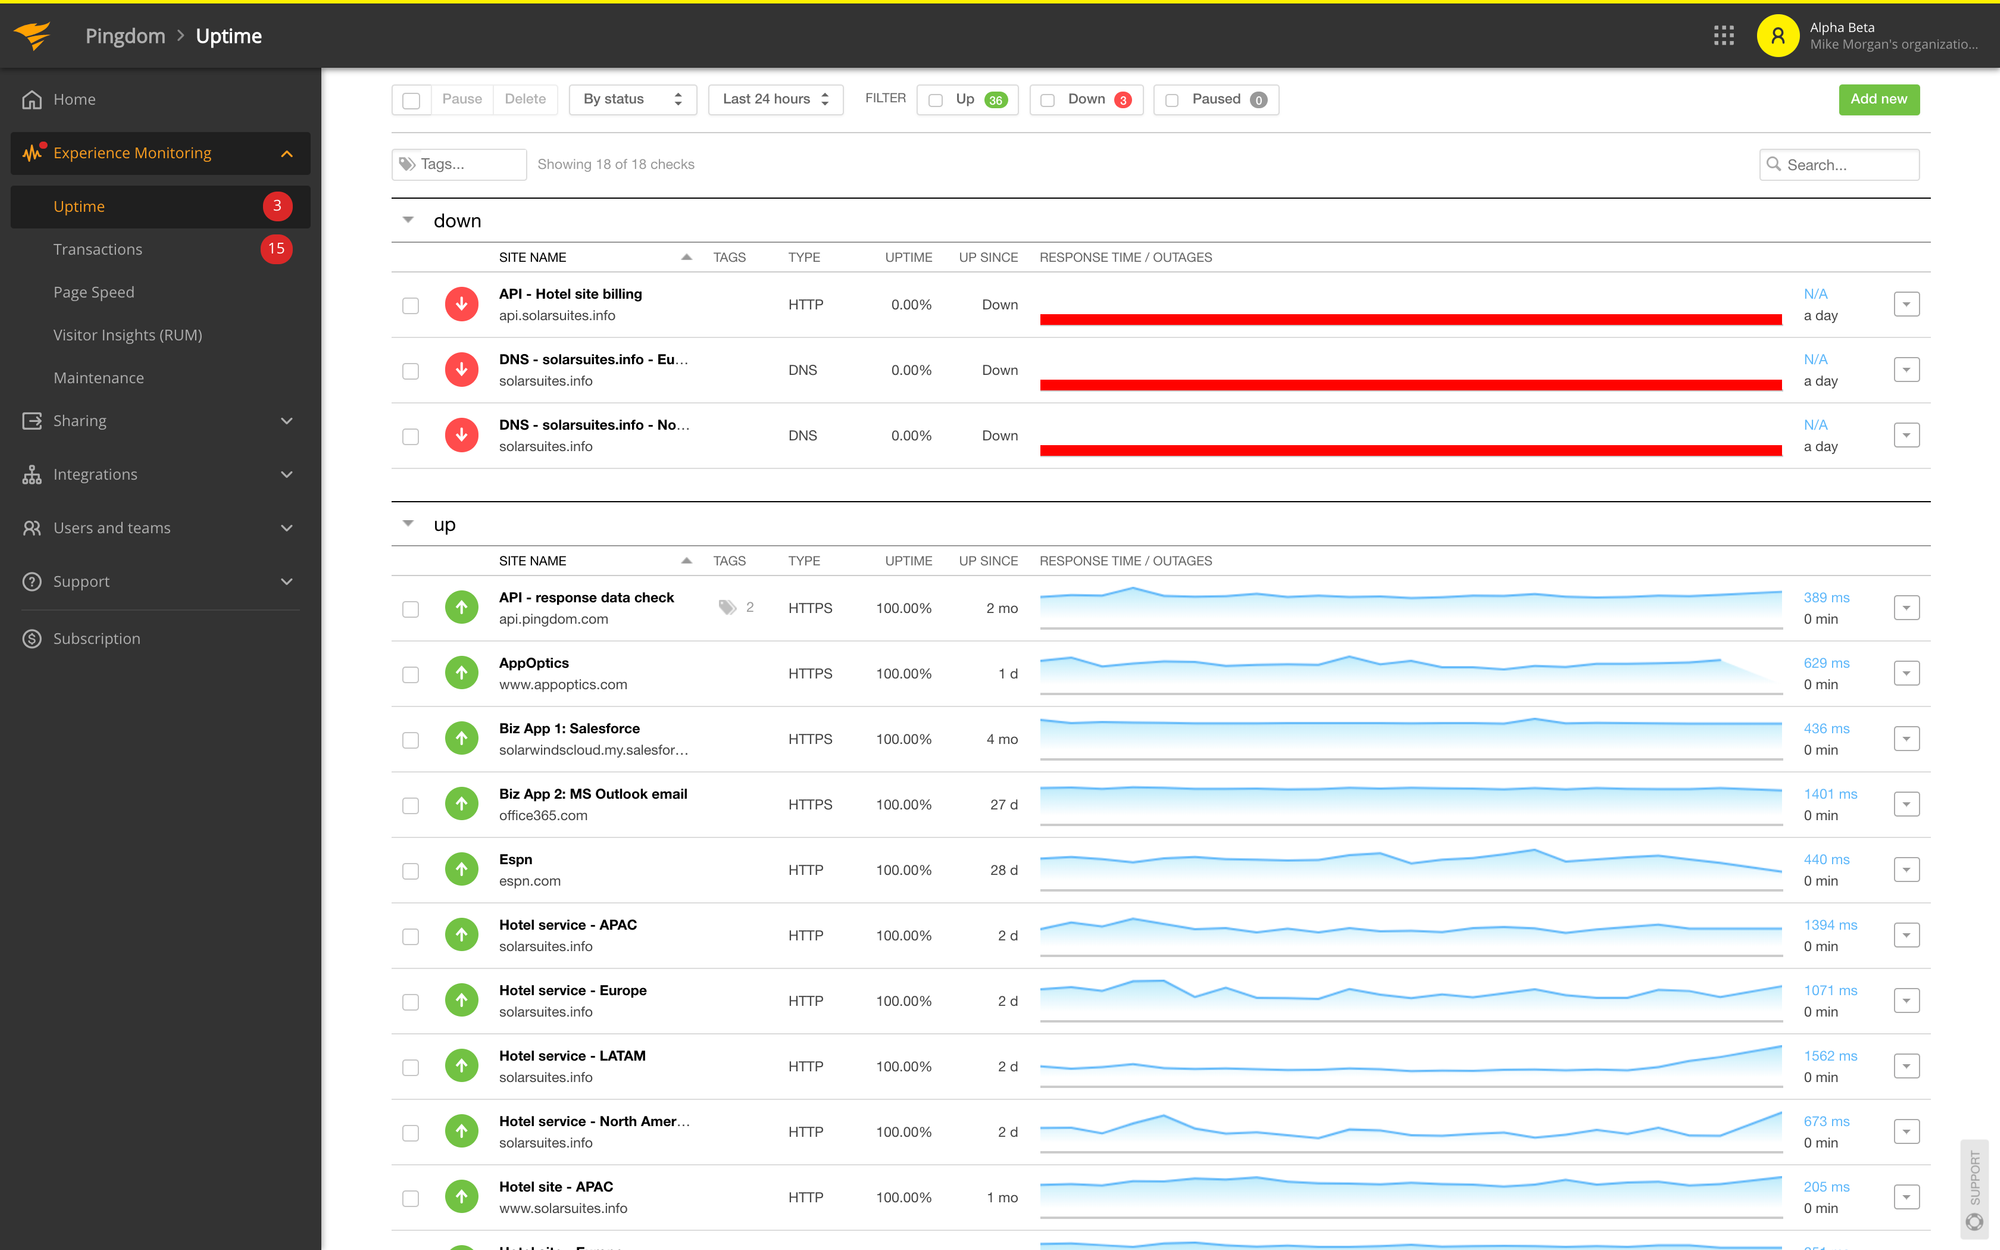
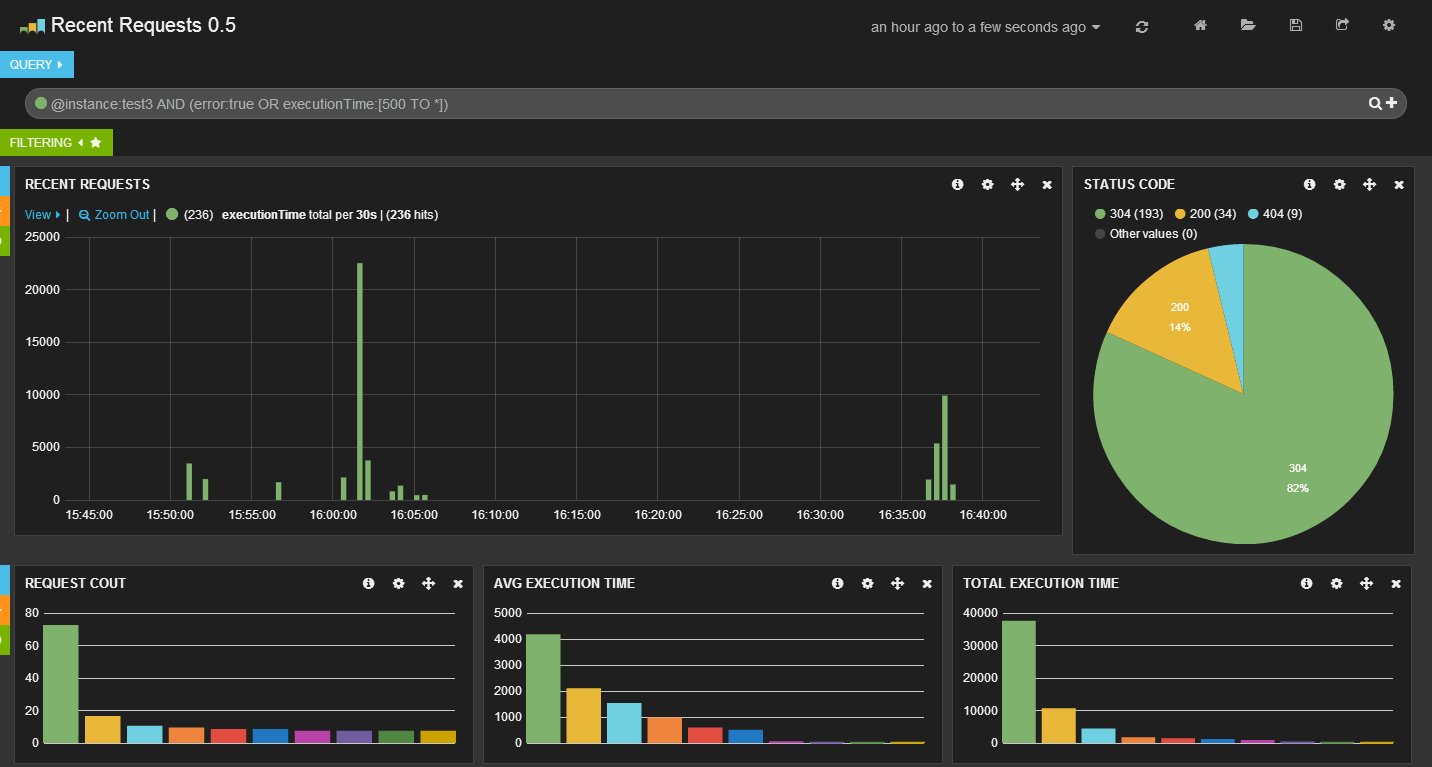
Pingdom Server Monitor is a versatile monitoring tool that collects vital metrics from a wide range of devices and services, including the JMX console. The utility can provide information about JVM's health as well as its resources.
This utility allows the Java application to be more flexible. The user can keep track of the application's heap memory use as well as its non-heap memory utilization. The tool allows developers to learn about java bugs that may be related to the application they created.
Users can install a JMX monitoring plugin, which reports JMX data such as heap and non-heap memory utilization, as well as configure the tool to track other Java metrics.
Pingdom offers a simple setup, so there are no complicated configurations to worry about. Furthermore, customers gain access to custom notifications that assist them to identify potential Java bugs.
Java Heap Analyzer
Memory is one of the most critical metrics to track on a Java-based system. In essence, the heap is where all Java objects are kept. The heap's storage will fluctuate in size as an application runs. Objects are discarded to create room if the heap becomes too full. However, if your heap isn't working smoothly, your web applications may have problems.
7. Eclipse Memory Analyzer
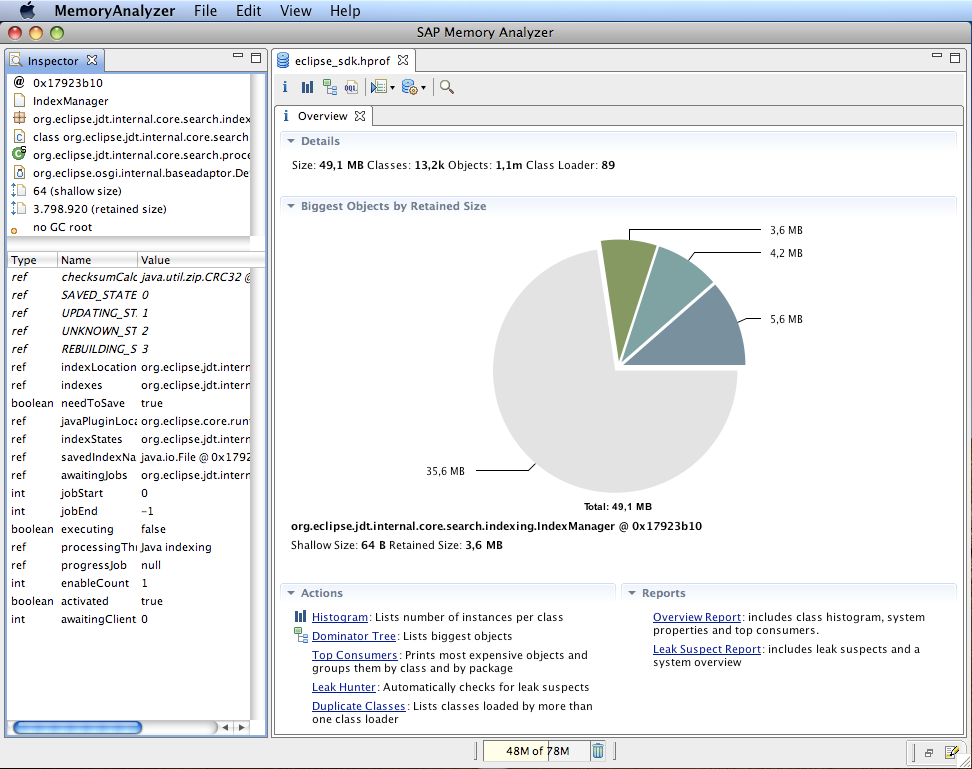
The eclipse memory analyzer is the most often used tool for monitoring java-based applications since it aids in-memory analysis. This utility continuously monitors the application's java heap use. When a java application is created, it contains objects, which are then stored in a heap.
And the variability in heap usage can be seen throughout application execution. When the heap size is full, there is no more room to generate new items. This tool helps in the analysis of memory usage as well as the verification of memory usage by Java applications by developers.
Even when millions of items are passing through, developers can use the Memory Analyzer tool to study heap dumps. They can also determine object retention sizes to ensure that the garbage collector collects the correct items from the heap. IT teams can also create ad hoc reports to find leak suspects.
Real User Monitoring (RUM)
Applications may require a variety of dependencies, such as web fonts, pictures, and Javascript/CSS frameworks, to provide an interactive experience. RUM analyses how your users interact with your application, revealing its dependencies by displaying asset download and page render times.
8. Atatus RUM
Atatus RUM is a scalable end-user experience monitoring tool that allows you to see which areas of your website are underperforming and affecting your users.
Understanding the complicated frontend performance issues that develop due to slow page loads, route modifications, delayed static assets, poor XMLHttpRequest, JS errors, and other factors will help you discover and fix poor end-user performance.
We collect critical performance data for Google's Core Web Vitals and Other Web Vitals that can help you figure out what's causing slow performance at the user level if they're having trouble interacting with the page, seeing unexpected changes, or loading times slow.
You can see which page visits are calling the server-side controller, as well as response time, callback time, throughput, HTTP errors, data transfer size, and other metrics. Understand how these slow AJAX requests affect page load time and the user's digital experience.
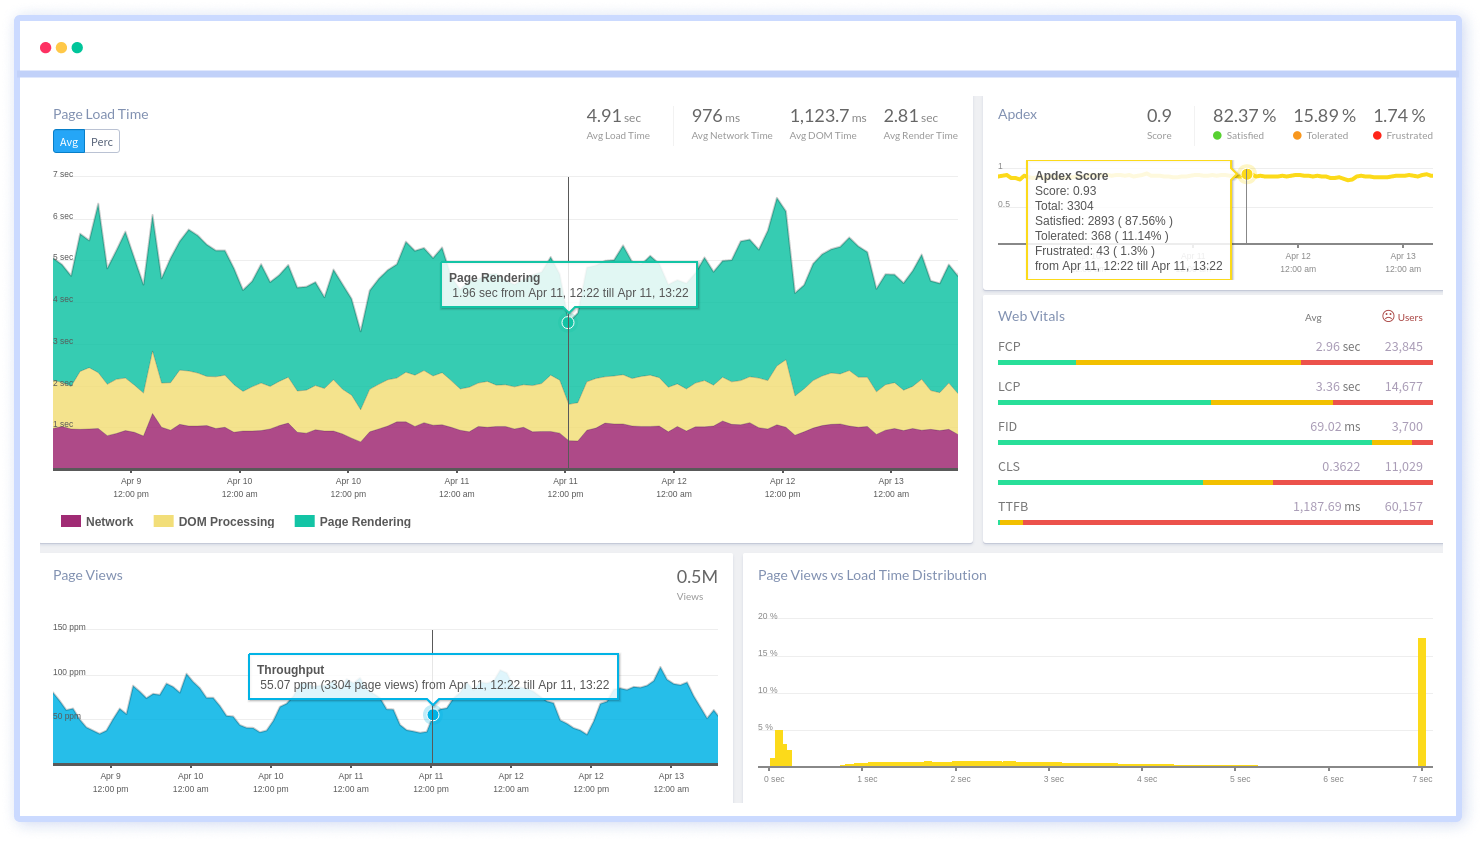
9. Sematext Experience
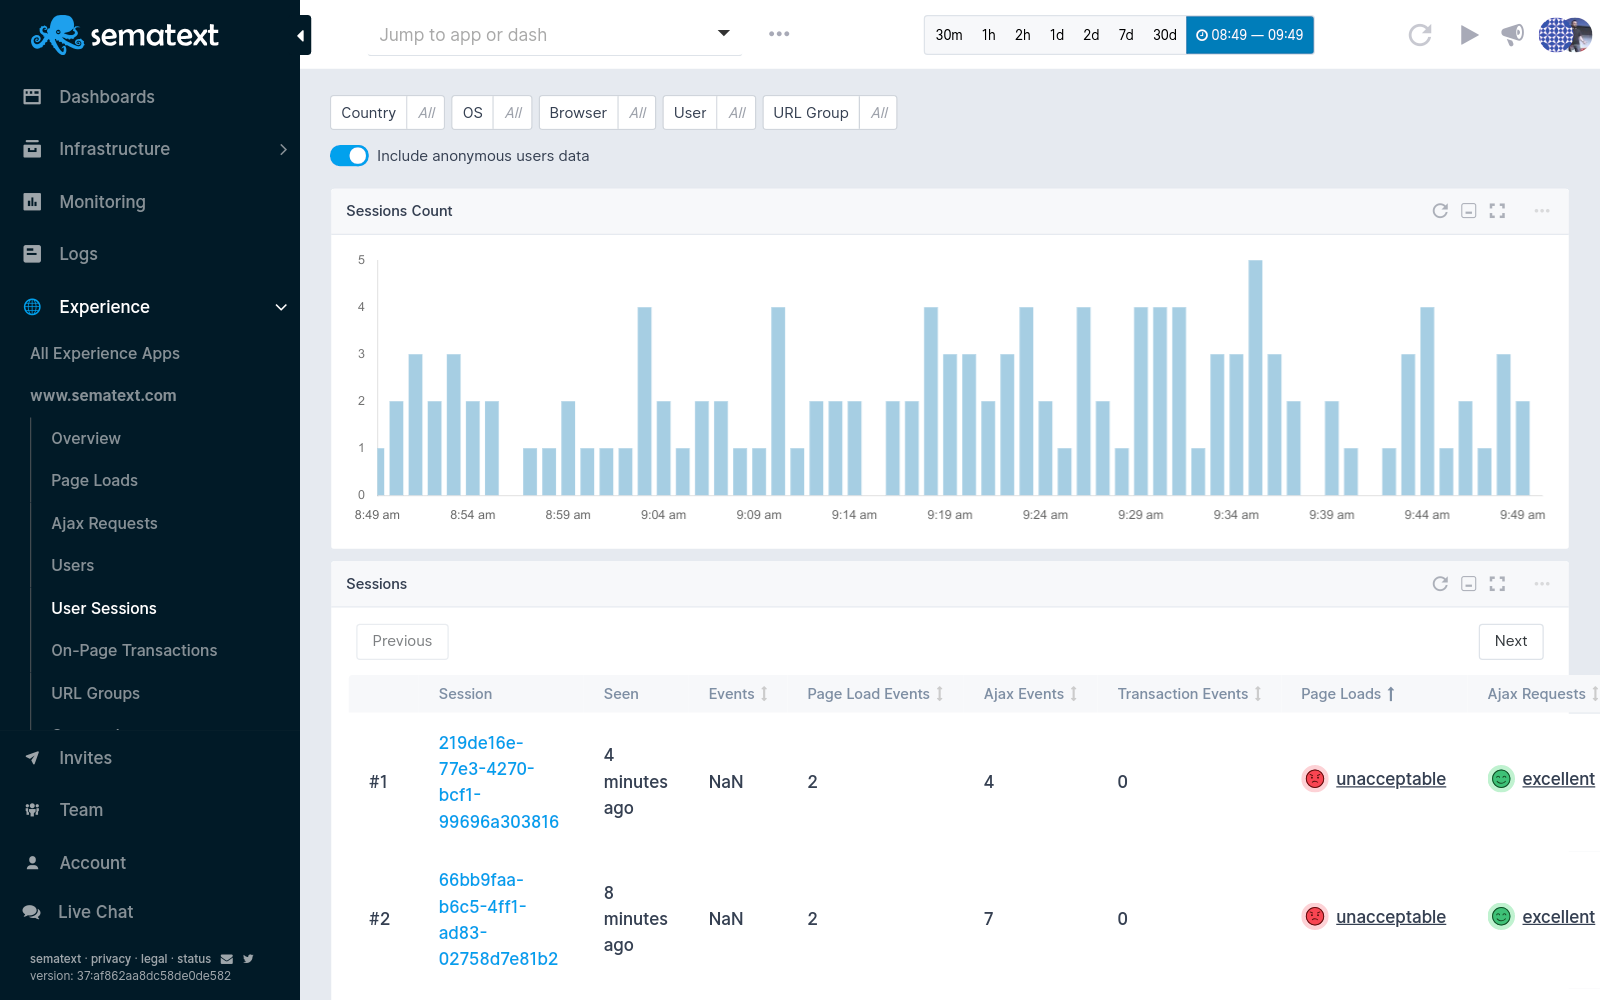
Sematext Experience is a data analysis tool that analyses data from real user sessions. It is built to detect anomalies and issue alerts in real-time, ensuring that your website and web applications are always performing at their best. Sematext Experience helps you improve front-end performance by providing crucial insights.
Sematext Experience helps avoid performance-related issues by retaining 100 percent visibility into the areas that may be hurting UX. Sematext Experience also integrates the teams in charge of Business Operations and Development Operations, delivering real-time metrics for managing and improving the customer experience.
When it discovers a defect that may hurt user satisfaction or performance, it delivers real-time alerts. It can also monitor HTTP requests, page loads, user interface interactions, and resource usage.
Logging Solutions
Java logs reveal information about executed code, errors, potential issues, and much more. If you're using Nginx or Apache as proxy servers, for example, access logs will show you how long it takes to execute a request. You can identify the most popular, quickest, and slowest endpoints by combining access logs.
10. Atatus Logs Monitoring
Atatus Log management is available as a fully managed cloud service. At whatever scale of organization, it requires minimal setup and no maintenance. so that you may focus on your business instead of data pipelines.
As it provides a cost-effective, scalable approach to centralized logging, you receive total insight across your complicated infrastructure. All of your Java logs are processed, metrics are generated, and log data is visualized all from one central location.
In the production environment, you may troubleshoot your Java logs by searching, filtering, and analyzing logs as they arrive. Data can be sliced and diced across log events using simple filters. To cut through the noise and focus on the key events that matter, you can search the Java logs by hostname, service, source, messages, and more.
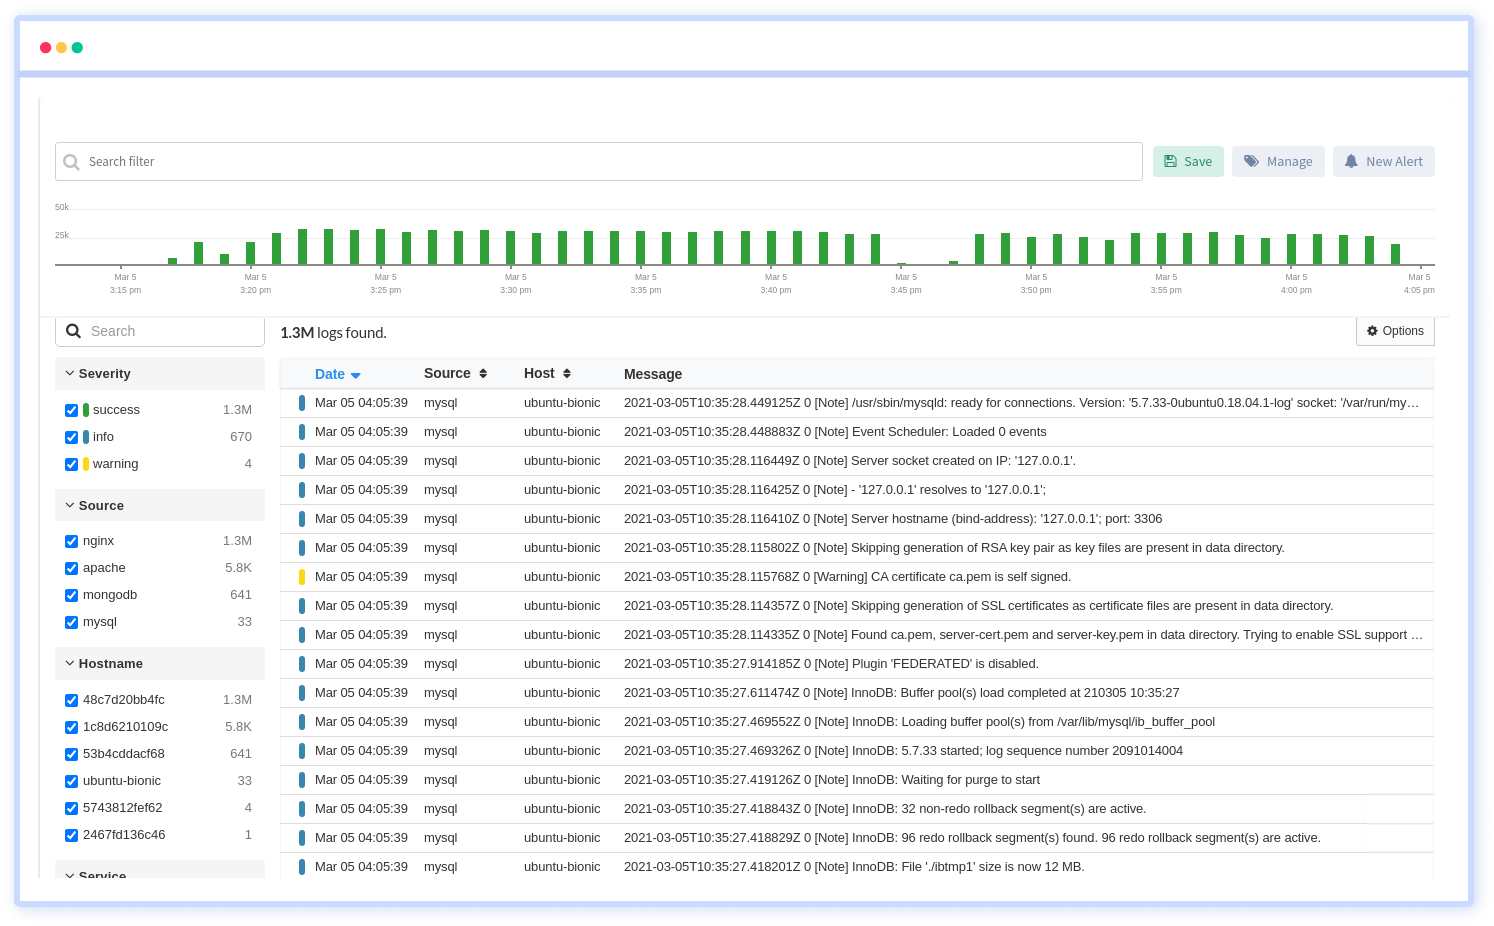
11. Sematext Logs
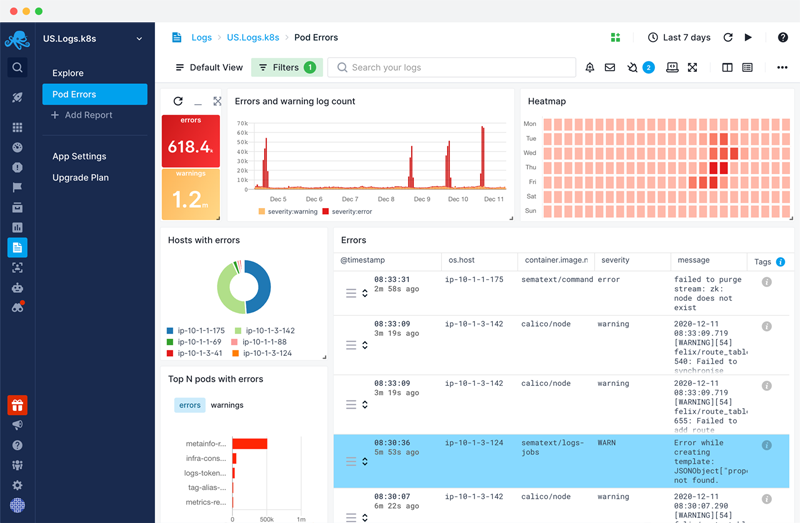
Sematext Logs is a logging service that allows you to centralize logs from a variety of sources, including Java-based applications, microservices, operating systems, and devices.
The platform allows you to passively and actively arrange, visualize, and analyze all collected data. You can develop informative dashboards that connect every piece of data and watch your systems respond in real-time, or you can set up alerts to be notified when a key event occurs.
Control who can access which data with per-user access restrictions, and store your data for free in S3-compatible storage.
Web Tracer
IT teams who want to capture and analyze information about a web application's performance should use web tracing. Manual tracing, on the other hand, can be time-consuming—developers must examine hundreds of packets, identify the protocols in use, and hunt down hundreds of IP addresses to get a complete picture of how a Java-based web application is performing.
12. LightStep
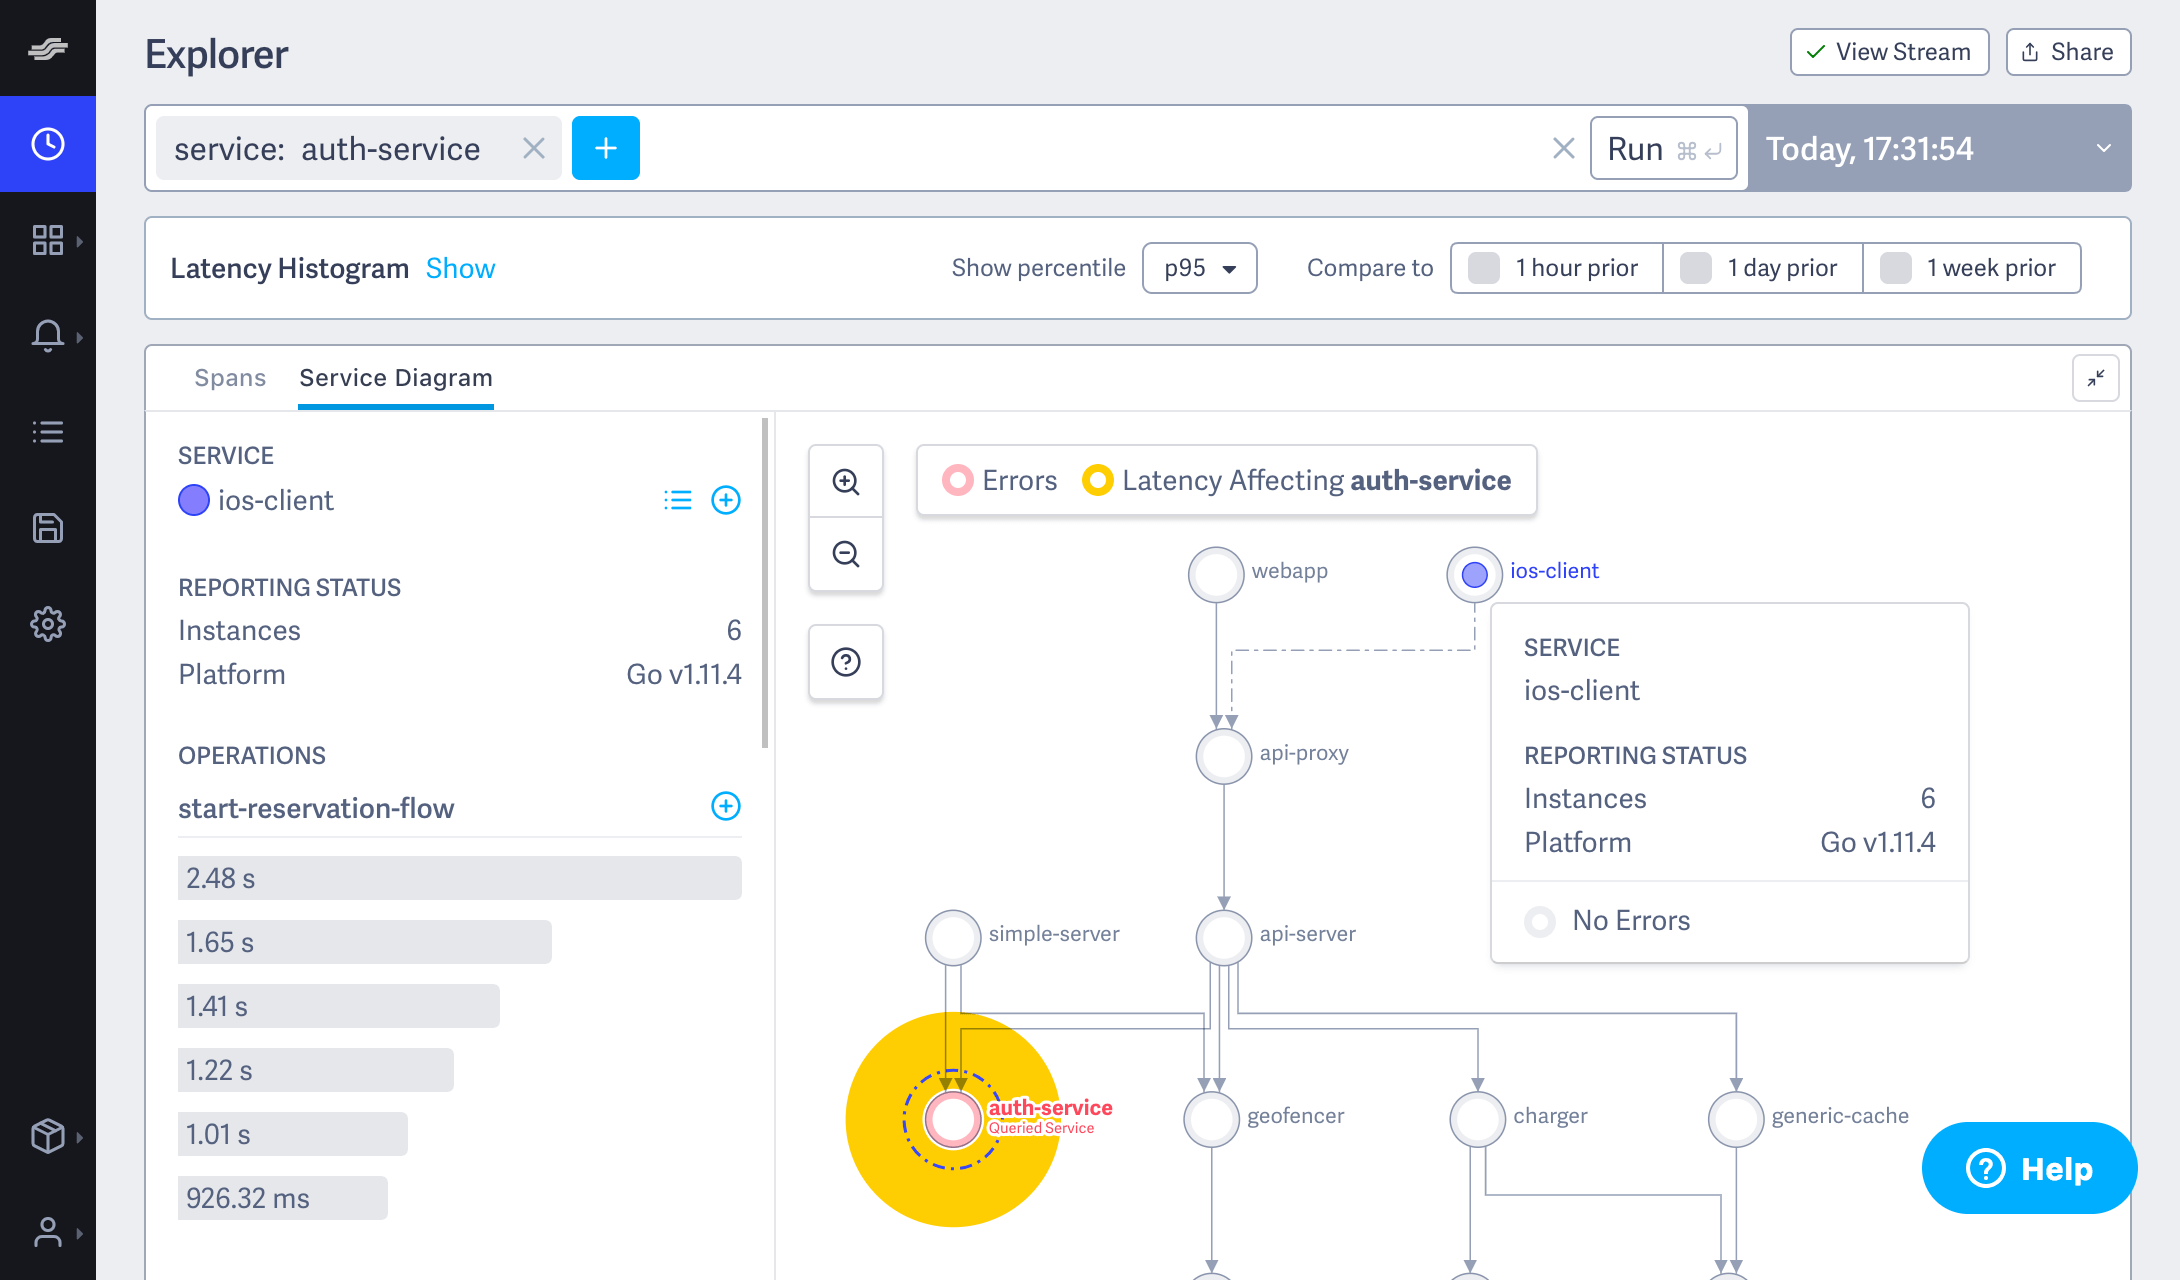
LightStep is a full-featured trace reader that can help you save time by automating sections of the procedure. Developers may use LightStep to construct custom system diagrams based on services and tags, as well as share snapshots that collect and analyze thousands of traces. It is very simple to integrate into a wide range of projects and Java-based web applications.
Within an easy-to-use UI, you can dig down to the service you're interested in and study each of its calls, grouping and filtering them. When you combine that with dashboarding, alerting, and data streams, you have a powerful solution for Java application monitoring.
13. xRebel
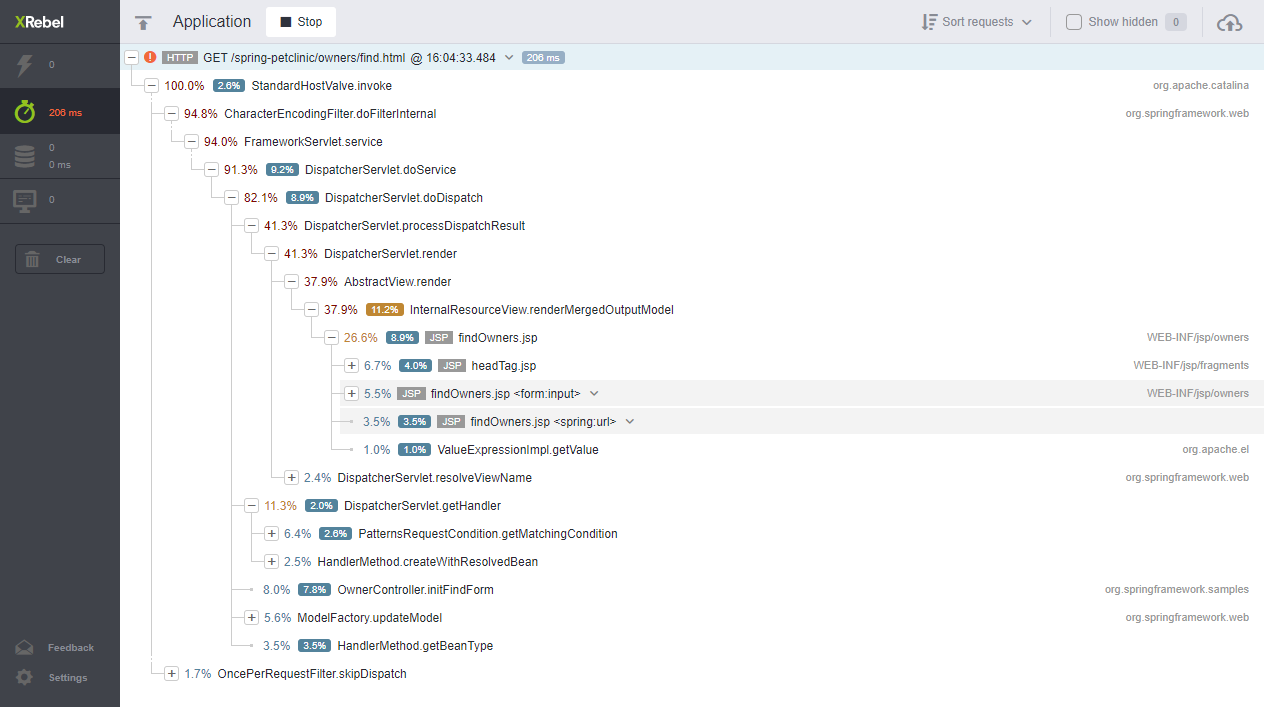
xRebel is a platform that allows users to access the request execution details for any xRebel-enabled service. In this approach, even if the request spans numerous Java Virtual Machines, it can be traced in the distributed application, providing performance for each section of its execution.
This includes requests made to datastores like MongoDB, Cassandra, HBase, and Neo4j utilizing JPA, Hibernate, and JDBC. It's ideal for monitoring and troubleshooting microservice-based architectures because of all of these features.
Final Thoughts
Users can gain important insights, improve performance, and increase uptime with the correct Java monitoring tool. The best Java monitoring solution should be cost-effective, scalable, and meet your business needs.
All of the java monitoring tools are used to assess the performance and memory utilization of applications written in the Java programming language. There are many distinct sorts of java monitoring tools, each designed to suit a certain purpose.
These tools are used by developers during the application development process to create an efficient Java application.
Monitor Your Entire Application with Atatus
Atatus Observability Platform lets you review problems as if they happened in your application. Instead of guessing why errors happen or asking users for screenshots and log dumps, Atatus lets you replay the session to quickly understand what went wrong.
Atatus can be beneficial to your business, which provides a comprehensive view of your application, including how it works, where performance bottlenecks exist, which users are most impacted, and which errors break your code for your frontend, backend, and infrastructure.
If you are not yet an Atatus customer, you can sign up for a 14-day free trial.
#1 Solution for Logs, Traces & Metrics
![]() APM
APM
![]() Kubernetes
Kubernetes
![]() Logs
Logs
![]() Synthetics
Synthetics
![]() RUM
RUM
![]() Serverless
Serverless
![]() Security
Security
![]() More
More


![Application Performance Monitoring (APM) Guide: Monitor and Optimize Application Performance - [2026 Update]](/blog/content/images/size/w960/2025/10/APM-GUIDE---Monitor-and-Optimize-Application-Performance.png)