Optimize MongoDB Performance Across Workloads
Make data-driven decisions, optimize MongoDB performance, and ensure the security and resilience of your MongoDB environment.
MongoDB Database Monitoring
Query Planner Insights
Analyzes MongoDB query execution stages, index usage, and collection scans to identify inefficient document access patterns.
Connection Pool Load
Monitors client connections, cursor usage, and socket limits to detect connection saturation across MongoDB nodes.
Replica Set Stability
Tracks primary elections, replication lag, and oplog window size to identify replica set health risks.
Lock Contention Metrics
Observes global, database, and collection-level locks that impact concurrent read and write operations.
Memory Working Set
Measures working set size and cache residency to detect memory pressure affecting read performance.
Disk and Storage IO
Monitors WiredTiger disk usage, checkpoint frequency, and compaction impact on write latency.
Error and Warning Logs
Captures MongoDB logs related to replication failures, rollbacks, and storage engine errors.
Operational Throughput
Tracks read and write operation rates to understand workload distribution and peak usage periods.
Operation Throughput
Measures the number of operations (reads, writes, updates, and deletes) processed per second. Sudden drops or spikes may indicate workload imbalances or performance bottlenecks within your MongoDB cluster.
Query Execution Time
Tracks the time taken to execute database queries, focusing on slow queries. High execution times often point to inefficient query structures or missing indexes that impact application performance.
Replication Lag
Monitors the delay between the primary and secondary nodes in a MongoDB replica set. Significant lag can compromise data consistency and affect failover mechanisms in distributed systems.
Memory Usage (Resident Memory)
Measures the amount of memory actively used by MongoDB processes. High memory consumption may lead to increased disk I/O and degraded performance if not optimized properly.
Connections
Tracks the number of active client connections to the MongoDB instance. Exceeding connection limits can cause service interruptions and affect database accessibility during peak loads.
Log Volume
Monitors the size and frequency of logs generated by a container. Sudden spikes in log volume can signal errors or abnormal behavior in the application.
Full Insight Into MongoDB Query Paths and Replica Set Health
Optimize document access patterns while keeping replication fast and reliable.
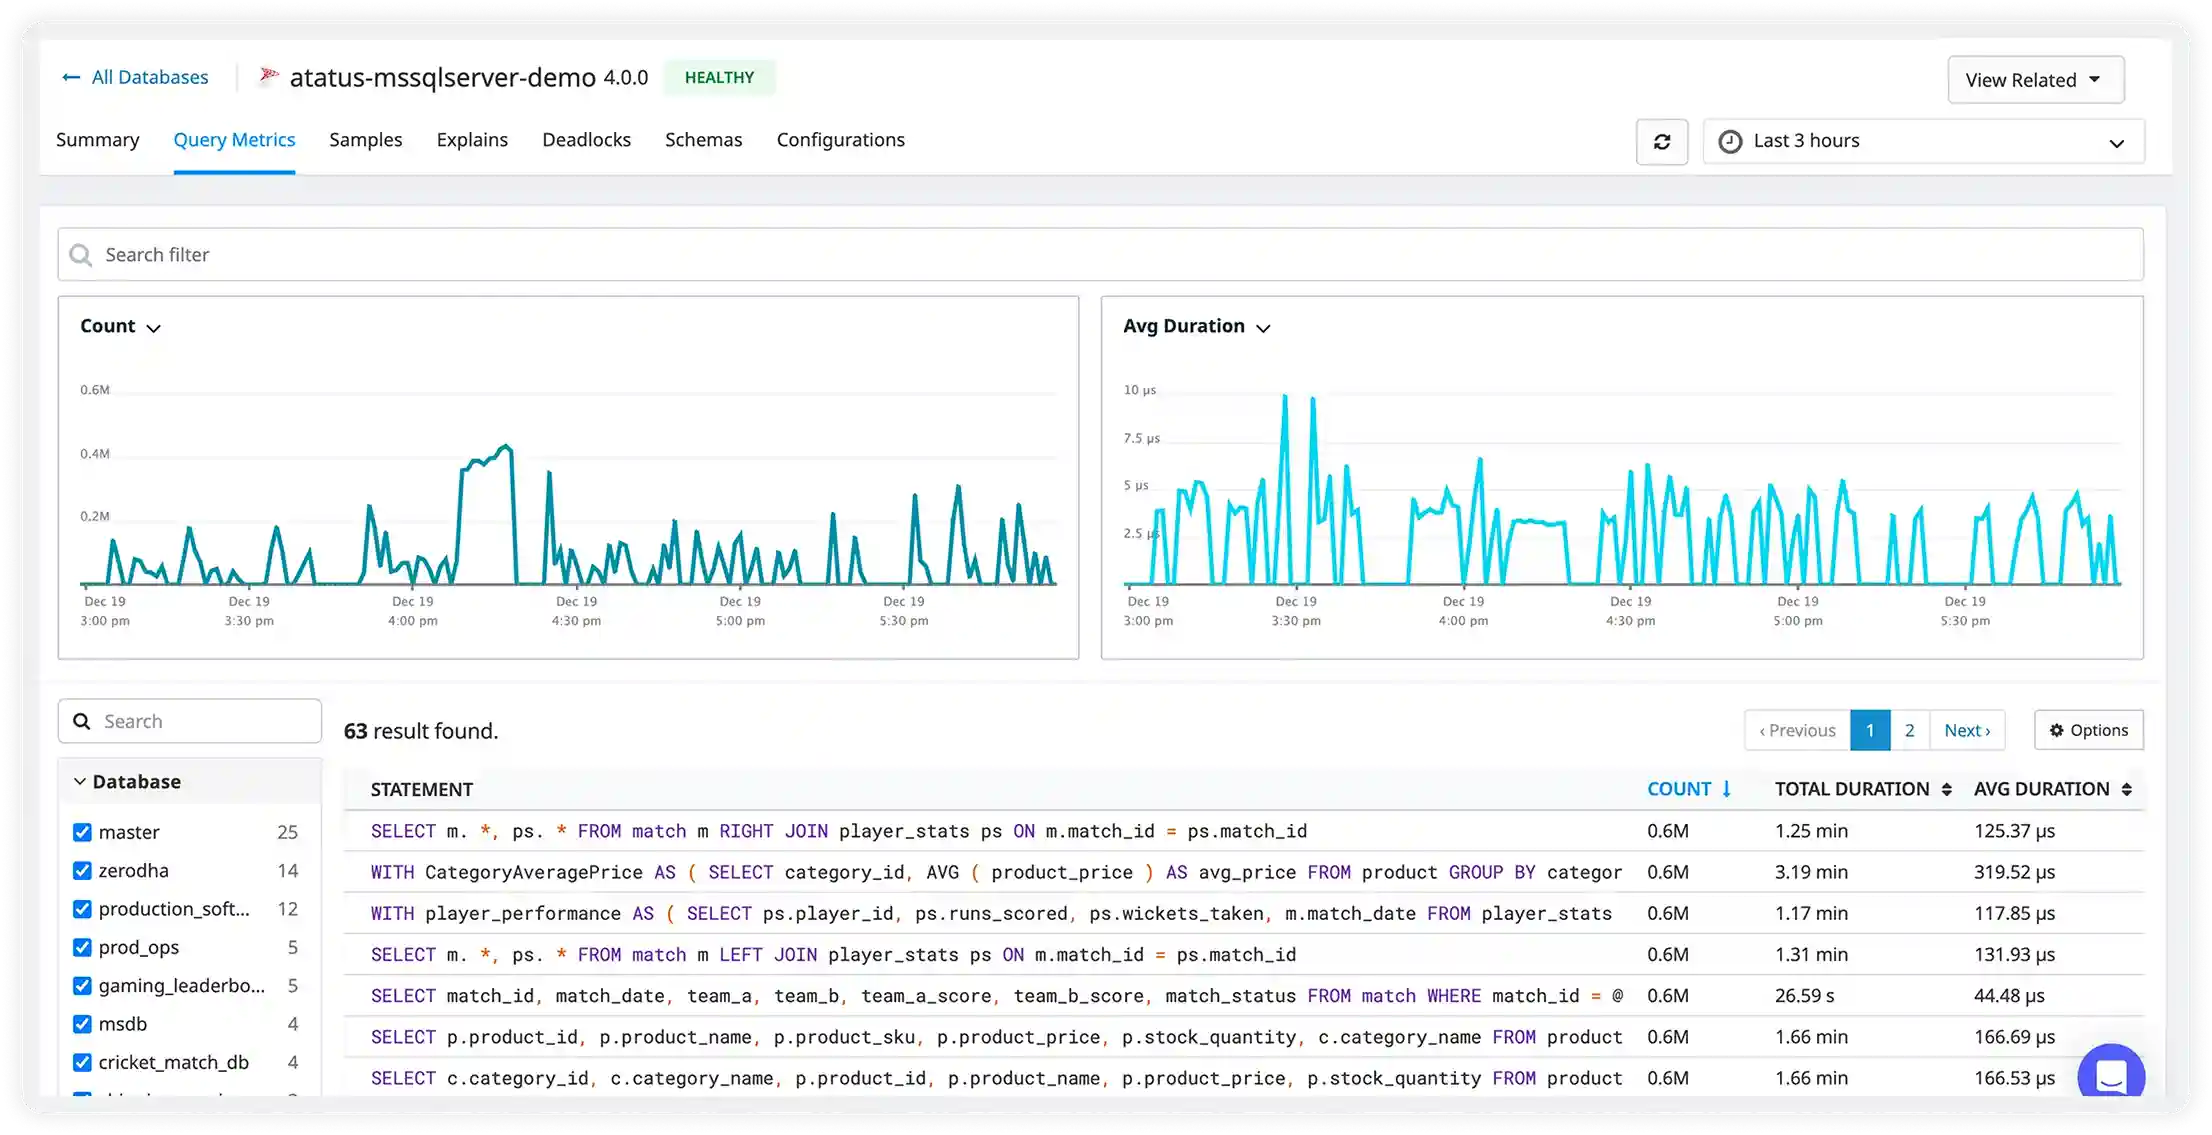
Query Performance Metrics
- Track MongoDB operation throughput and execution time in real time to understand how your clusters perform under live production workloads and instantly detect sudden traffic spikes or slow operations.
- Identify slow queries and high-volume read or write operations impacting CPU, memory, and disk utilization so teams can focus on the most resource-intensive workloads.
- Monitor read versus write performance across collections and databases to uncover imbalance, replication pressure, or scaling limitations.
- Analyze performance trends over time to detect regressions early, validate scaling strategies, and prevent user-facing slowdowns before they occur.
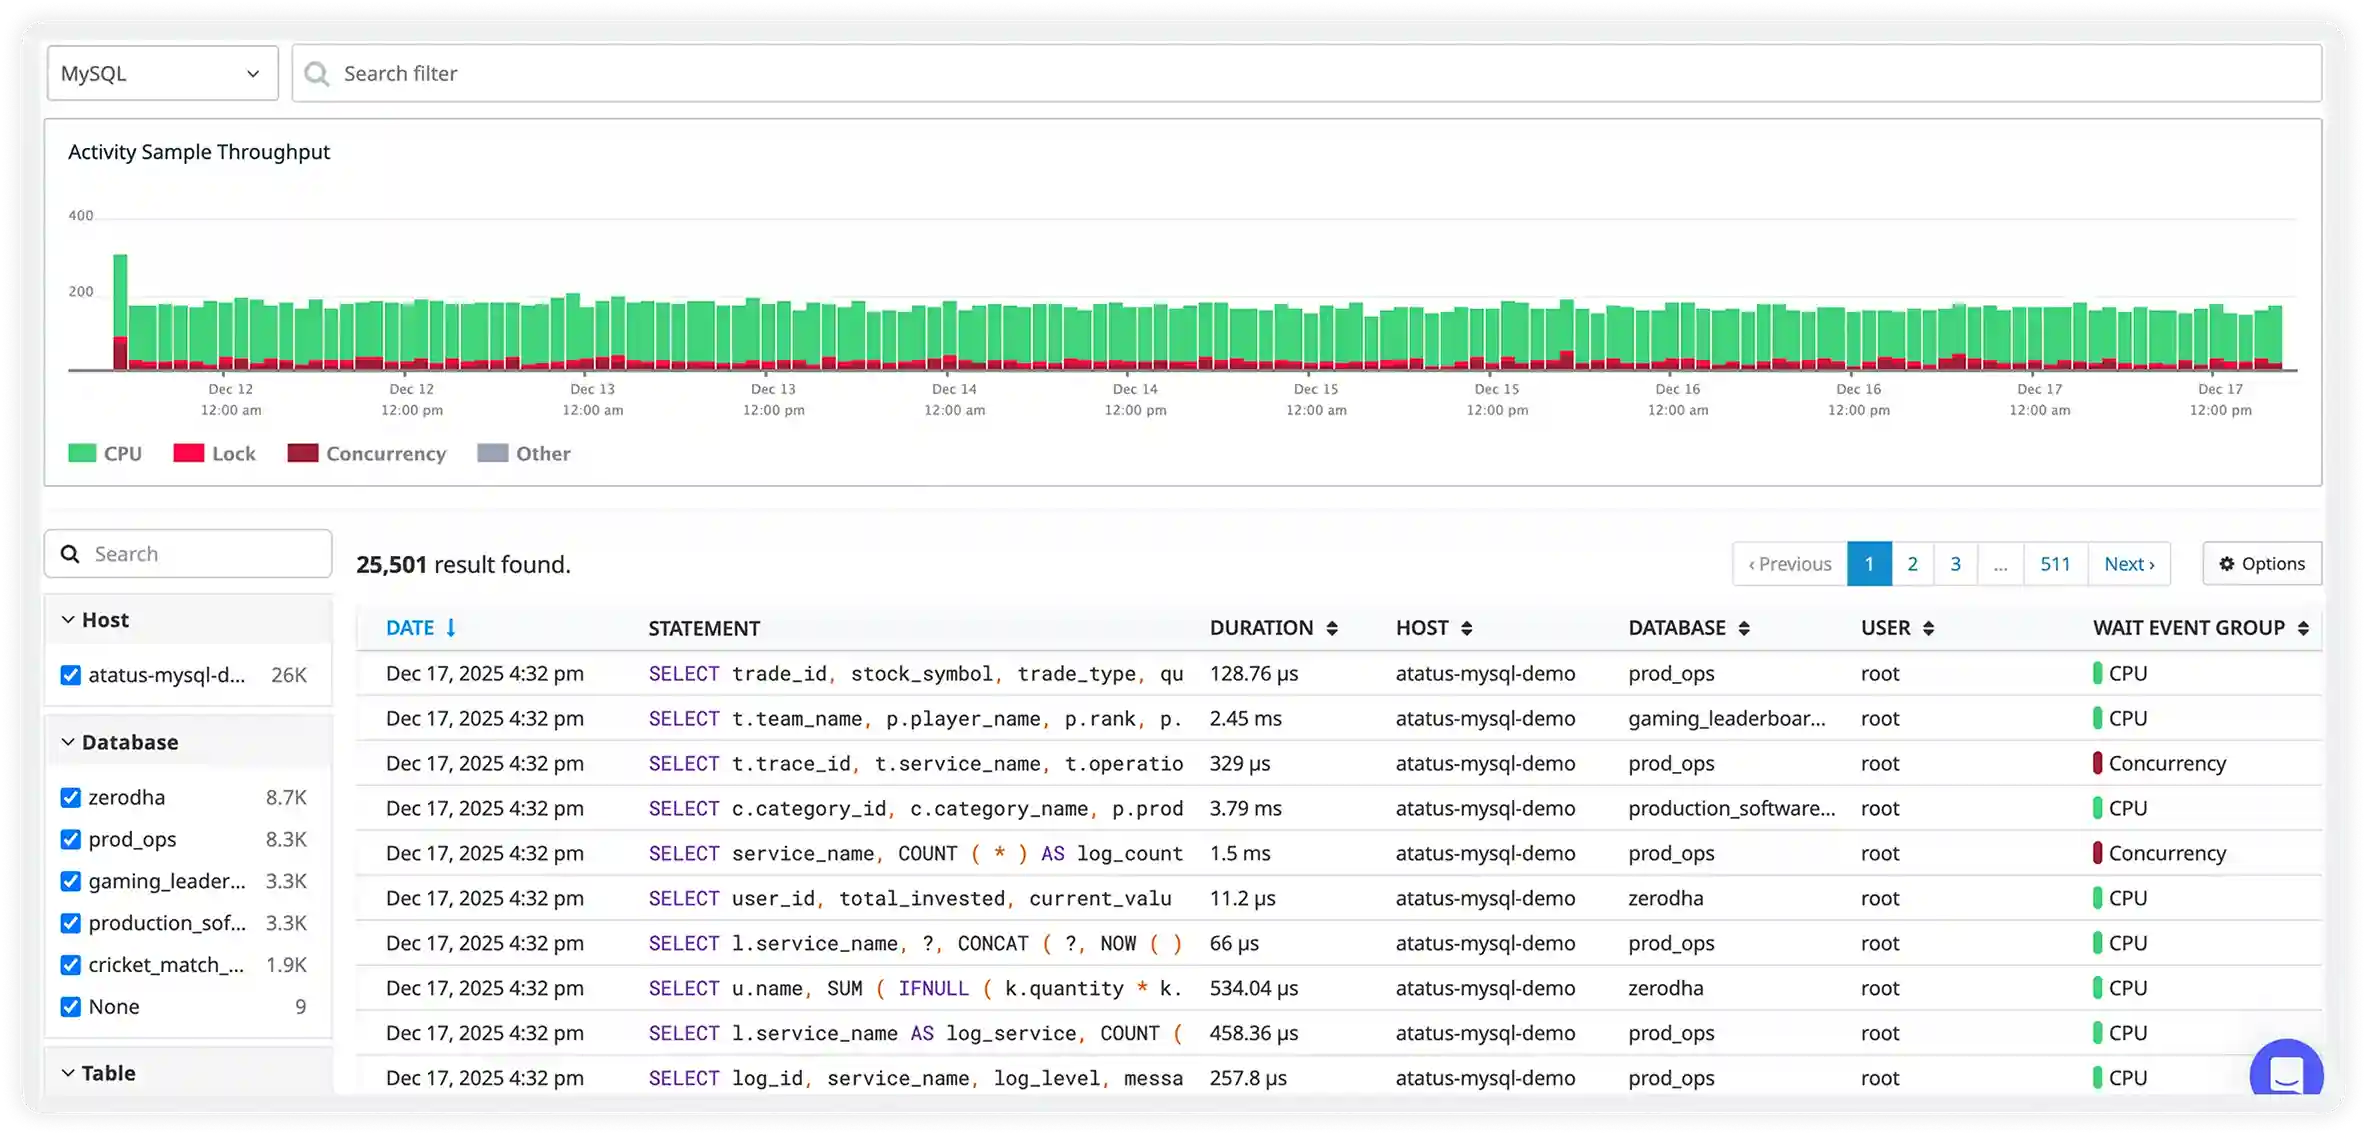
Live Query Activity & Slow Operations
- Capture executed MongoDB queries in real time along with duration, namespace, operation type, and client context to gain complete visibility into production activity.
- Instantly surface slow find, aggregate, update, and insert operations that degrade application responsiveness or increase infrastructure load.
- Filter by collection, operation type, client, or response time to quickly isolate problematic queries and narrow down root causes.
- Understand real production workload behavior across replica sets and clusters to optimize frequently accessed collections and prevent recurring slowdowns.
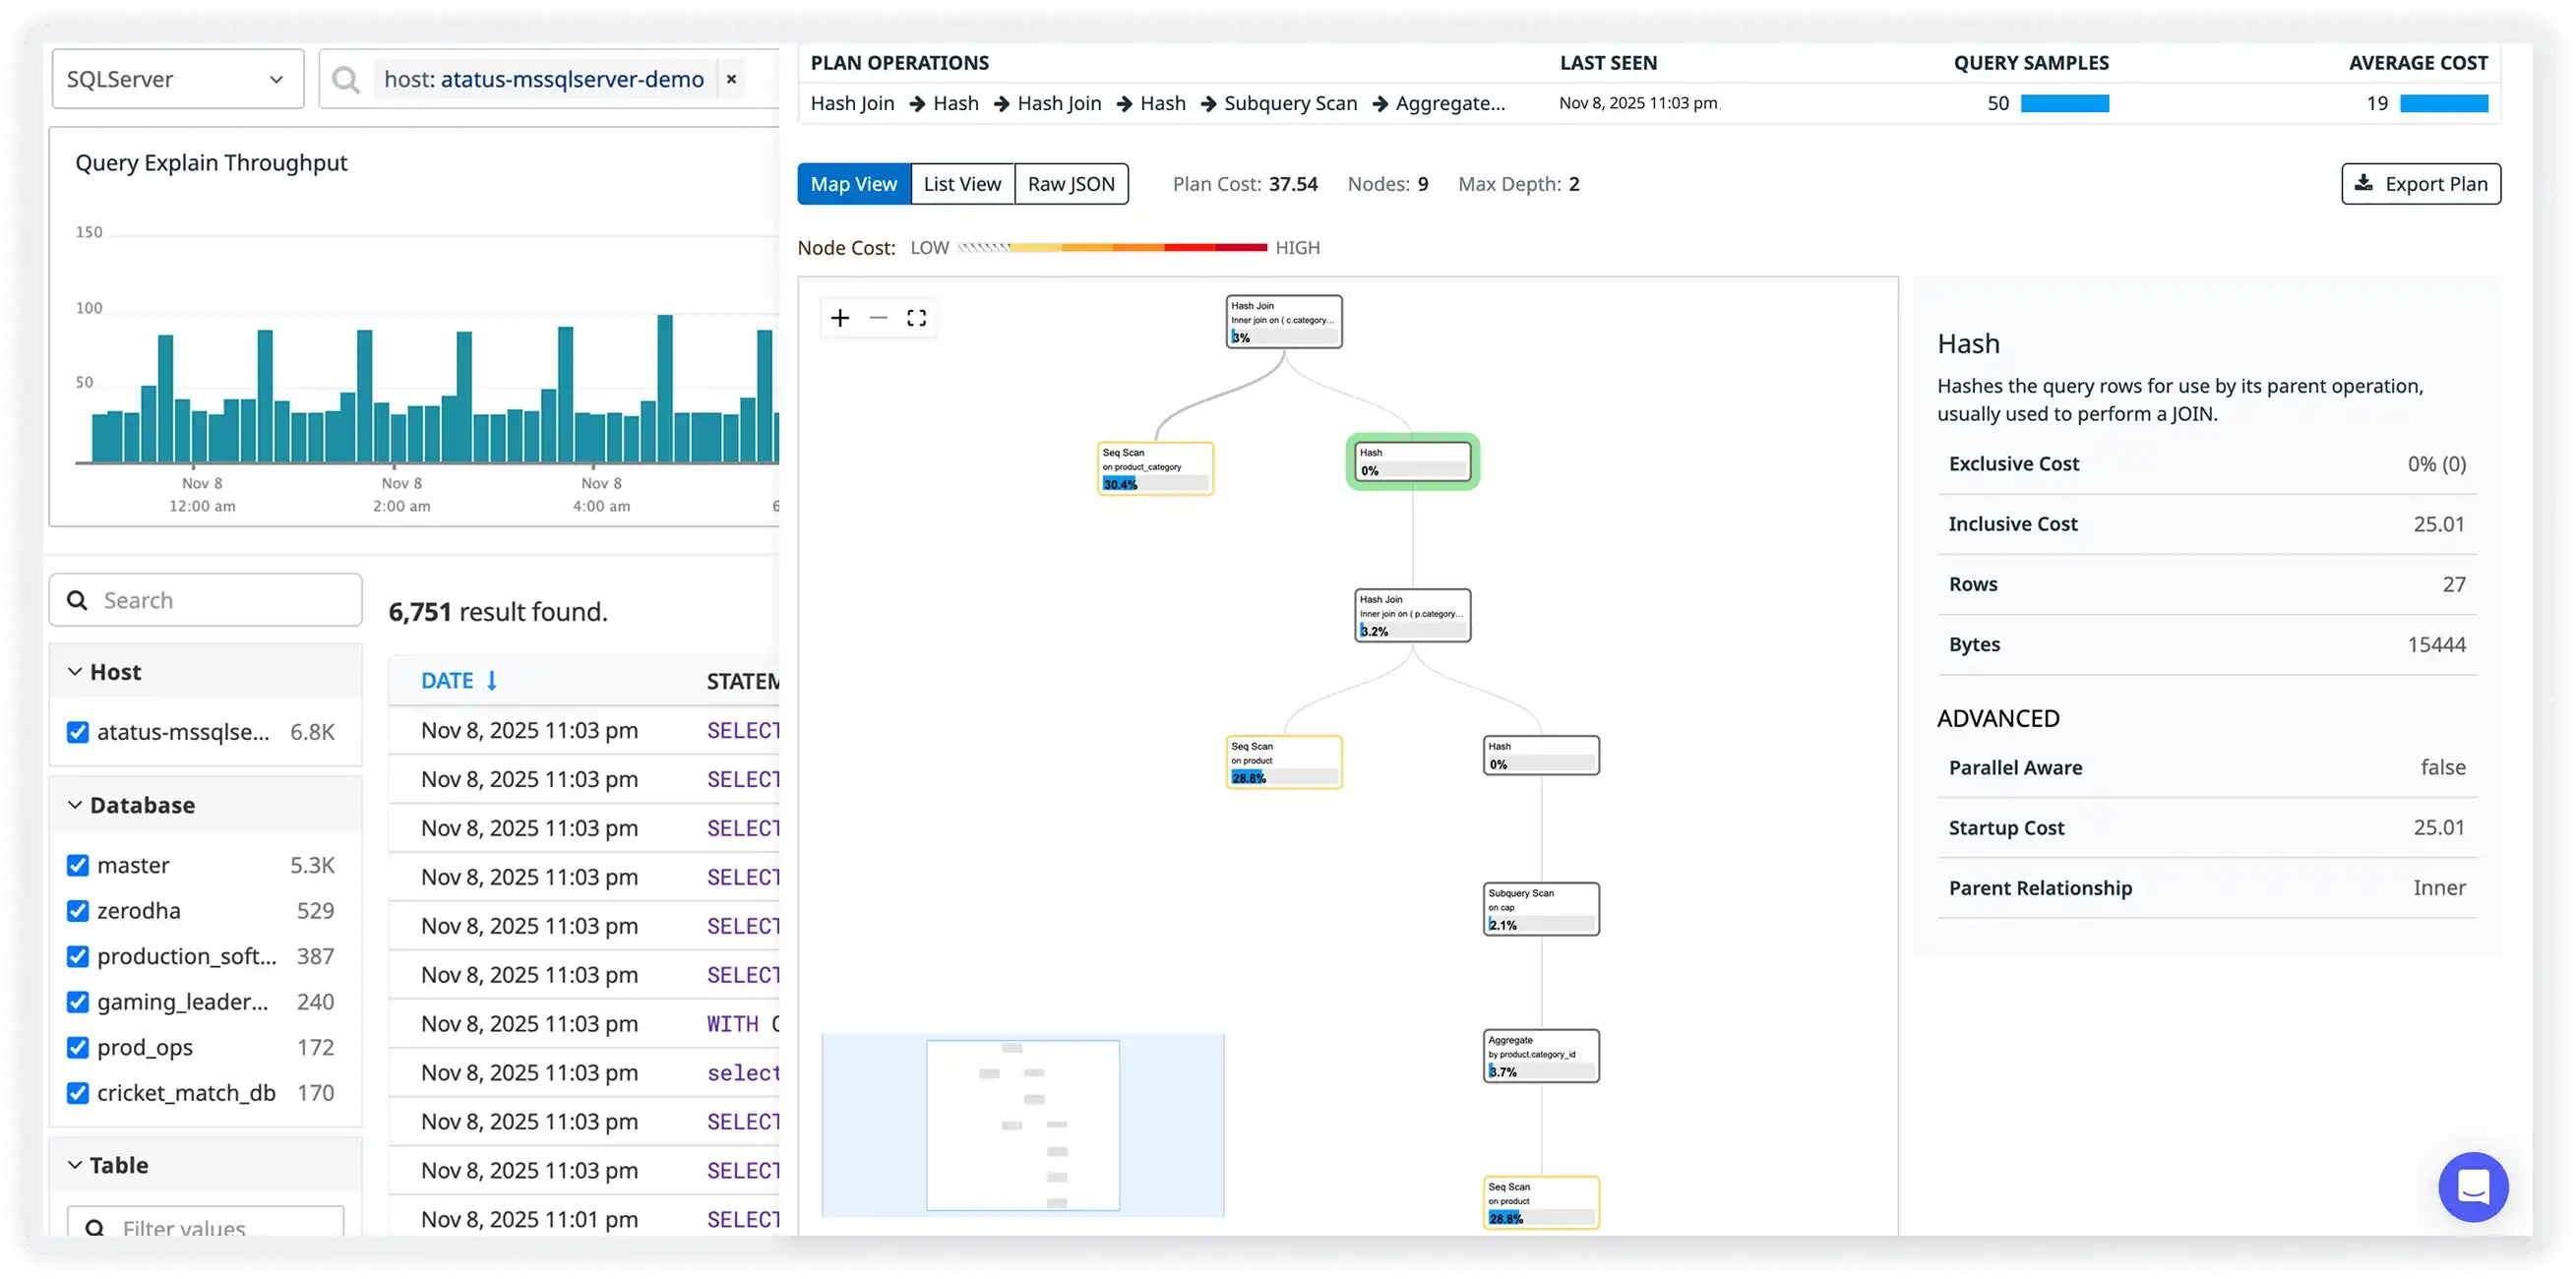
Query Plan & Index Usage Insights
- Visualize MongoDB query plans to clearly see how documents are scanned, filtered, and matched during execution.
- Automatically detect collection scans and inefficient index usage that lead to high latency and unnecessary resource consumption.
- Break down stage-by-stage execution cost within aggregation pipelines to identify expensive operators and processing bottlenecks.
- Optimize queries by validating index effectiveness, refining query structure, and ensuring execution paths are efficient under real workloads.
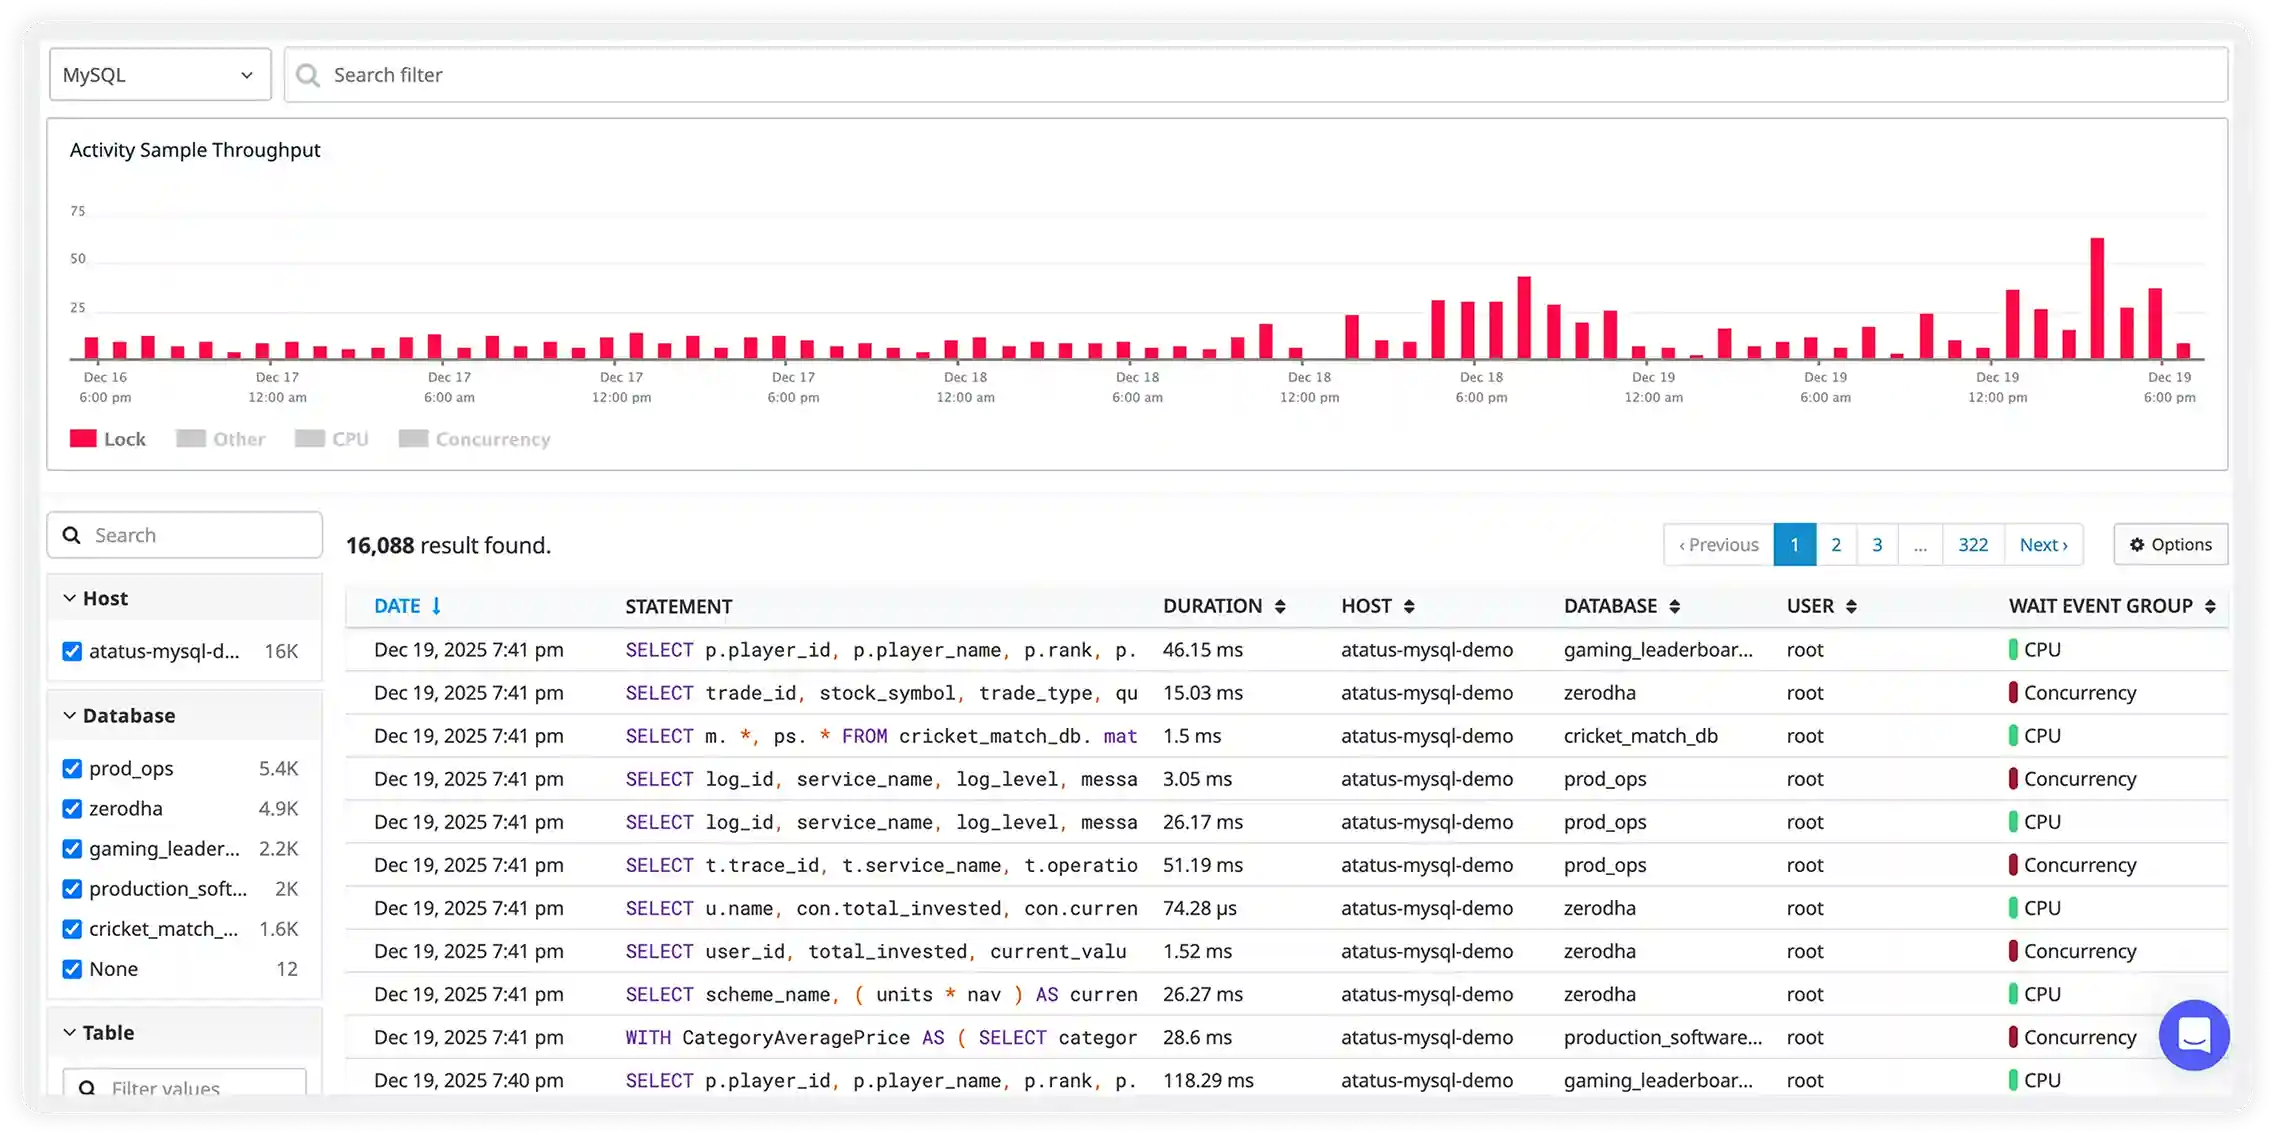
Locking, Contention & Concurrency Visibility
- Monitor global, database, and collection-level lock activity in real time to understand how concurrency impacts throughput.
- Identify operations causing write contention, replication lag, or throughput slowdowns across busy collections.
- Track long-running transactions and blocked operations to prevent cascading delays in high-traffic environments.
- Reduce performance bottlenecks by optimizing high-conflict workloads, improving indexing strategy, and refining transaction patterns.
Why choose Atatus for MongoDB database monitoring?
MongoDB-specific insights
Track collection scans, index usage, cursor behavior, and query execution stages for accurate performance tuning.
Replica set stability
Monitor primary elections, oplog lag, and node state changes to ensure high availability.
Lock contention visibility
Surface global, database, and collection-level locks to uncover write bottlenecks.
Memory pressure detection
Analyze working set size and cache residency to prevent slow reads.
Storage engine health
Observe WiredTiger activity, checkpointing, compaction, and disk usage continuously.
Workload behavior clarity
Track read and write operation rates to understand traffic patterns and scaling needs.
Unified Observability for Every Engineering Team
Atatus adapts to how engineering teams work across development, operations, and reliability.
Developers
Trace requests, debug errors, and identify performance issues at the code level with clear context.
DevOps
Track deployments, monitor infrastructure impact, and understand how releases affect application stability.
Release Engineer
Measure service health, latency, and error rates to maintain reliability and reduce production risk.