9 Ways to Improve Node.js Performance

Node.js is the most popular tool for developing server applications in JavaScript, the world's most widely used programming language. Node.js is now regarded as a critical tool for all types of microservices-based development and delivery, as it has the capabilities of both a web server and an application server.
In any web application, performance is critical. Faster performance in any web application improves the user experience and leads to increased revenue, which makes business owners pleased.
This article will look at several practices you can use to improve your Node.js performance.
Here’s how it is done:
- Monitor and Profile Your Application
- Load Balancing
- Optimizing Data Handling Methods
- Reduce Latency Through Caching
- SSL/TLS and HTTP/2
- Use Timeouts
- Secure Client-side Authentication
- Using WebSockets to Communicate with the Server
- Improve Throughput through Clustering
#1 Monitor and Profile Your Application
To better understand overall performance, you should measure and monitor the Node.js performance of your existing Node application.
You can easily improve your web application to achieve optimal performance once you are aware of its performance. The following are a few critical considerations for product owners who want to make their web applications extremely scalable.
- Endurance Test
This test will assist you in resolving difficulties with web application load capacity. It also solves memory leakage problems. - Load Testing
It is a method of determining the application's load by measuring the application's responses and use. You can also determine how much load the system can withstand before failing (error). - Scalability Testing
Scalability testing is an important test that can assist every business category to scale its operations. You can use this testing to find and fix errors and bugs that prevent your web application from scaling. - Spike Testing
It helps in the testing of an application's behavior when it is subjected to a significant rise or drop in load. - Stress Testing
It is developed to determine how well a system functions outside of regular working conditions. Its purpose is to figure out how much the system can tolerate before failing and how it recovers after failing. - Volume Testing
It determines whether or not a system can handle large amounts of data.
Response times, average latency, error rates, requests per second, throughput, CPU and memory usage, concurrent users, and other critical metrics can be obtained by running some or all of the above tests.
Remember to rerun the tests after you've implemented a specific optimization to ensure that your changes had the expected effect on system performance.
Using an Application Performance Monitoring (APM) tool is also critical to maintaining track of a system's performance in the field. This can be taken care of via a variety of monitoring solutions.
Atatus provides Node.js performance monitoring to give you a complete picture of your clients' end-user experience. You can determine the source of delayed response times, database queries, and other issues by identifying backend performance bottlenecks for each API request.
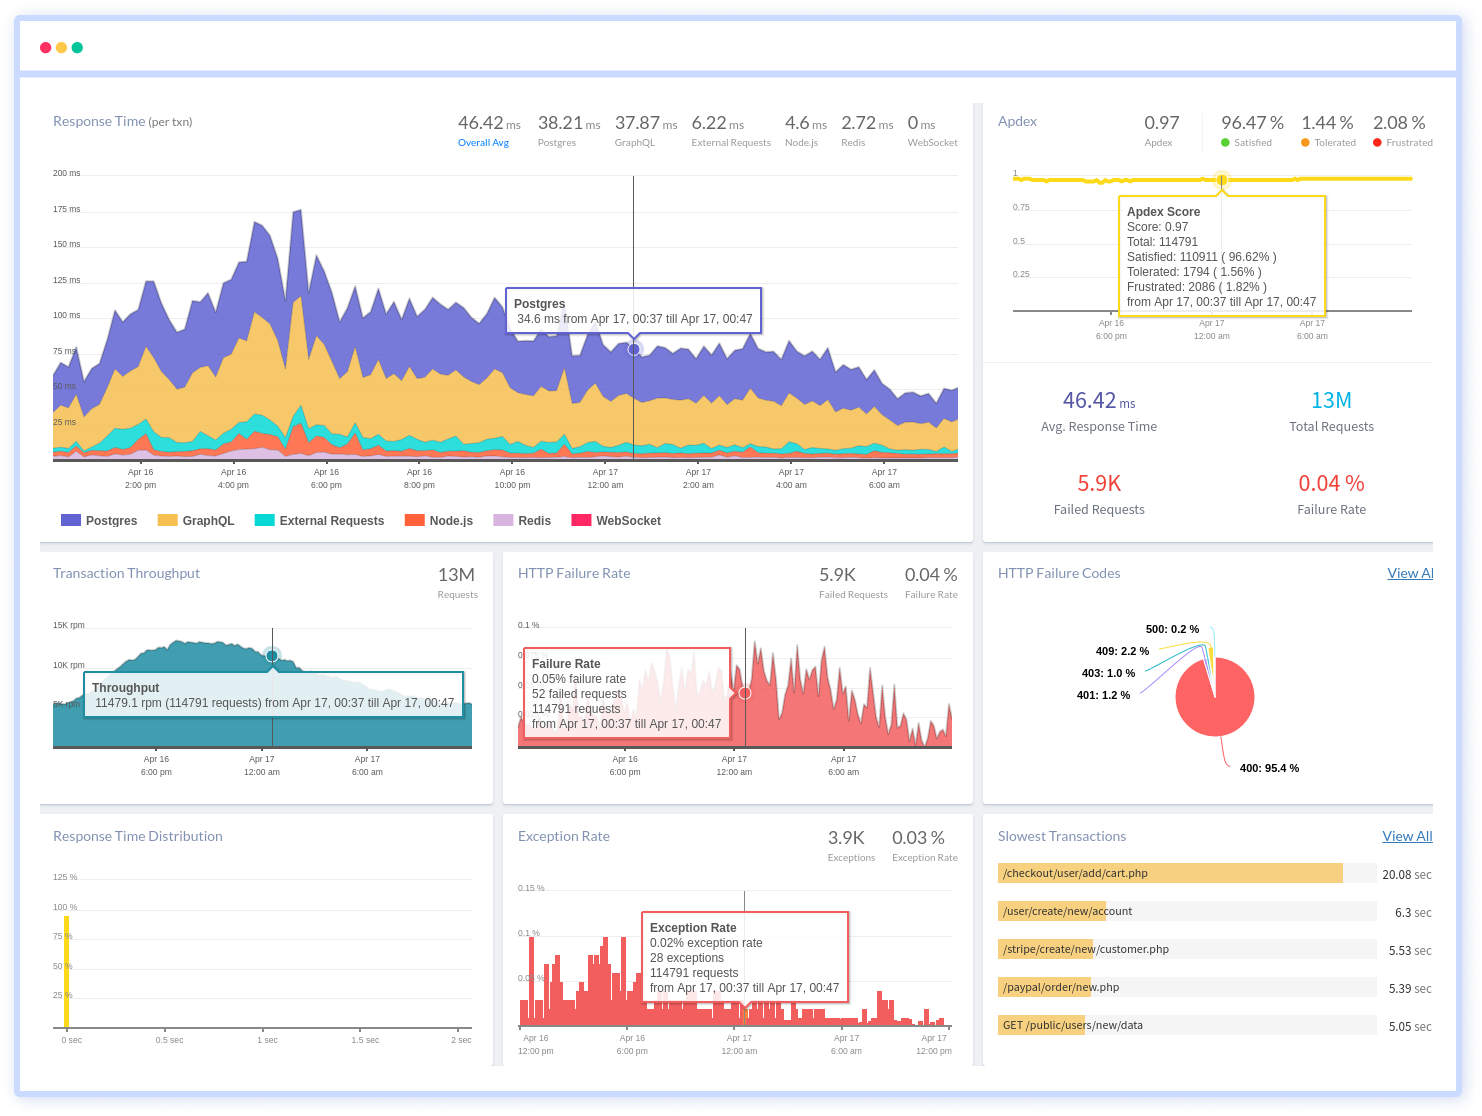
To make bug fixing easier, every Node.js error is captured with a full stack trace and marked the specific line of source code. To assist you in resolving the Node.js error, look at the user activities, console logs, and all Node.js requests that occurred at the moment. Error and exception alerts can be sent by email, Slack, PagerDuty, or webhooks.
#2 Load Balancing

It's a typical challenge to create performant applications that can handle a huge number of incoming connections. To balance the connections, one frequent option is to disperse the traffic. Load balancing is the term for this method.
Fortunately, you can duplicate an application instance with Node.js to accommodate multiple connections. This can be accomplished with a single multicore server or several servers.
You can use the introduced cluster module to scale the Node.js application on a multicore server by spawning new processes called workers (one for each CPU core) that all run simultaneously and connect to a single master process, sharing the same server port.
As a result, it acts as a single large multithreaded Node.js server. You can use the cluster module to allow load balancing and distribute incoming connections across all workers in an environment's numerous CPU cores using a round-robin technique.
Using the PM2 process manager to keep applications alive indefinitely is another option. This prevents downtime by restarting the application whenever a code update or error occurs. PM2 includes a cluster feature that allows you to run numerous processes over all cores without having to worry about changing the code to use the native cluster module.
The single-cluster design has downsides, and we must plan to go from a single-server architecture to a multiserver architecture with reverse proxy load balancing.
NGINX allows load balancing over several Node.js servers, as well as a variety of load balancing methods, such as:
- Round-robin
The next server in the list receives a new request. - Least Connections
The server with the fewest active connections receives a new request. - IP Hash
The client's IP address hashed sends a new request to the server.
When employing several application servers, the reverse proxy feature protects the Node.js server from direct internet traffic and allows you a lot of flexibility.
#3 Optimizing Data Handling Methods
Optimization is critical to performance because it streamlines system procedures and improves overall application efficiency. What aspects of a Node.js application can be improved?
Begin by examining how data is handled. A CPU/IO-bound task, such as a database query or a slow API request, might cause Node.js applications to be slow. In most Node.js applications, data is retrieved by issuing an API request and receiving a response. What's the best way to achieve that?
Pagination – splitting replies into batches of content that can be browsed via selected-response requests — is a typical strategy. Pagination can be used to improve response times while preserving the bigger amount of data sent to the user client.
Filtering is another useful strategy, as it allows the requester to limit the results based on his or her criteria. This not only reduces the overall number of calls and the number of results displayed, but it also allows users to more precisely determine whether resources are offered depending on their needs.
In REST API design, these two concepts are frequently used. Data is fetched in two ways: Underfetching and Overfetching. The former offers more data than the client requires, whereas the latter fails to supply necessary data, requiring a subsequent call to a different endpoint to finish the data collection.
These two issues can arise on the client-side as a result of insufficient application scaling. GraphQL is useful in this situation because the server doesn't have to guess what the client wants; the client specifies their request and receives exactly what they want.
#4 Reduce Latency Through Caching
One of the most common strategies for enhancing the performance of a web application is server-side caching. Its main goal is to improve data retrieval speed by either spending less time calculating data or executing I/O (such as retrieving such data over the network or from a database).
A cache is a high-speed storage layer that serves as a temporary storage location for data that is often accessed. You don't have to get data from the primary source (which is usually slower) every time it's needed.
For data that does not change regularly, caching is the ideal option. If your application receives a large number of requests for the same unaltered data, caching it will almost certainly enhance the responsiveness of those requests.
You can also cache the results of computationally intensive activities as long as the cache can be reused for other queries. This avoids clogging up server resources unnecessarily by repeating the work required to compute such data.
API queries to an external system are another typical candidate for caching. Assume that the responses can be safely reused for future requests. To prevent the additional network request and any other costs associated with the API in issue, it makes sense to store API requests in the cache layer.
An in-process caching solution, such as node-cache, is a reasonably simple approach to implementing caching in a Node.js application. It involves storing frequently used data in memory so that it can be retrieved faster.
The main disadvantage of an in-process cache is that it is bound to a single application process, making it unsuitable for distributed workflows (especially when caching mutable objects).
You can utilize a distributed caching solution like Redis or Memcached in these situations. These execute independently of an application and are more viable when the application is scaled across numerous servers.
#5 SSL/TLS and HTTP/2
You can utilize HTTP/2 in a Node.js application to make web browsing faster and easier while reducing bandwidth usage. HTTP/2 is aimed at increasing performance and addressing concerns with HTTP/1.x.
HTTP/2 has the following features:
- Header Compression
This disables unnecessary headers and compels all HTTP headers to be sent compressed. - Multiplexing
This allows multiple requests to simultaneously retrieve resources and response messages over a single TCP connection.
Multiplexing is used to reduce the number of requests sent to the server. Frequently, the time it takes to create an HTTP connection is more expensive than the time it takes to transfer data.
The Transport Layer Security (TLS) and Secure Socket Layer (SSL) protocols are required to use HTTP/2.
#6 Use Timeouts
Timeouts are one of the easiest things to get wrong when developing Node.js applications. Your server is most likely communicating with other external services, which may in turn be communicating with other services.
If one of the services in the chain is slow or unresponsive, your end-users will have a slow experience. Even if you don't have this issue during development, you can't always expect your dependencies to reply as quickly as they typically do, which is why timeouts are so crucial.
A timeout is the maximum amount of time a request can wait. It shows how long a client is willing to wait for an external service to respond. The connection will abort if the response is not received within the set time limits, ensuring that the application does not stall endlessly.
Many popular Node.js libraries for making HTTP calls (such as Axios) have no default timeout, which means that any remote API can keep your application waiting indefinitely for the requested data. To prevent this from occurring, you should establish a request timeout:
const axios = require("axios");
axios.defaults.timeout === 2000;
A timeout of 2000ms (2s) is set as the default for all HTTP requests made by Axios in the above snippet. This ensures that no request will take more than that amount of time, even if the API is unavailable.
When the global default isn't acceptable, you can alternatively set a timeout value for individual requests:
axios
  .get("https://example.com/api", {
    timeout: 4000
  })
  .then((response) => {
    console.log(response);
  })
  .catch((error) => {
    console.log(error);
  });
It's important to note that the Axios timeout value is a read timeout, not a connection timeout. The former affects how long the client will wait for a response after the connection is established, while the latter determines how quickly a TCP connection must be created.
The connection timeout is usually substantially less than the read timeout. If one service is taking too long to accept a connection, the client can try a different server or API. Once the connection is approved, the server will have enough time to generate a response.
Currently, Axios does not allow you to define a connection timeout apart from a read timeout, which can be restricted in some circumstances. If you require this feature, you can use the got library, which allows you to specify separate read and connection timeouts.
You can use specialized tools to monitor the response timings of APIs you connect to or log your API requests before deciding on a timeout number. This will enable you to make informed choices about all external services with which your application interacts. Important services should also have a retry policy in place to deal with temporary slowdowns.
#7 Secure Client-side Authentication
To provide users with a tailored experience, most web applications must preserve the state. If users can log in to your website, you'll need to keep track of their sessions.
You would normally produce a random session identifier to keep the session details on the server when implementing stateful authentication. You can use a central storage solution like Redis to store session data or the IP hash approach to ensure that the user always reaches the same web server when scaling a stateful solution to a load-balanced application over numerous servers.
There are some disadvantages to taking such a stateful strategy. Limiting users to a single server, for example, can cause problems if that server requires maintenance.
Another scalable approach, stateless authentication with JWT, is probably better. The benefit is that data is always accessible, no matter which system is servicing a user.
When a user logs in, a typical JWT implementation generates a token. This token is a base64 encoding of a JSON object that contains the required user information. The client receives the token, which is used to authenticate all API requests.
#8 Using WebSockets to Communicate with the Server
The HTTP request/response model has long been the foundation of the internet. In web applications, WebSockets are an alternative to HTTP communications. They allow the client and server to communicate in a bidirectional, long-lasting manner.
If the channel is established, it is kept open, allowing the client and server to communicate quickly and reliably. Both sides can begin sending data with minimal delay and overhead at any time.
HTTP is effective for data sharing and client-driven communication with user interaction on a limited basis. With WebSockets, the server can transmit a message to the client without the client making an explicit request, allowing them to communicate at the same time.
This is ideal for real-time and long-term communication. ws is a popular Node.js module that may be used to create a WebSockets server. JavaScript is used on the front end to connect to a WebSockets-enabled server and listen for events.
Keeping a large number of connections open at once requires a high-competition architecture with a low-performance cost, which WebSockets provides.
#9 Improve Throughput through Clustering
Clustering is a technique for scaling a Node.js server horizontally on a single computer by spawning child processes (workers) that run in parallel and share a single port.
It's a common strategy for reducing downtime, slowdowns, and outages by distributing incoming connections over all available worker processes, maximizing the use of available CPU cores. Since Node.js runs on a single thread, it can't take full use of multi-core platforms, requiring clustering.
The cluster module in the standard library allows you to cluster your Node.js server. An example from the official documentation is as follows:
const cluster = require("cluster");
const http = require("http");
const process = require("process");
const os = require("os");
const cpus = os.cpus;
const numCPUs = cpus().length;

if (cluster.isPrimary) {
  console.log(`Primary ${process.pid} is running`);

  // Fork workers.
  for (let i = 0; i < numCPUs; i++) {
    cluster.fork();
  }

  cluster.on("exit", (worker, code, signal) => {
    console.log(`worker ${worker.process.pid} died`);
  });

} else {

  // Workers can share any TCP connection
  // In this case it is an HTTP server
  http
    .createServer((req, res) => {
      res.writeHead(200);
      res.end("hello world\n");
    })
    .listen(8000);

  console.log(`Worker ${process.pid} started`);
}
Connections sent to port 8000 will be shared across the worker processes once you run this program. As a result, the application will be able to manage requests more efficiently:
$ node server.js
Primary 15990 is running
Worker 15997 started
Worker 15998 started
Worker 16010 started
Worker 16004 started
One disadvantage of utilizing Node.js' native cluster module is the amount of code required to launch and manage the workers, as well as the inability to change the number of processes on the fly.
Use the PM2 process manager for Node.js to handle Node.js clusters more reliably. Under the hood, it employs the cluster module to handle spawning workers, pausing or restarting workers, and dividing incoming load among the workers. It also includes several tools to help you in monitoring and fine-tuning worker processes.
Finally!!!
In this article, we have discussed several practical strategies for improving your Node.js application to handle additional traffic. Before you go ahead and apply a specific optimization, make sure you do thorough performance tests on your system and utilize the results to decide what course of action to take. Use observability/monitoring tools to see the impact of your changes and identify regressions fast and accurately.
Monitor Your Entire Application with Atatus
Atatus Observability Platform lets you review problems as if they happened in your application. Instead of guessing why errors happen or asking users for screenshots and log dumps, Atatus lets you replay the session to quickly understand what went wrong.
We offer Application Performance Monitoring, Real User Monitoring, Serverless Monitoring, Logs Monitoring, Synthetic Monitoring, Uptime Monitoring, and API Analytics. It works perfectly with any application, regardless of framework, and has plugins.
Atatus can be beneficial to your business, which provides a comprehensive view of your application, including how it works, where performance bottlenecks exist, which users are most impacted, and which errors break your code for your frontend, backend, and infrastructure.
If you are not yet an Atatus customer, you can sign up for a 14-day free trial.
#1 Solution for Logs, Traces & Metrics
![]() APM
APM
![]() Kubernetes
Kubernetes
![]() Logs
Logs
![]() Synthetics
Synthetics
![]() RUM
RUM
![]() Serverless
Serverless
![]() Security
Security
![]() More
More

![Application Performance Monitoring (APM) Guide: Monitor and Optimize Application Performance - [2026 Update]](/blog/content/images/size/w960/2025/10/APM-GUIDE---Monitor-and-Optimize-Application-Performance.png)