Ionic Error and Performance Monitoring
Get complete visibility into your Ionic errors and performance issues that are impacting your end user experience. Fix critical issues sooner with in depth data points that helps you in analyzing and resolving issues with great speed.
Master Ionic web component performance and PWA user experience optimization
Ionic web component lifecycle tracking
Monitor ion-button interactions, ion-list virtual scrolling, and component initialization during real Ionic Framework web app sessions.
Ionic routing performance waterfalls
Profile Angular/Vue/React router transitions, lazy page loads, and Ionic nav controller timing in SPAs.
Stencil component render analysis
Measure custom element upgrades, shadow DOM encapsulation, and CSS custom property performance across browsers.
Ionic web runtime error capture
Capture shadow DOM binding failures, web component lifecycle errors, and gesture controller exceptions with full traces.
PWA gesture responsiveness
Detect unresponsive ion-modal presentations, ion-popover triggers, and overlay gesture delays in web deployments.
Component tree correlation
Link user interactions through Ionic web components to underlying framework renders and DOM updates.
PWA service worker insights
Analyze Ionic PWA caching strategies, precaching efficiency, and offline-first performance patterns.
Ionic web optimization
Validate Stencil component tree-shaking, CSS variable performance, and shadow DOM encapsulation efficiency.
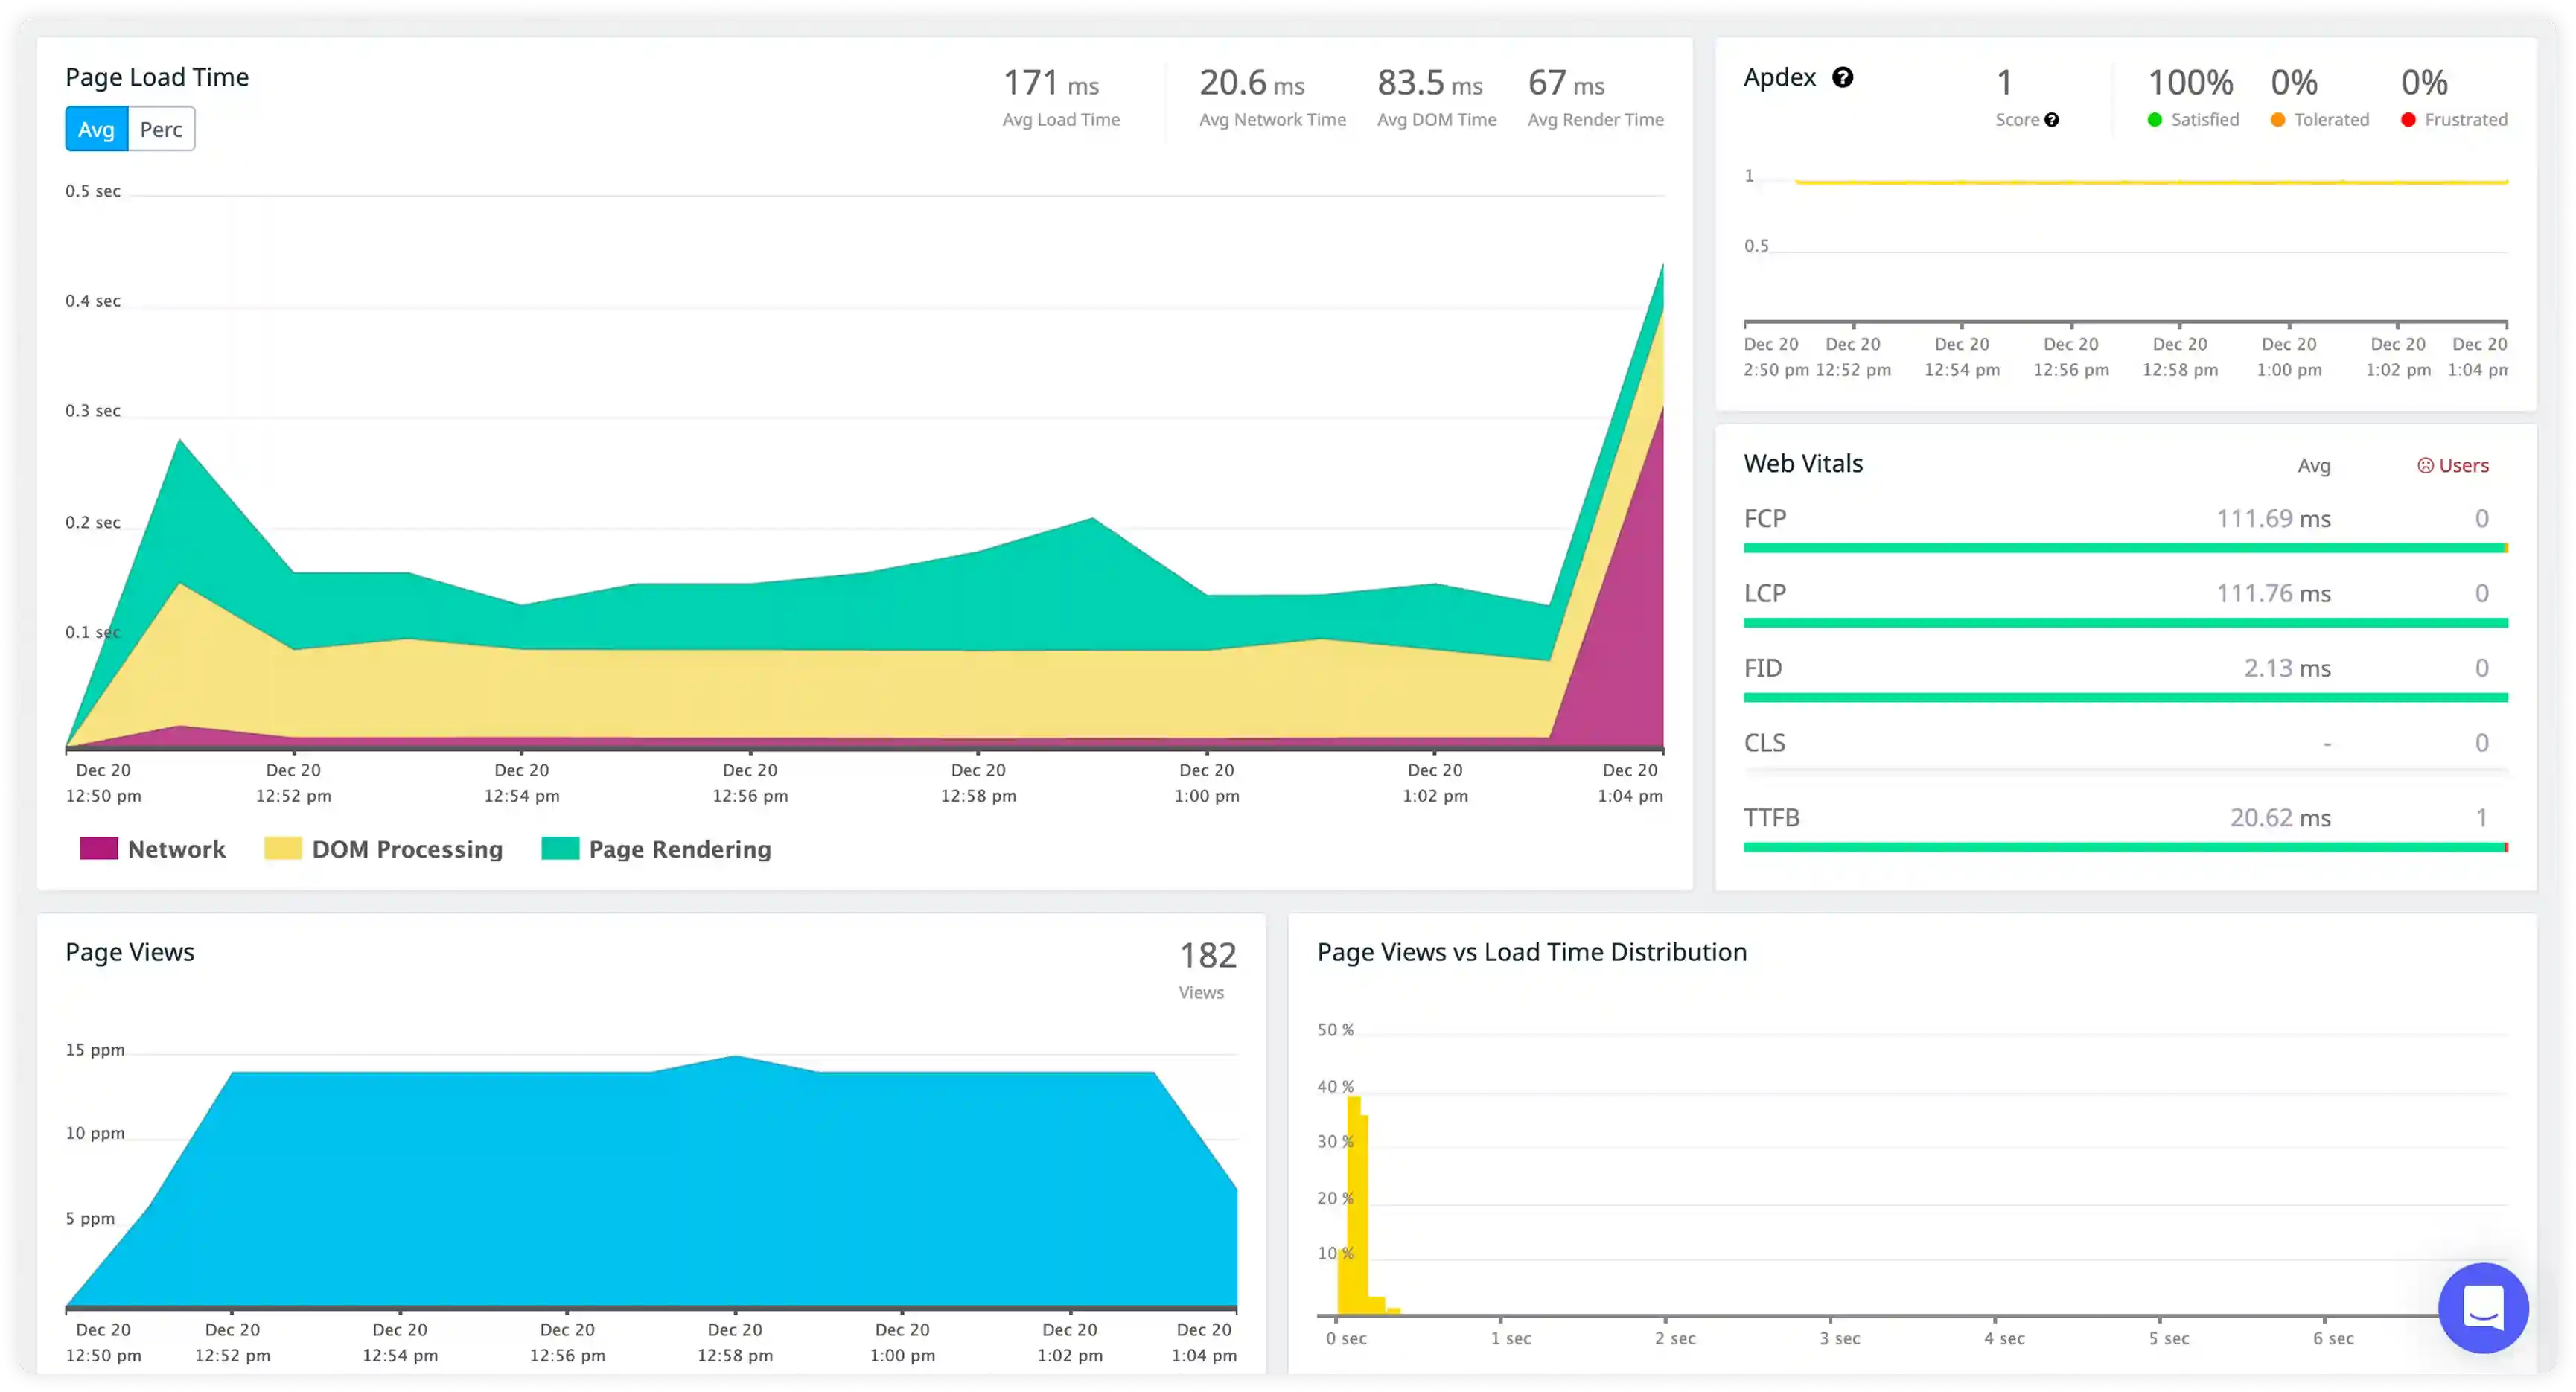
Component Rendering and UI Execution
- Measure component render frequency during real user interactions and correlate execution cost with actual DOM update latency to understand UI performance impact.
- Identify repeated UI updates triggered by state changes or navigation events that do not result in meaningful visual differences.
- Analyze rendering performance across devices and platforms including Android, iOS, and web to surface platform-specific bottlenecks.
- Detect rendering slowdowns and bottlenecks that affect interaction responsiveness, frame stability, and smooth scrolling.
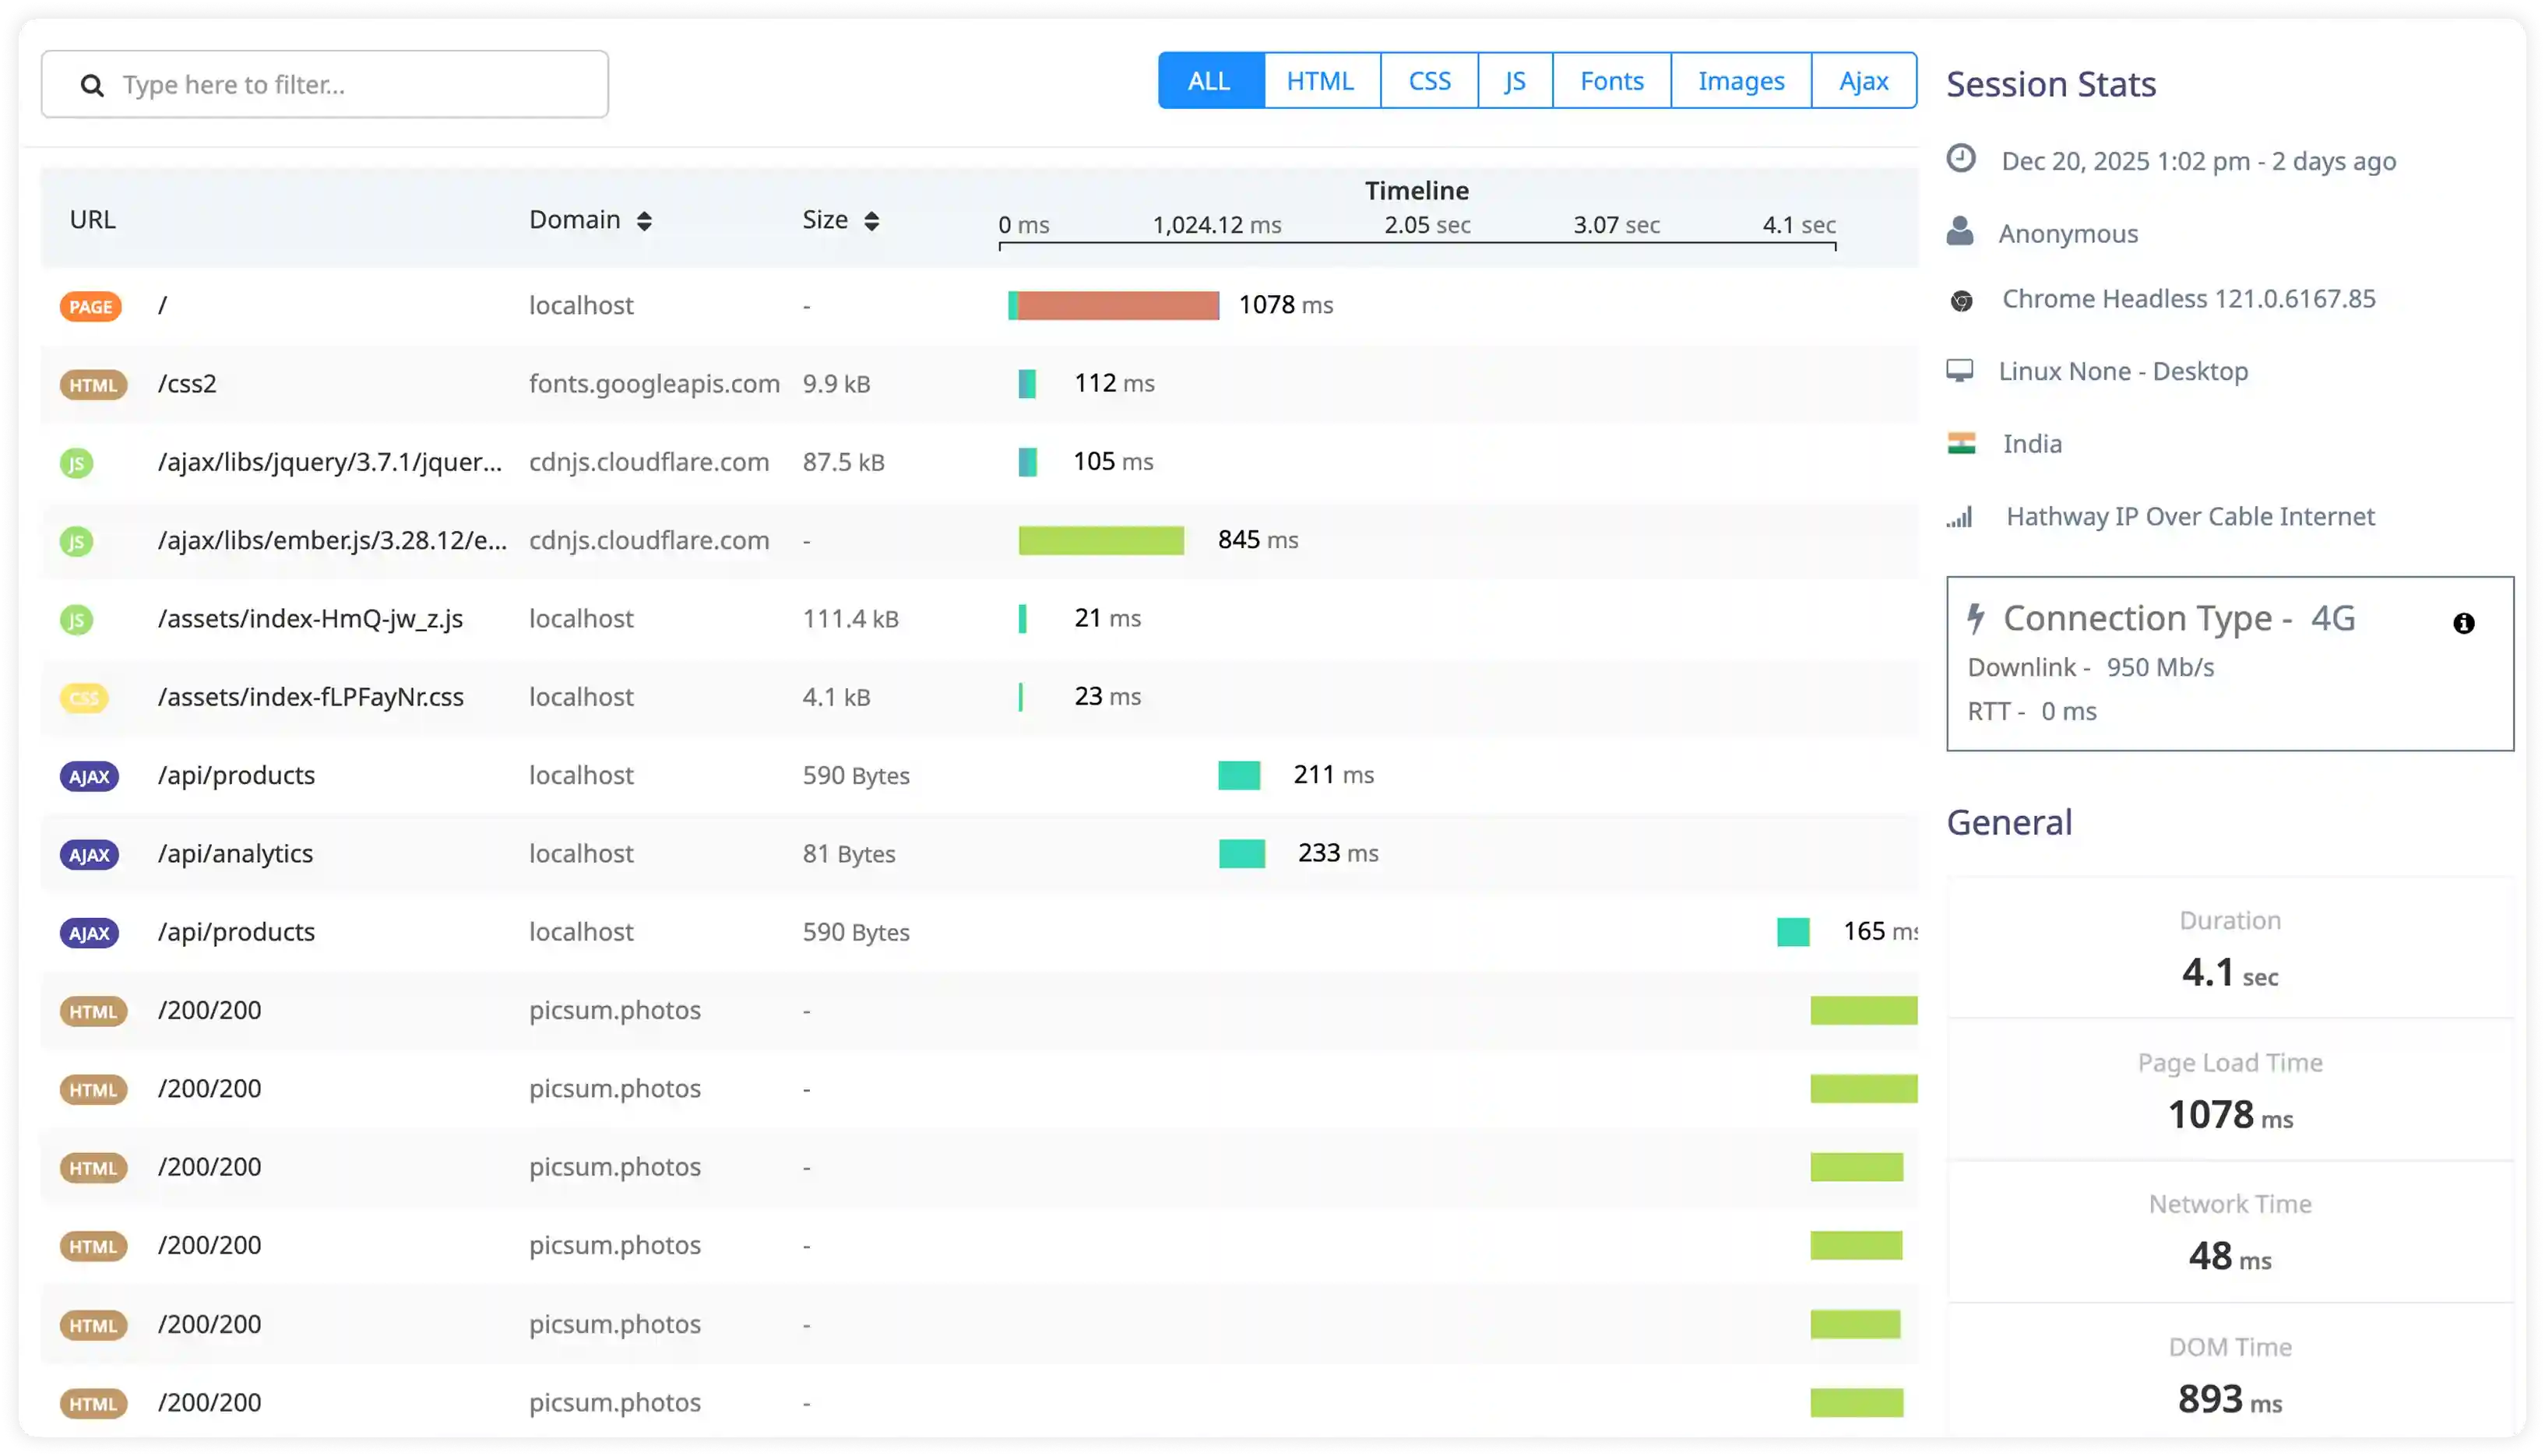
Navigation and View Lifecycle Execution
- Break down navigation timing across route transitions, view initialization steps, and component mount phases.
- Measure the delay between navigation triggers and full screen readiness to identify slow transition paths.
- Identify blocking operations during lifecycle events such as data loading or heavy logic that delay UI rendering.
- Correlate navigation execution timing with workflow interruption, perceived latency, and interaction lag.
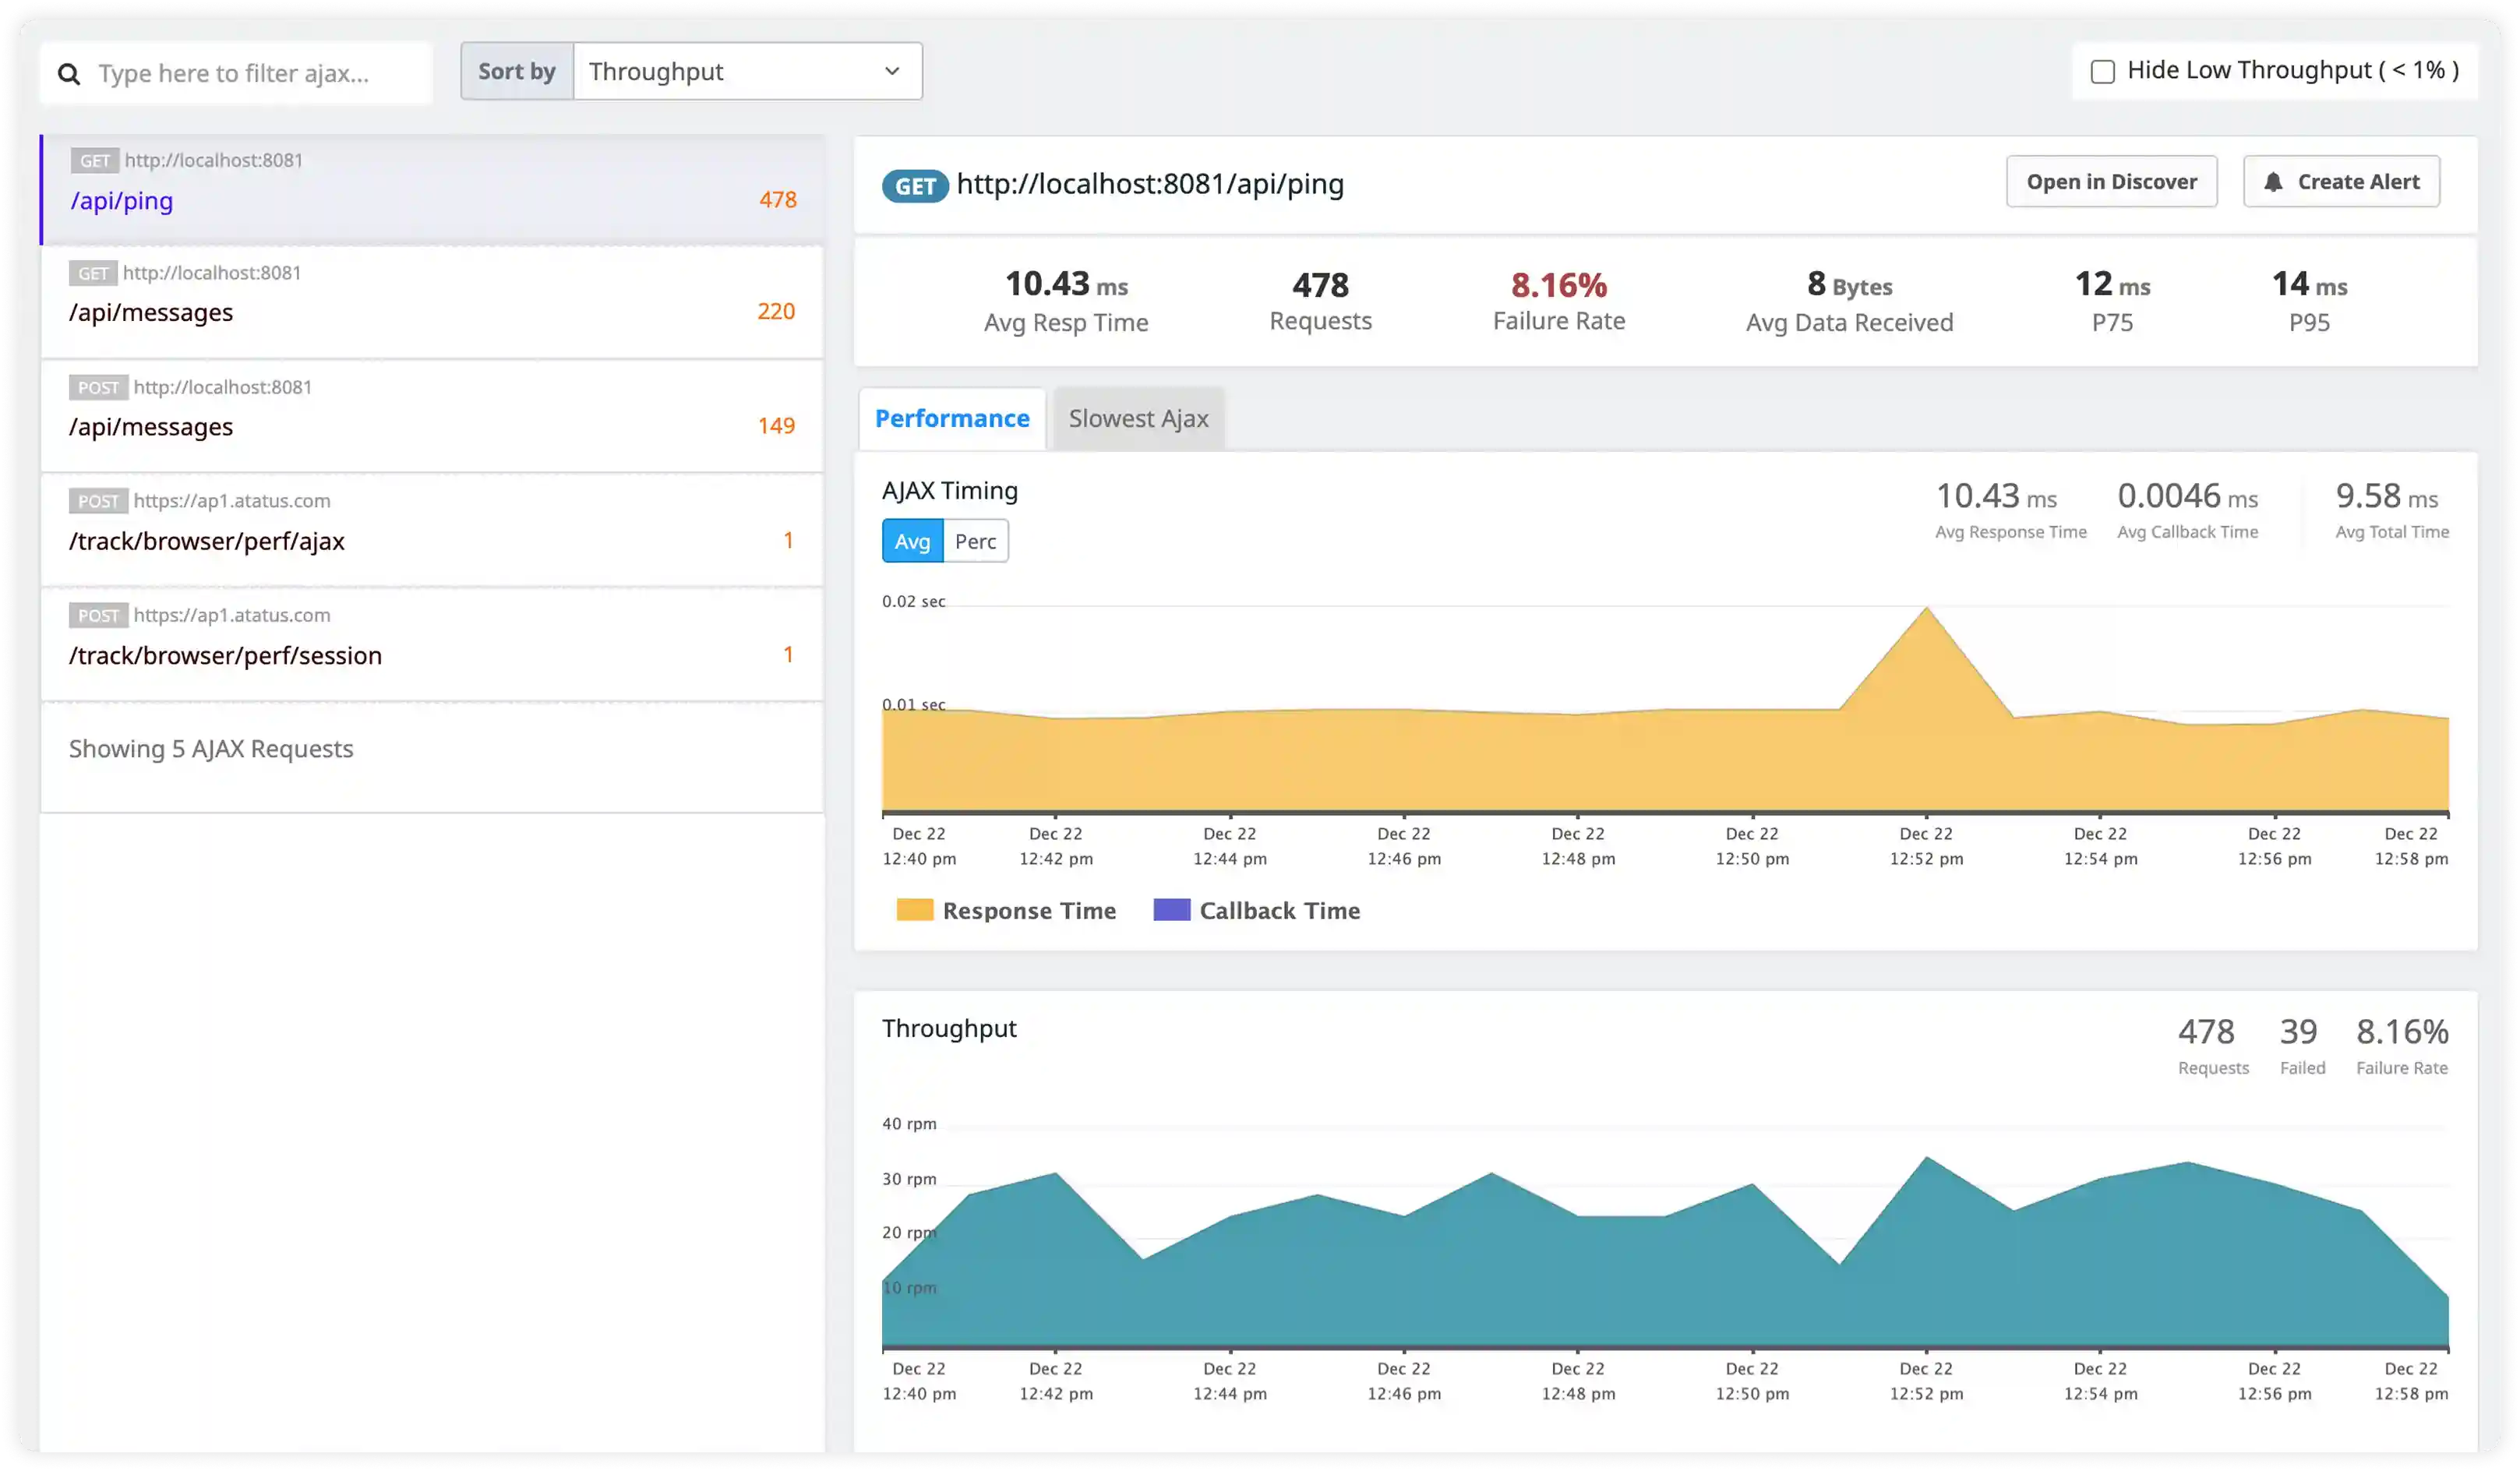
Asynchronous and Plugin Execution
- Track asynchronous execution from API requests, native plugin calls, background tasks, and scheduled operations.
- Measure the delay between async completion and resulting UI updates triggered by state changes.
- Identify concurrent async operations that compete for resources and impact rendering performance.
- Correlate plugin execution timing with overall app responsiveness, smoothness, and stability.
State and Data Handling Execution
- Measure latency between state updates and UI rendering across multiple components, views, and navigation flows to understand end-to-end data propagation speed.
- Identify redundant state propagation, circular updates, and over-broadcasting that trigger repeated re-renders and unnecessary DOM processing.
- Analyze data flow between services, components, local storage layers, and remote APIs in detail to surface bottlenecks and inefficient transfer paths.
- Detect data synchronization delays, stale state updates, and race conditions that negatively affect user interactions, screen stability, and overall performance.
Why Choose Atatus for Ionic RUM?
Optimize Ionic web component performance, PWA caching, and SPA navigation without framework changes
Built for Ionic web components
Native monitoring of Stencil components, shadow DOM lifecycle, and CSS custom property execution.
Ionic web diagnostics
Web component render waterfalls, shadow DOM traces, and gesture controller performance analysis.
Zero-config web integration
Automatic instrumentation for Ionic 7+ web apps with Angular/Vue/React—no build system modifications.
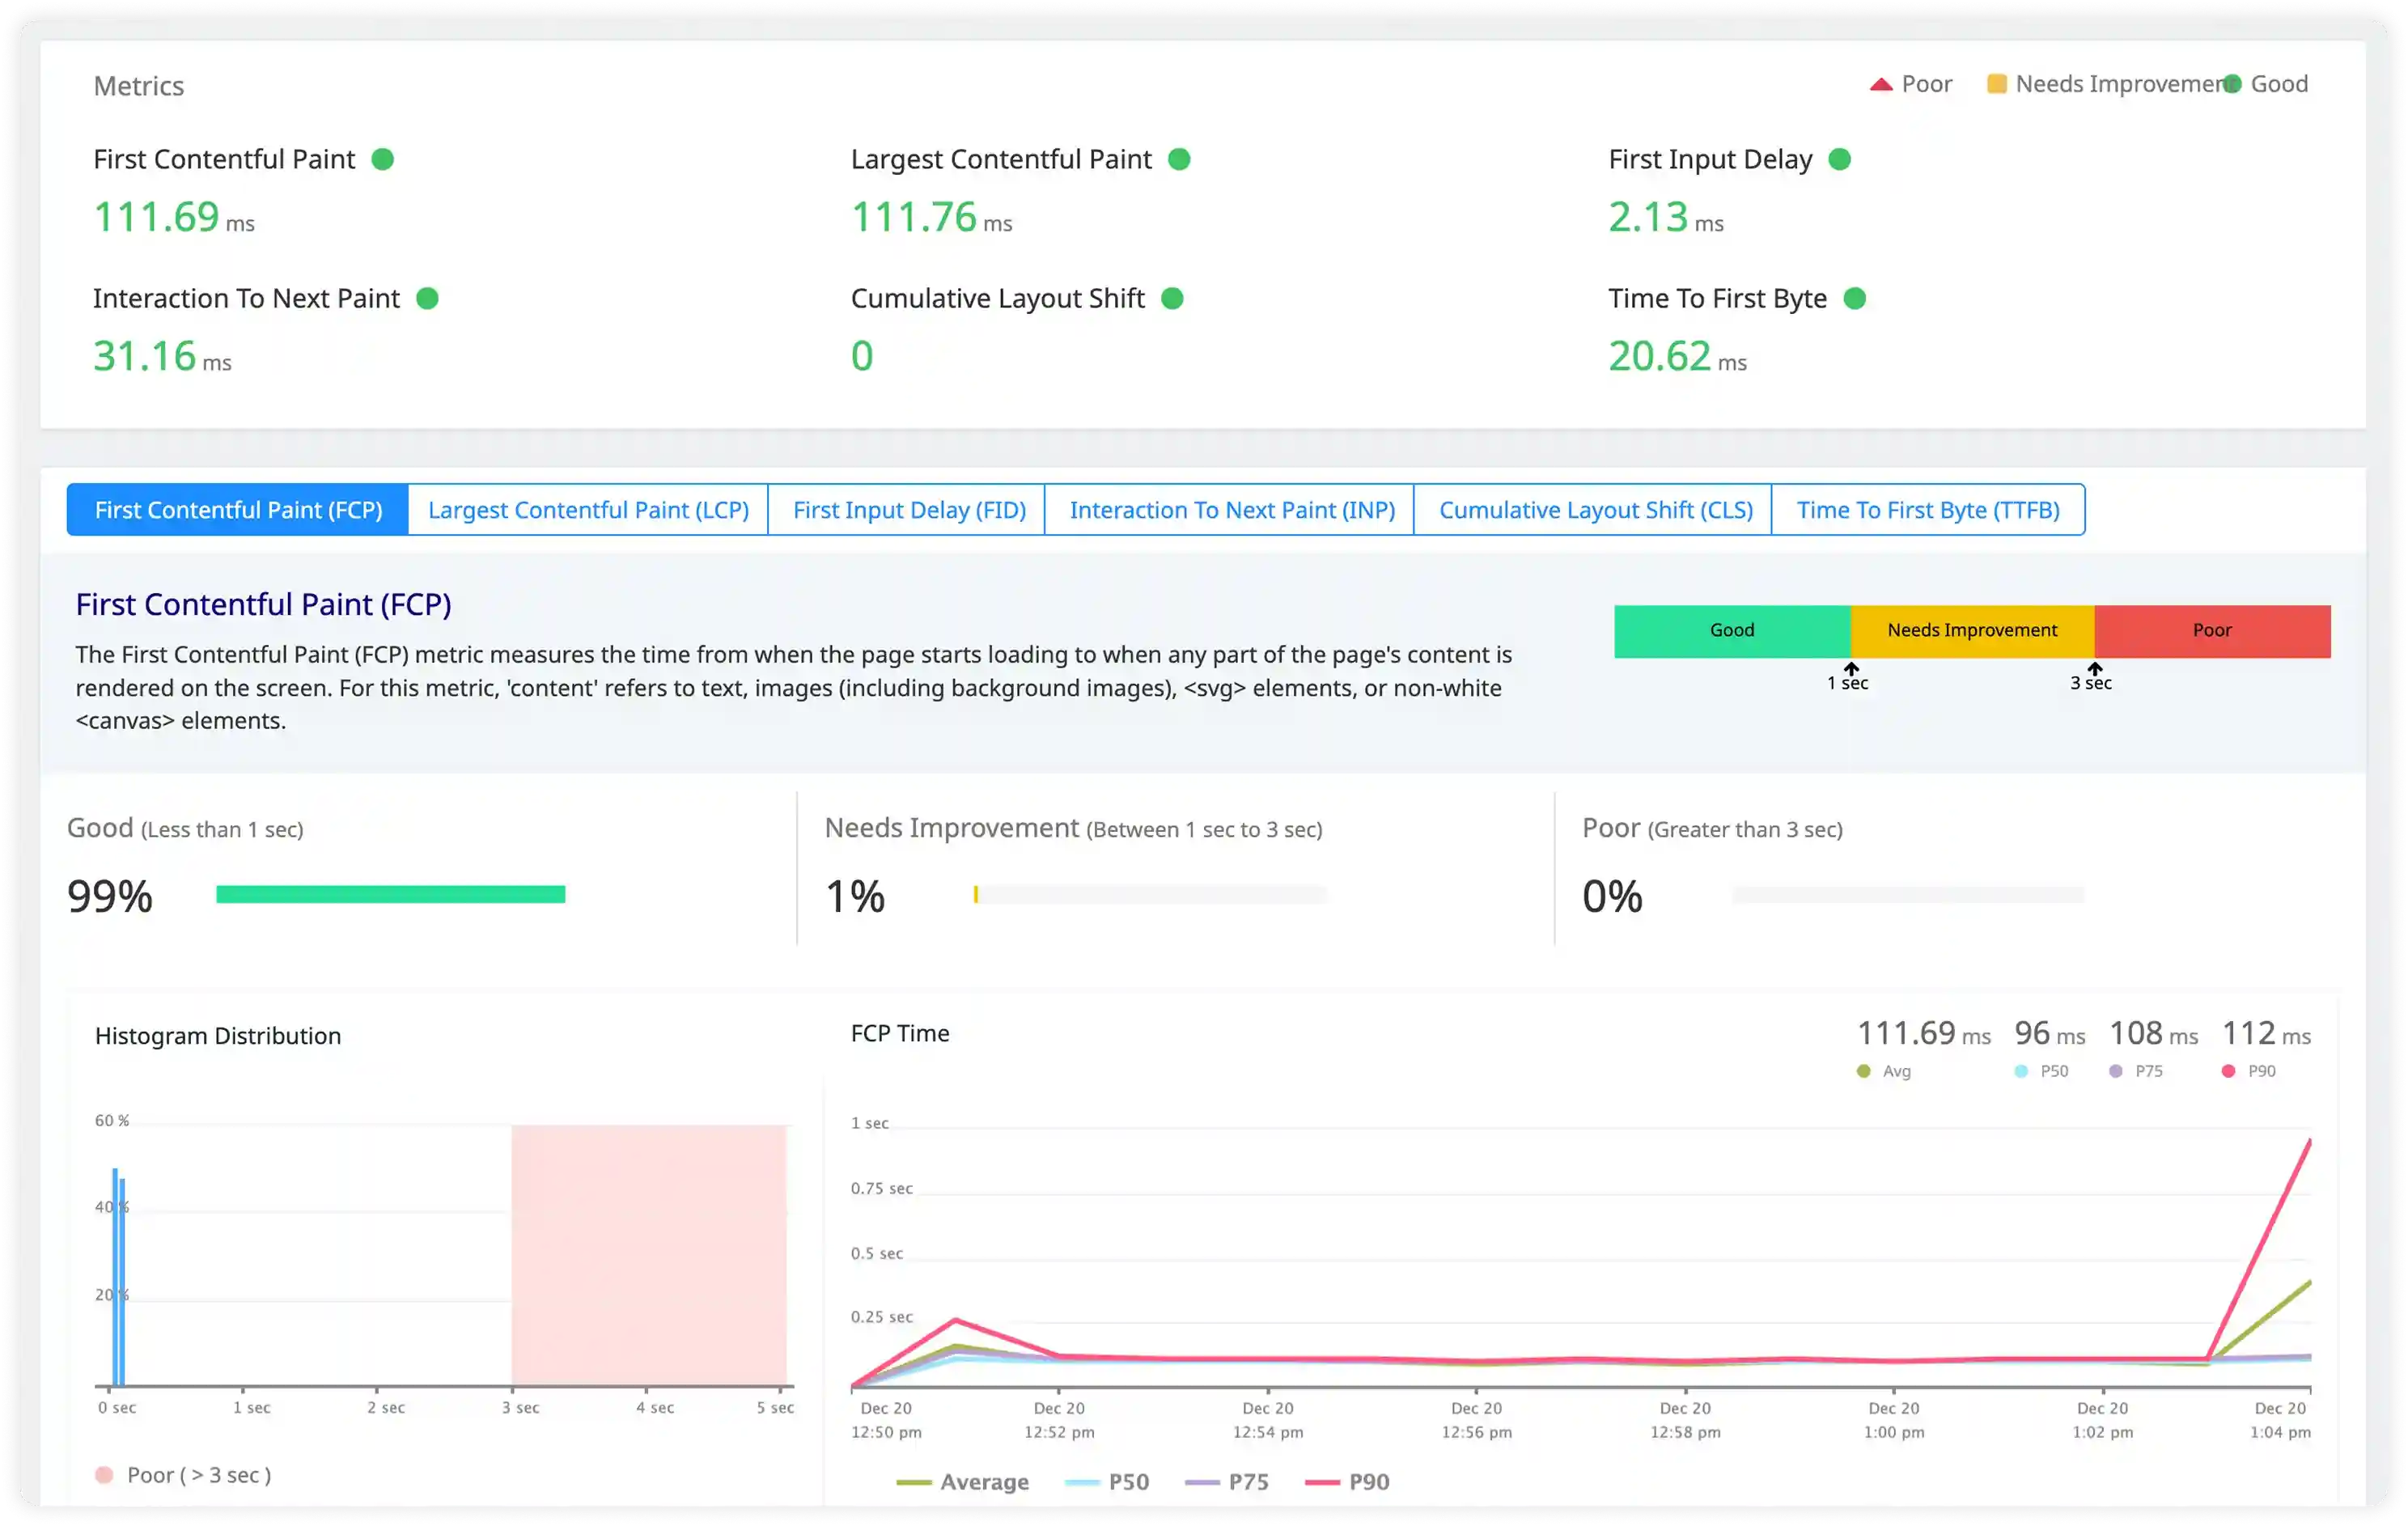
Ionic PWA Core Web Vitals
LCP/CLS/INP metrics attributed to web component renders, routing transitions, and service worker timing.
Web SPA scaling
Enterprise monitoring for high-traffic Ionic Framework web applications and PWAs.
Web app growth pricing
Scalable costs for Ionic web user sessions across global CDN deployments.
Unified Observability for Every Engineering Team
Atatus adapts to how engineering teams work across development, operations, and reliability.
Developers
Trace requests, debug errors, and identify performance issues at the code level with clear context.
DevOps
Track deployments, monitor infrastructure impact, and understand how releases affect application stability.
Release Engineer
Measure service health, latency, and error rates to maintain reliability and reduce production risk.