Meteor Error and Performance Monitoring
Get complete visibility into your Meteor errors and performance issues that are impacting your end user experience. Fix critical issues sooner with in depth data points that helps you in analyzing and resolving issues with great speed.
Unlock complete visibility into Meteor reactivity, publications, and real-time data flows
Meteor publication/subscription waterfalls
Track pub/sub latency, minimongo merges, and reactive query execution during live Meteor real-time application sessions.
Tracker recomputation profiling
Monitor reactive computations, autorun dependencies, and template helpers across Meteor full-stack workloads.
MongoDB oplog tailing performance
Measure real-time data sync, change stream processing, and minimongo oplog integration timing.
Meteor runtime error isolation
Capture Blaze template errors, reactive session failures, and DDP connection drops with full client/server context.
Real-time UI responsiveness
Detect delayed reactive UI updates, cursor subscription stalls, and live data rendering bottlenecks.
Pub/sub to UI correlation
Trace Meteor publications through DDP, minimongo, Tracker, to final template rendering paths.
Isomorphic SSR performance
Analyze Meteor server-side rendering, Flow Router transitions, and client hydration across deployments.
Meteor package optimization
Validate atmosphere package performance, bundle analysis, and reactive dependency graphs in production.
Reactive Data Execution
- Measure reactive data update frequency during real user interactions and correlate execution cost with actual DOM update latency to understand UI performance impact.
- Identify Tracker computations and reactive data sources that trigger repeated UI updates without meaningful state changes, creating unnecessary processing overhead.
- Analyze reactivity propagation across templates and components in detail to surface redundant render cycles and cascading updates.
- Detect unstable reactive dependencies that fluctuate frequently and negatively affect UI consistency, smoothness, and responsiveness.
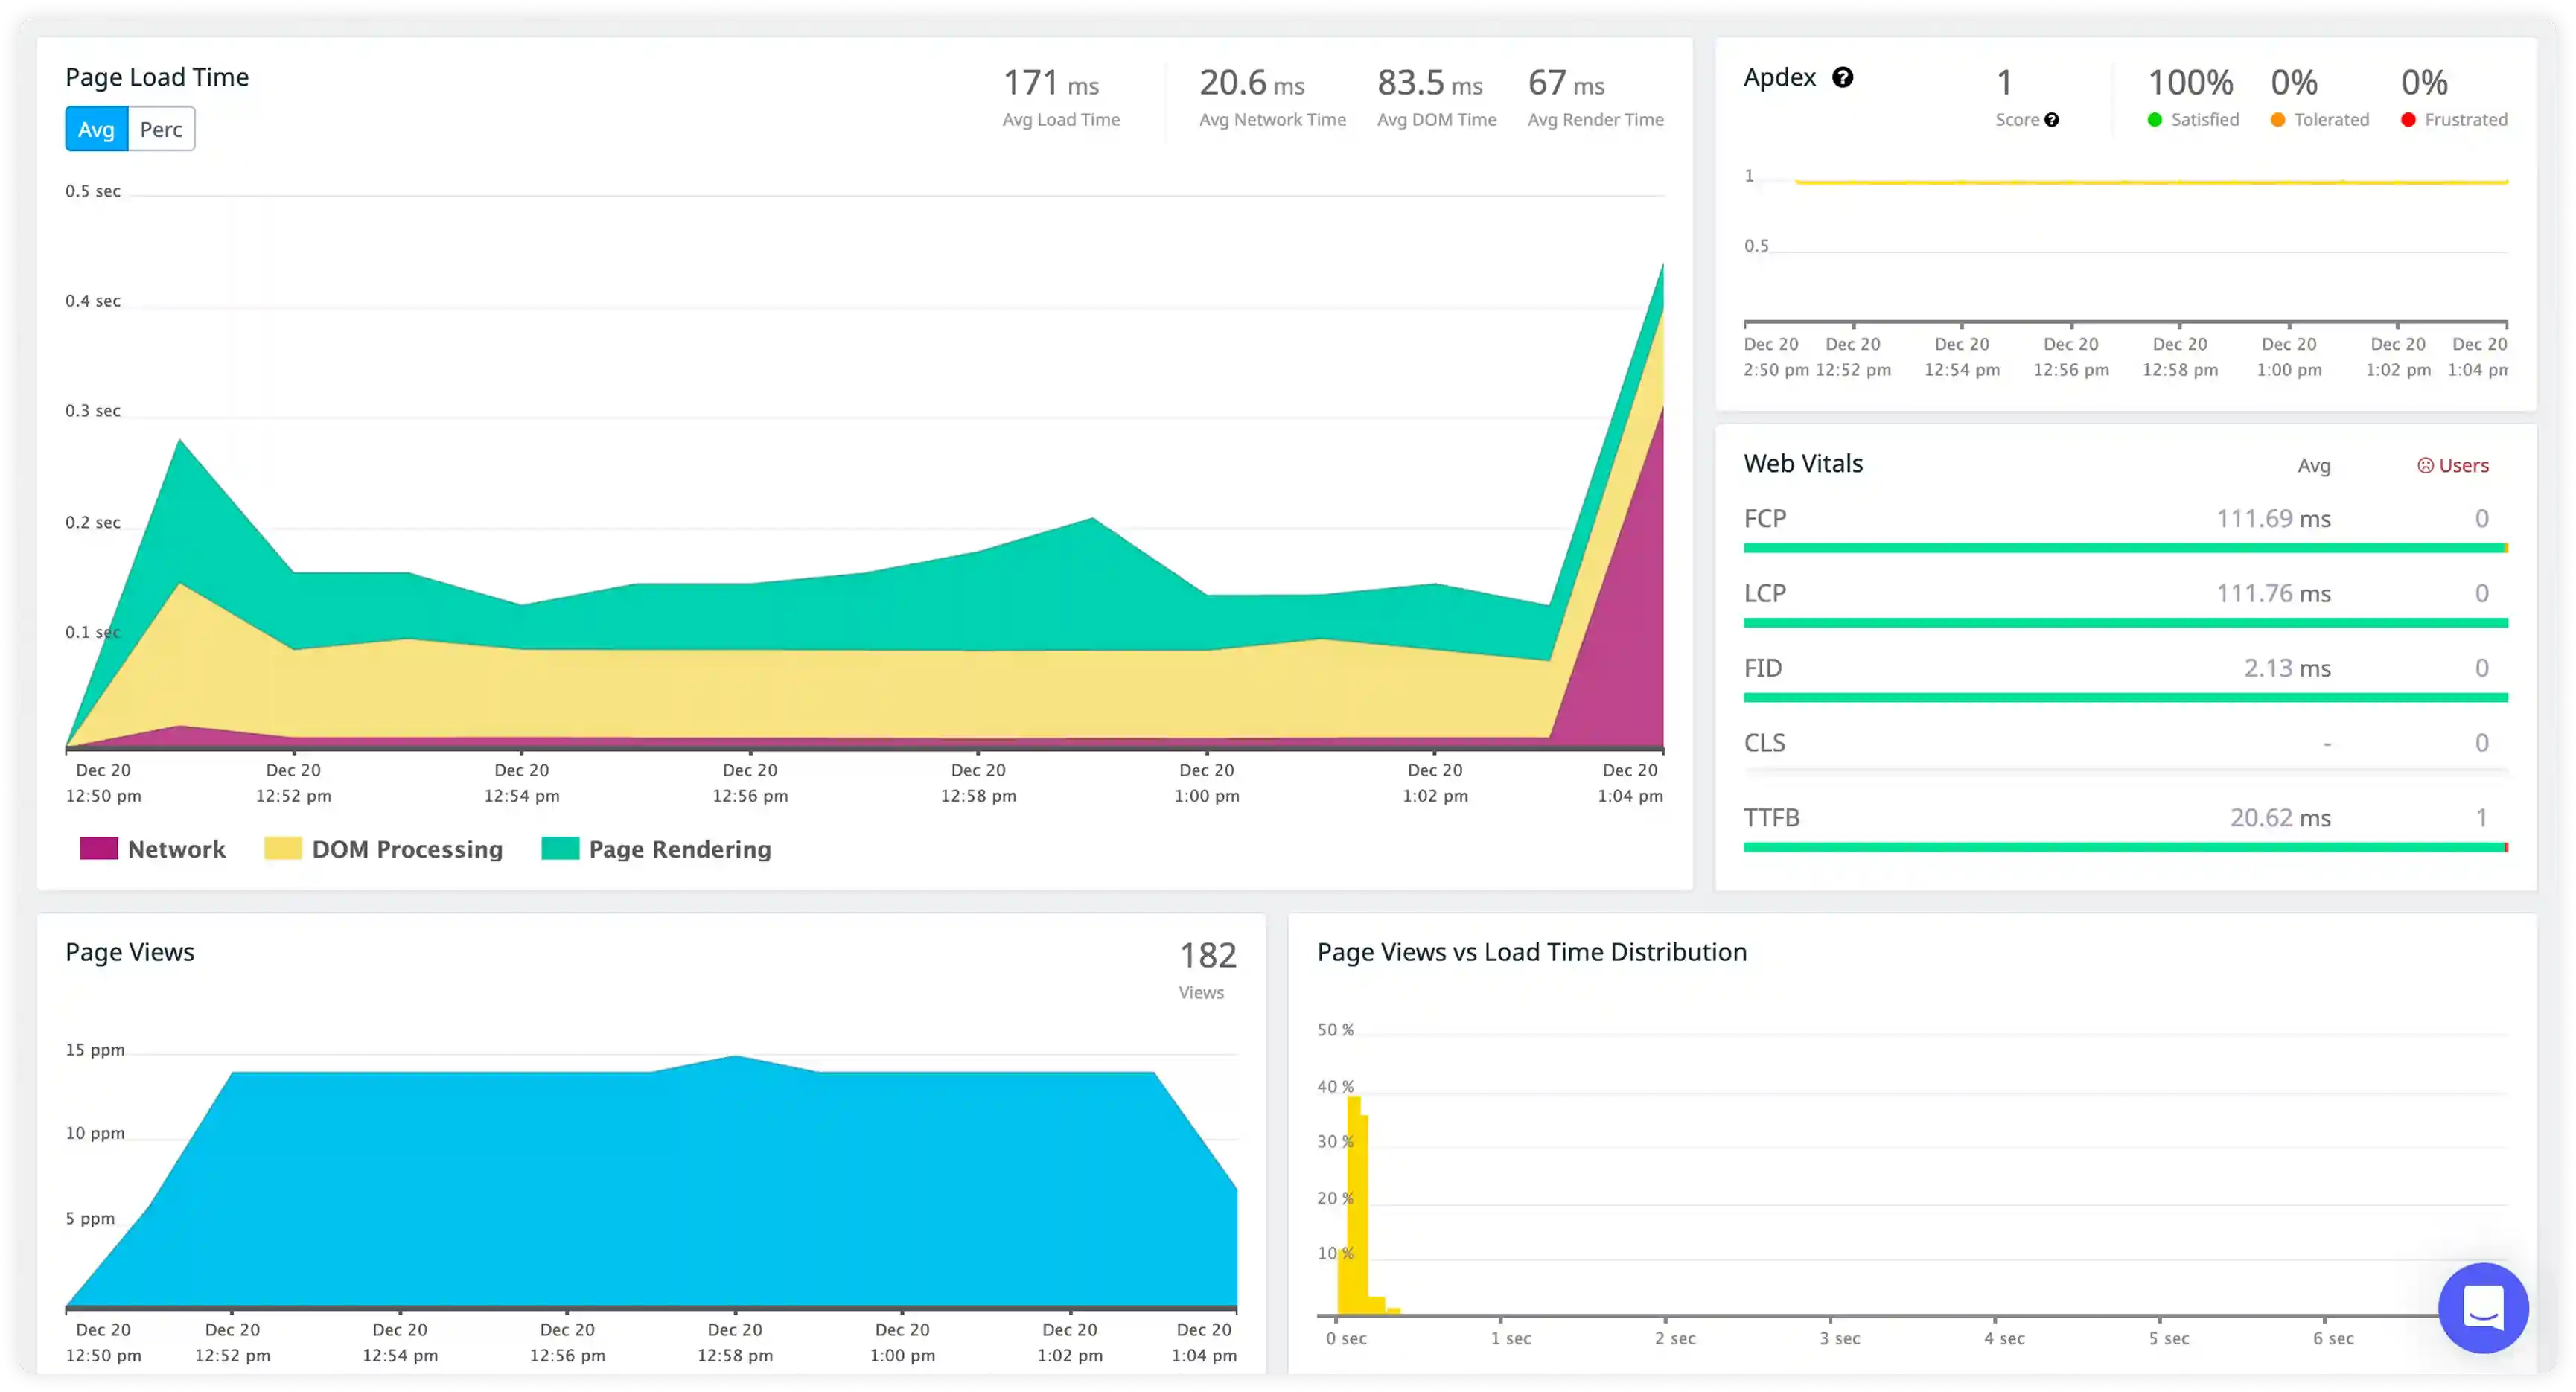
Template Rendering and DOM Execution
- Track template render timing during subscription updates, reactive data changes, and user-triggered interactions across workflows.
- Measure the delay between reactive data updates and final DOM patch completion to identify slow render paths.
- Identify frequent template re-renders that contribute to UI lag, layout shifts, and increased CPU usage.
- Correlate rendering execution time with visual instability, dropped frames, and interaction delays.
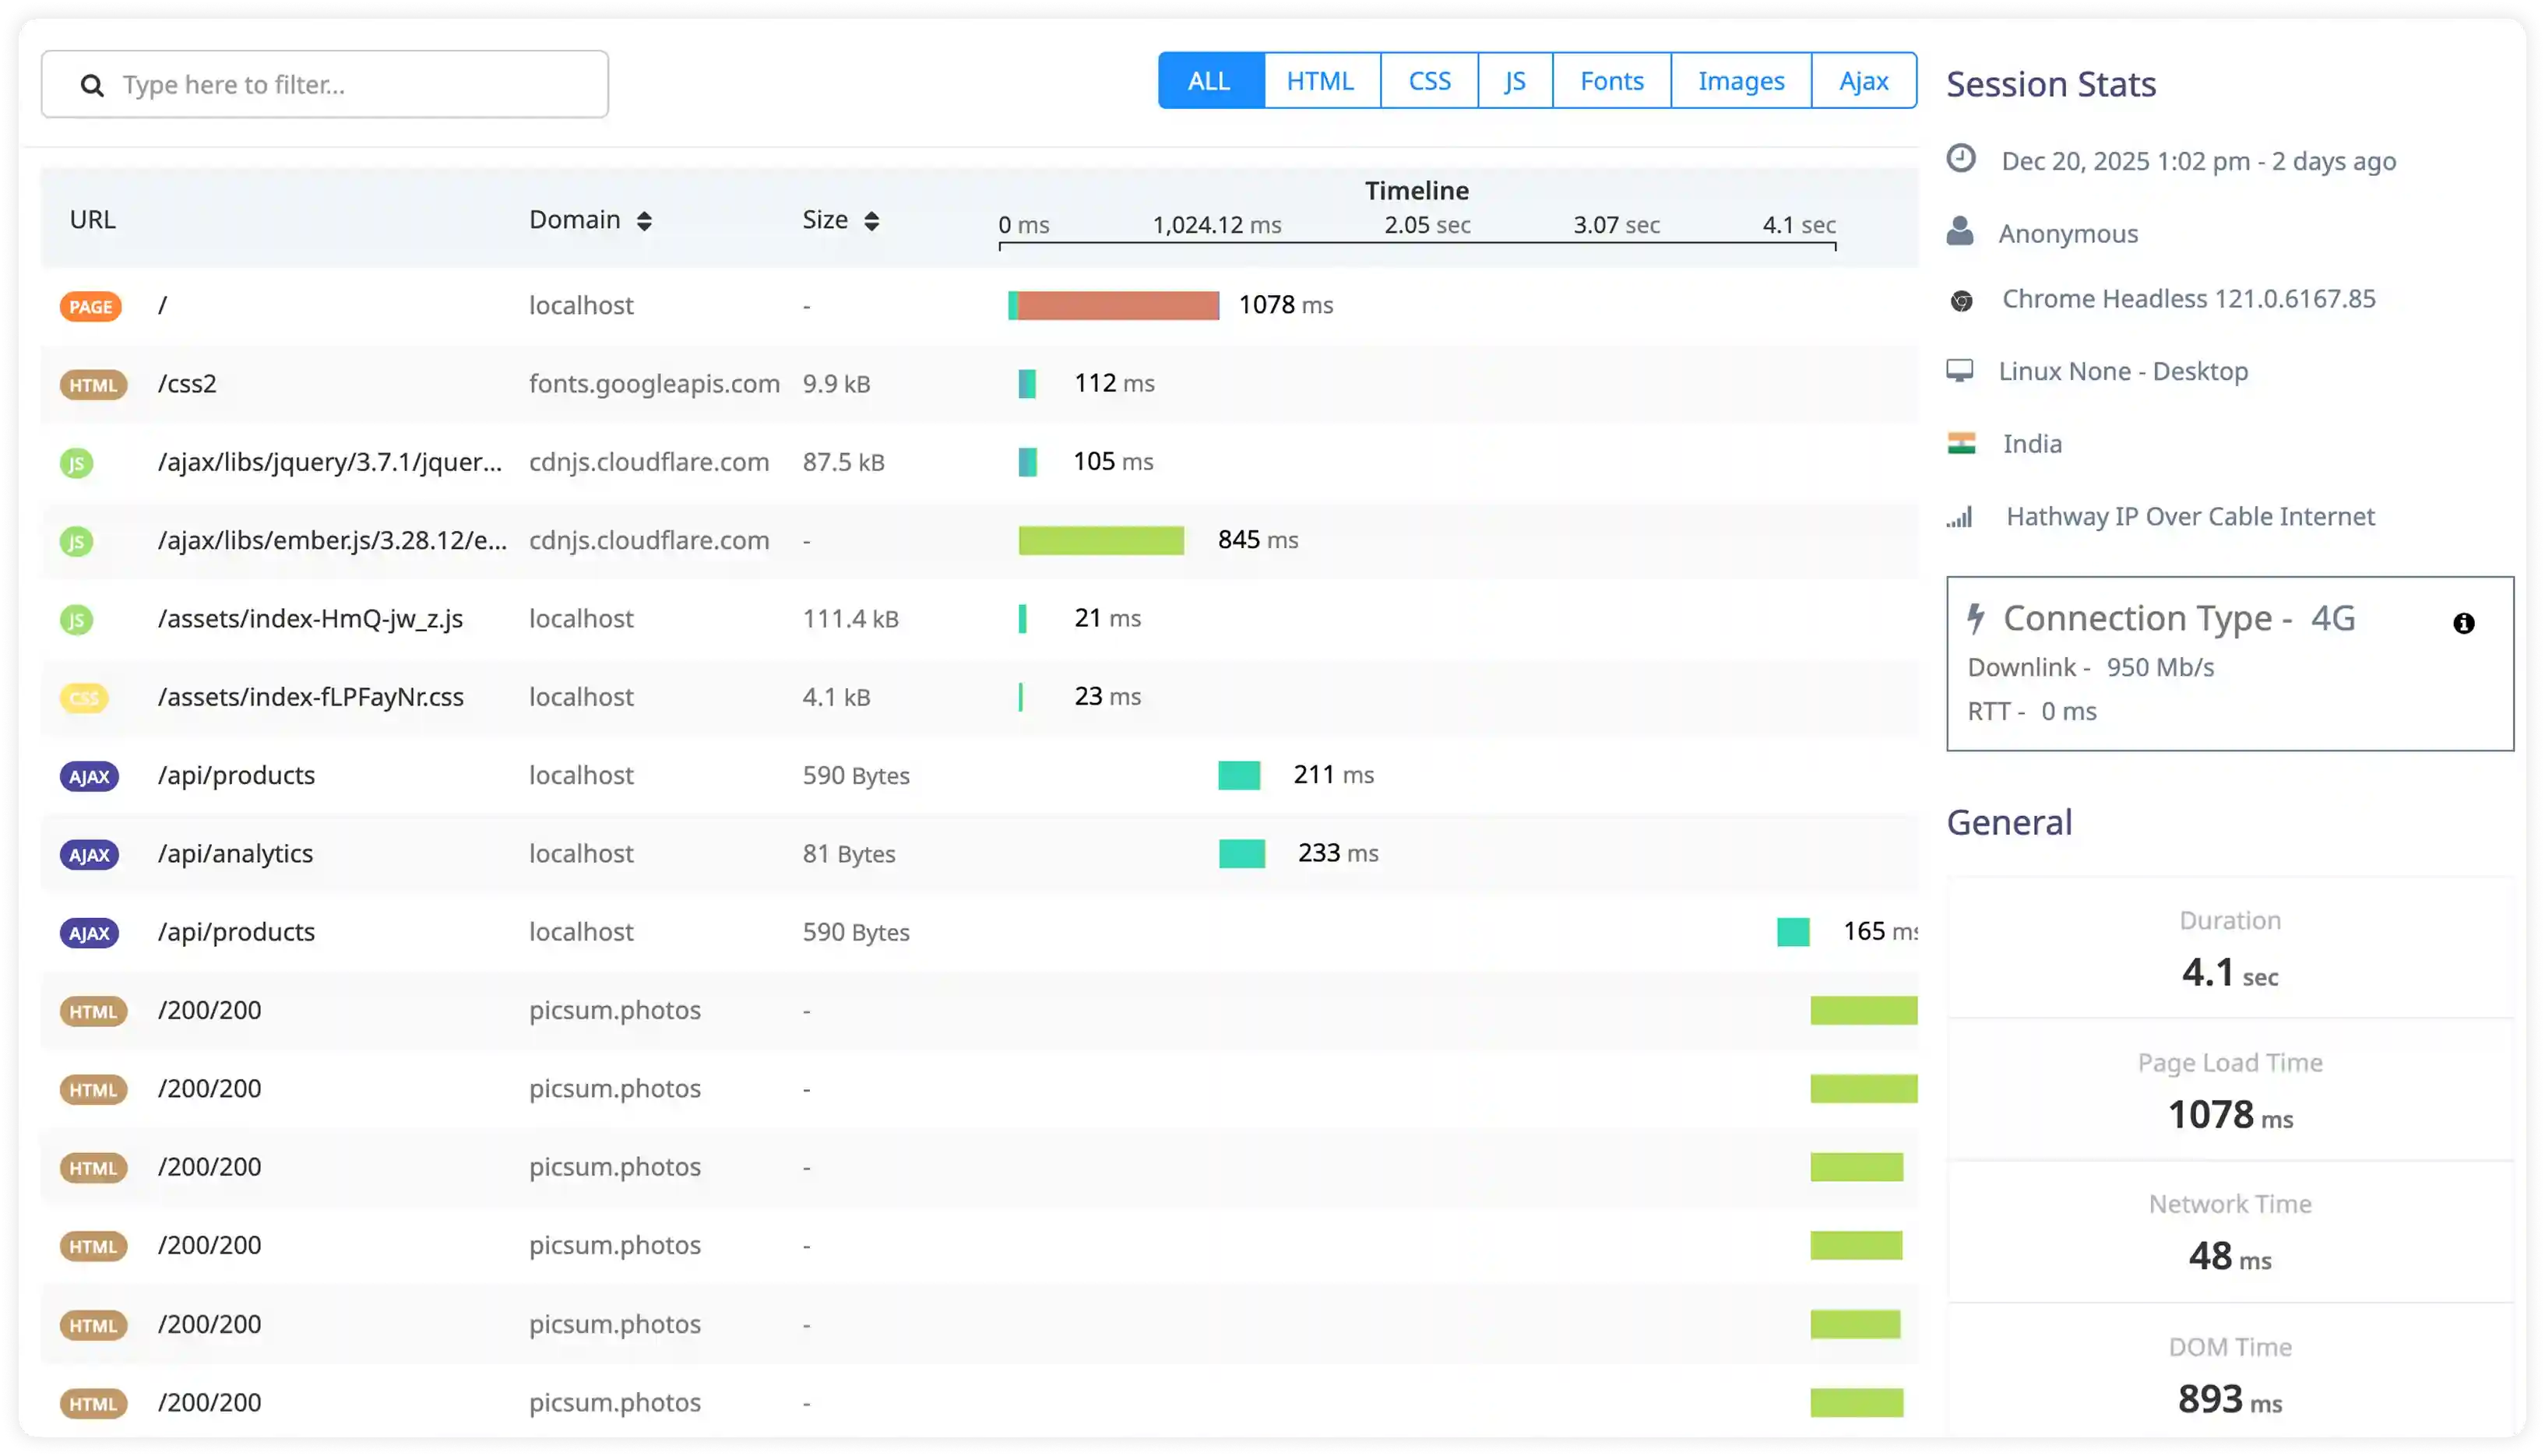
Subscriptions and Data Synchronization
- Measure latency across the publication–subscription lifecycle during navigation events and live data fetch operations.
- Identify redundant, overlapping, or long-lived subscriptions that continuously trigger reactive UI updates.
- Analyze client–server data synchronization timing under real user conditions to surface network or processing bottlenecks.
- Detect blocking data updates that delay interaction readiness and affect screen stability.
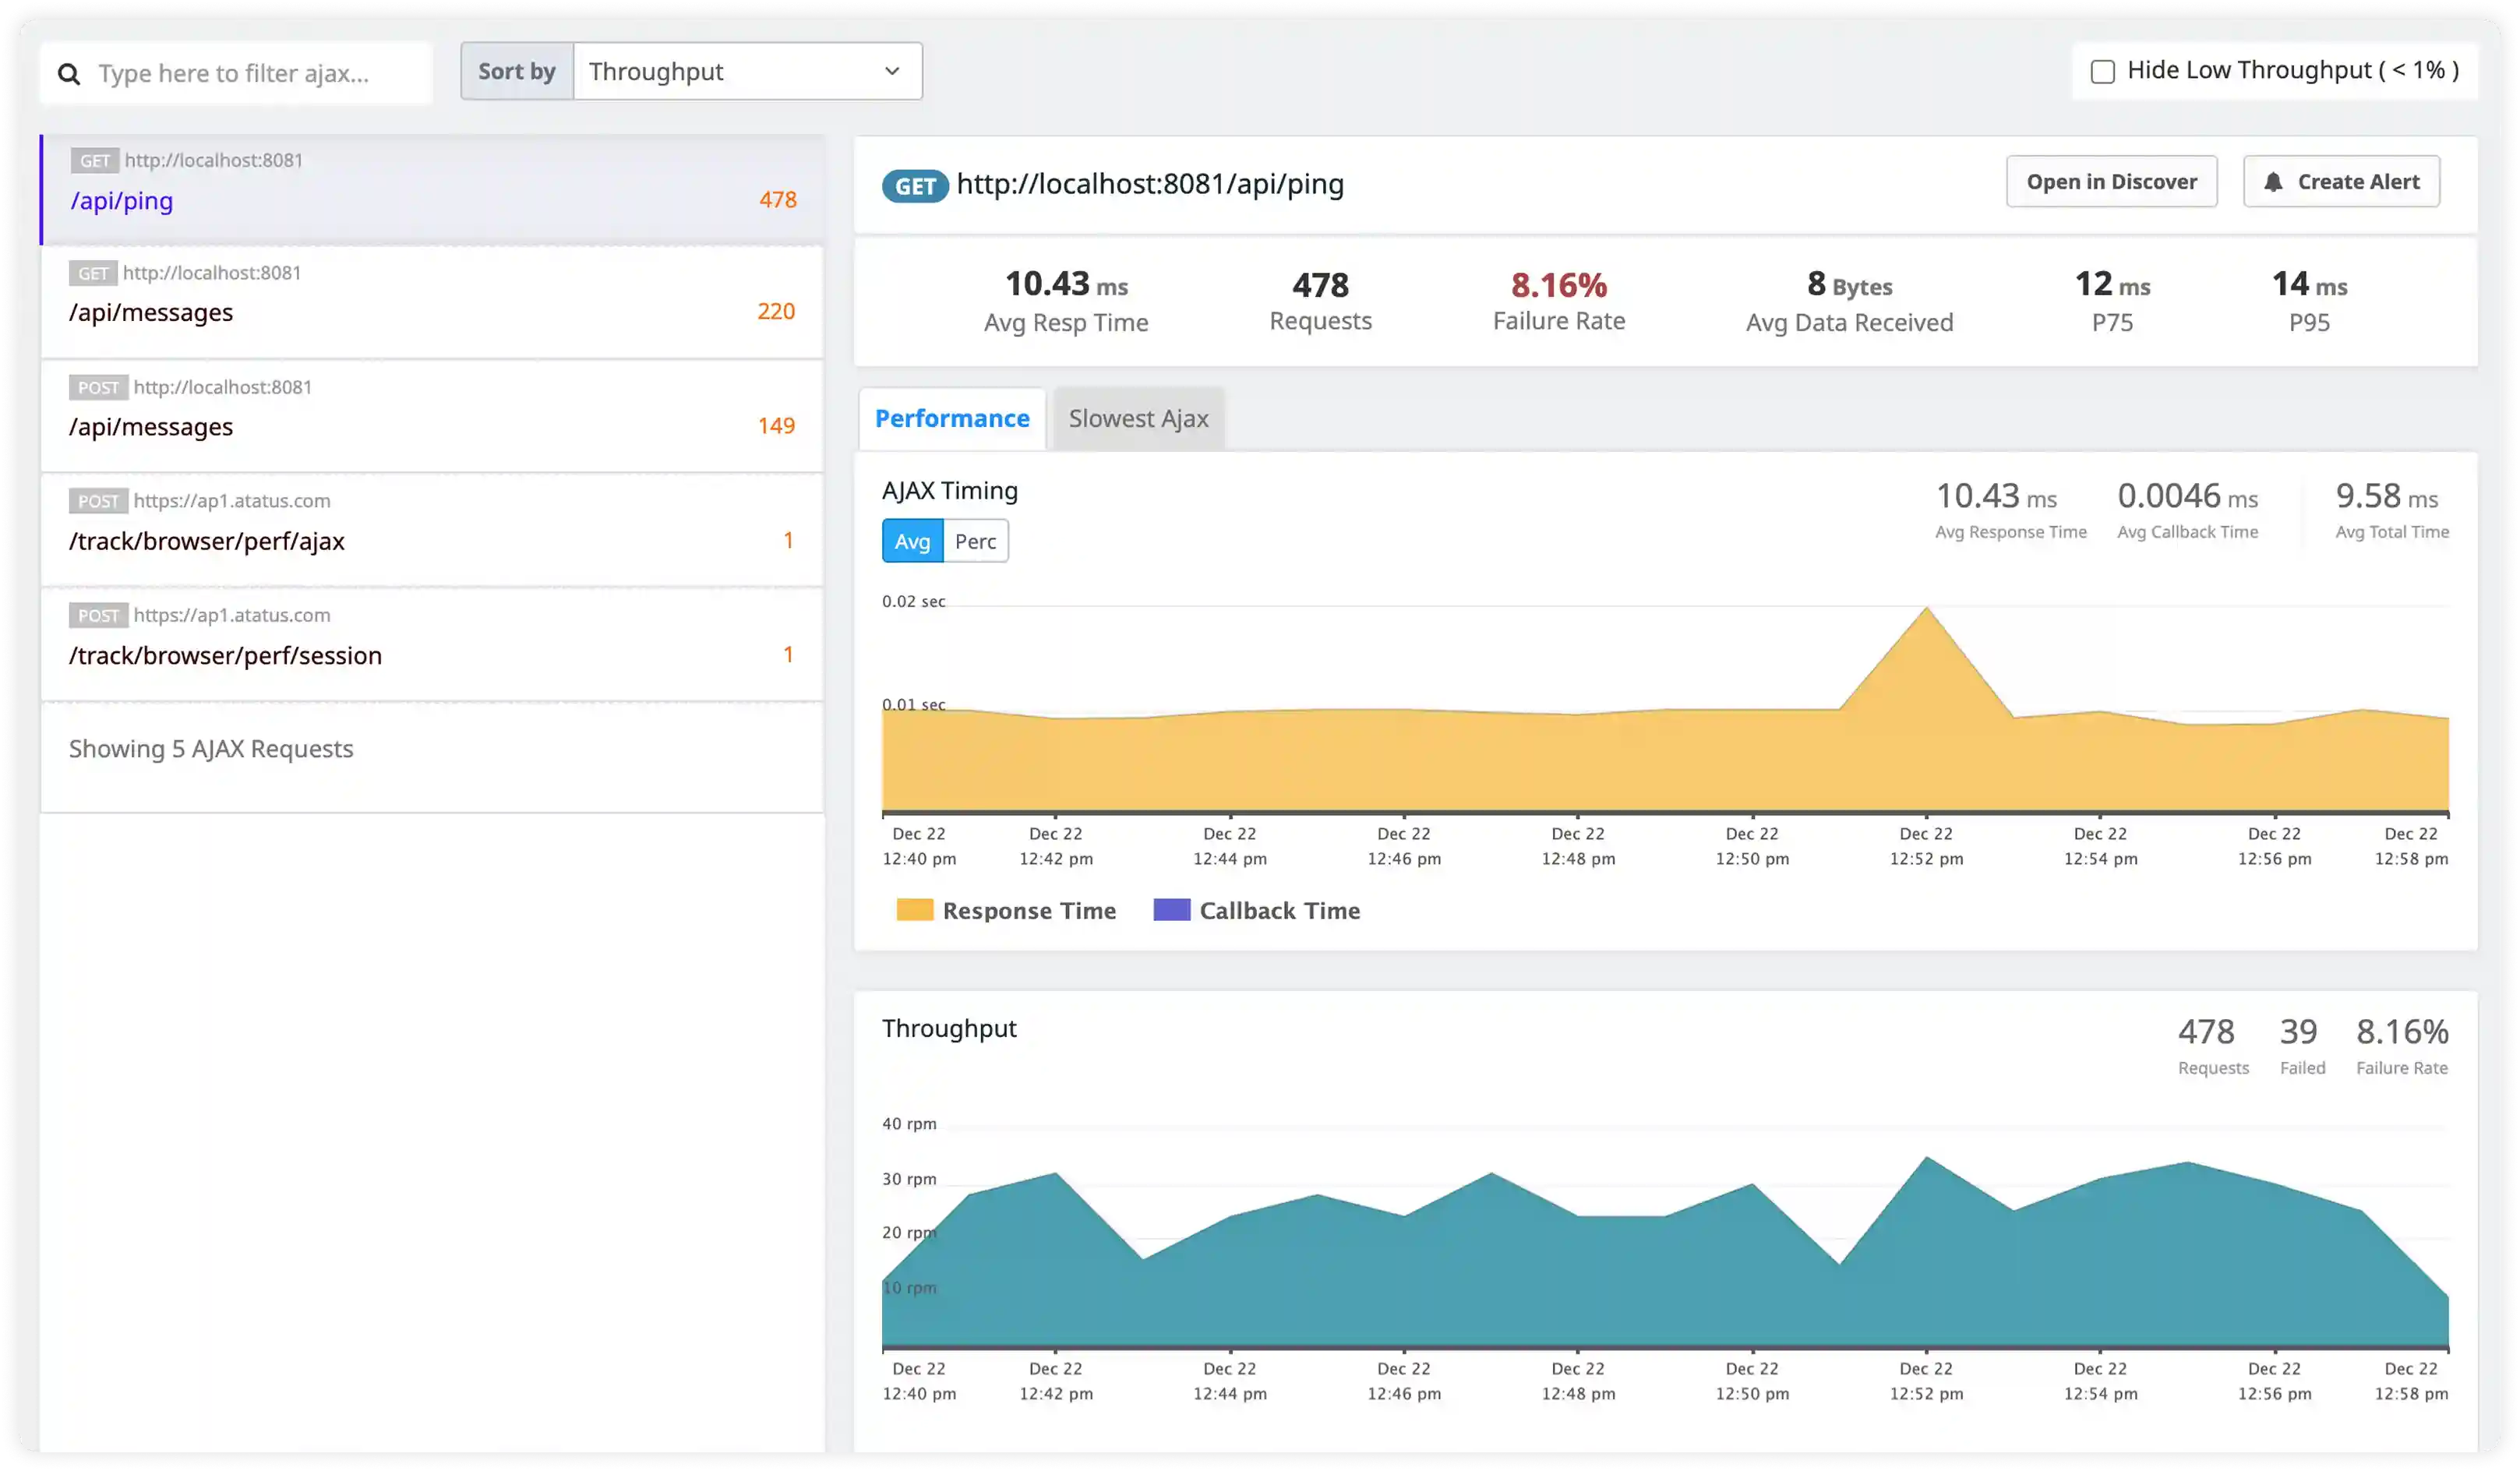
Method Calls and Asynchronous Execution
- Track Meteor method execution timing from invocation through server processing to reactive UI update completion.
- Measure the delay between asynchronous method completion and the resulting UI refresh to detect slow response paths.
- Identify concurrent method calls, background jobs, or batch operations that impact rendering performance.
- Correlate async execution timing with workflow interruption, responsiveness, and perceived performance.
Why Choose Atatus for Meteor RUM?
Master Meteor real-time reactivity, pub/sub scaling, and isomorphic performance without Galaxy complexity
Built for Meteor reactivity
Native Tracker autorun tracing, minimongo merge analysis, and publication/subscription lifecycle monitoring.
Meteor real-time diagnostics
DDP message waterfalls, oplog tailing traces, and reactive computation profiling for production apps.
Zero-config Meteor integration
Automatic instrumentation for Meteor 1.10+, Blaze/React/Vue, and atmosphere packages—no manual pub/sub wrapping.
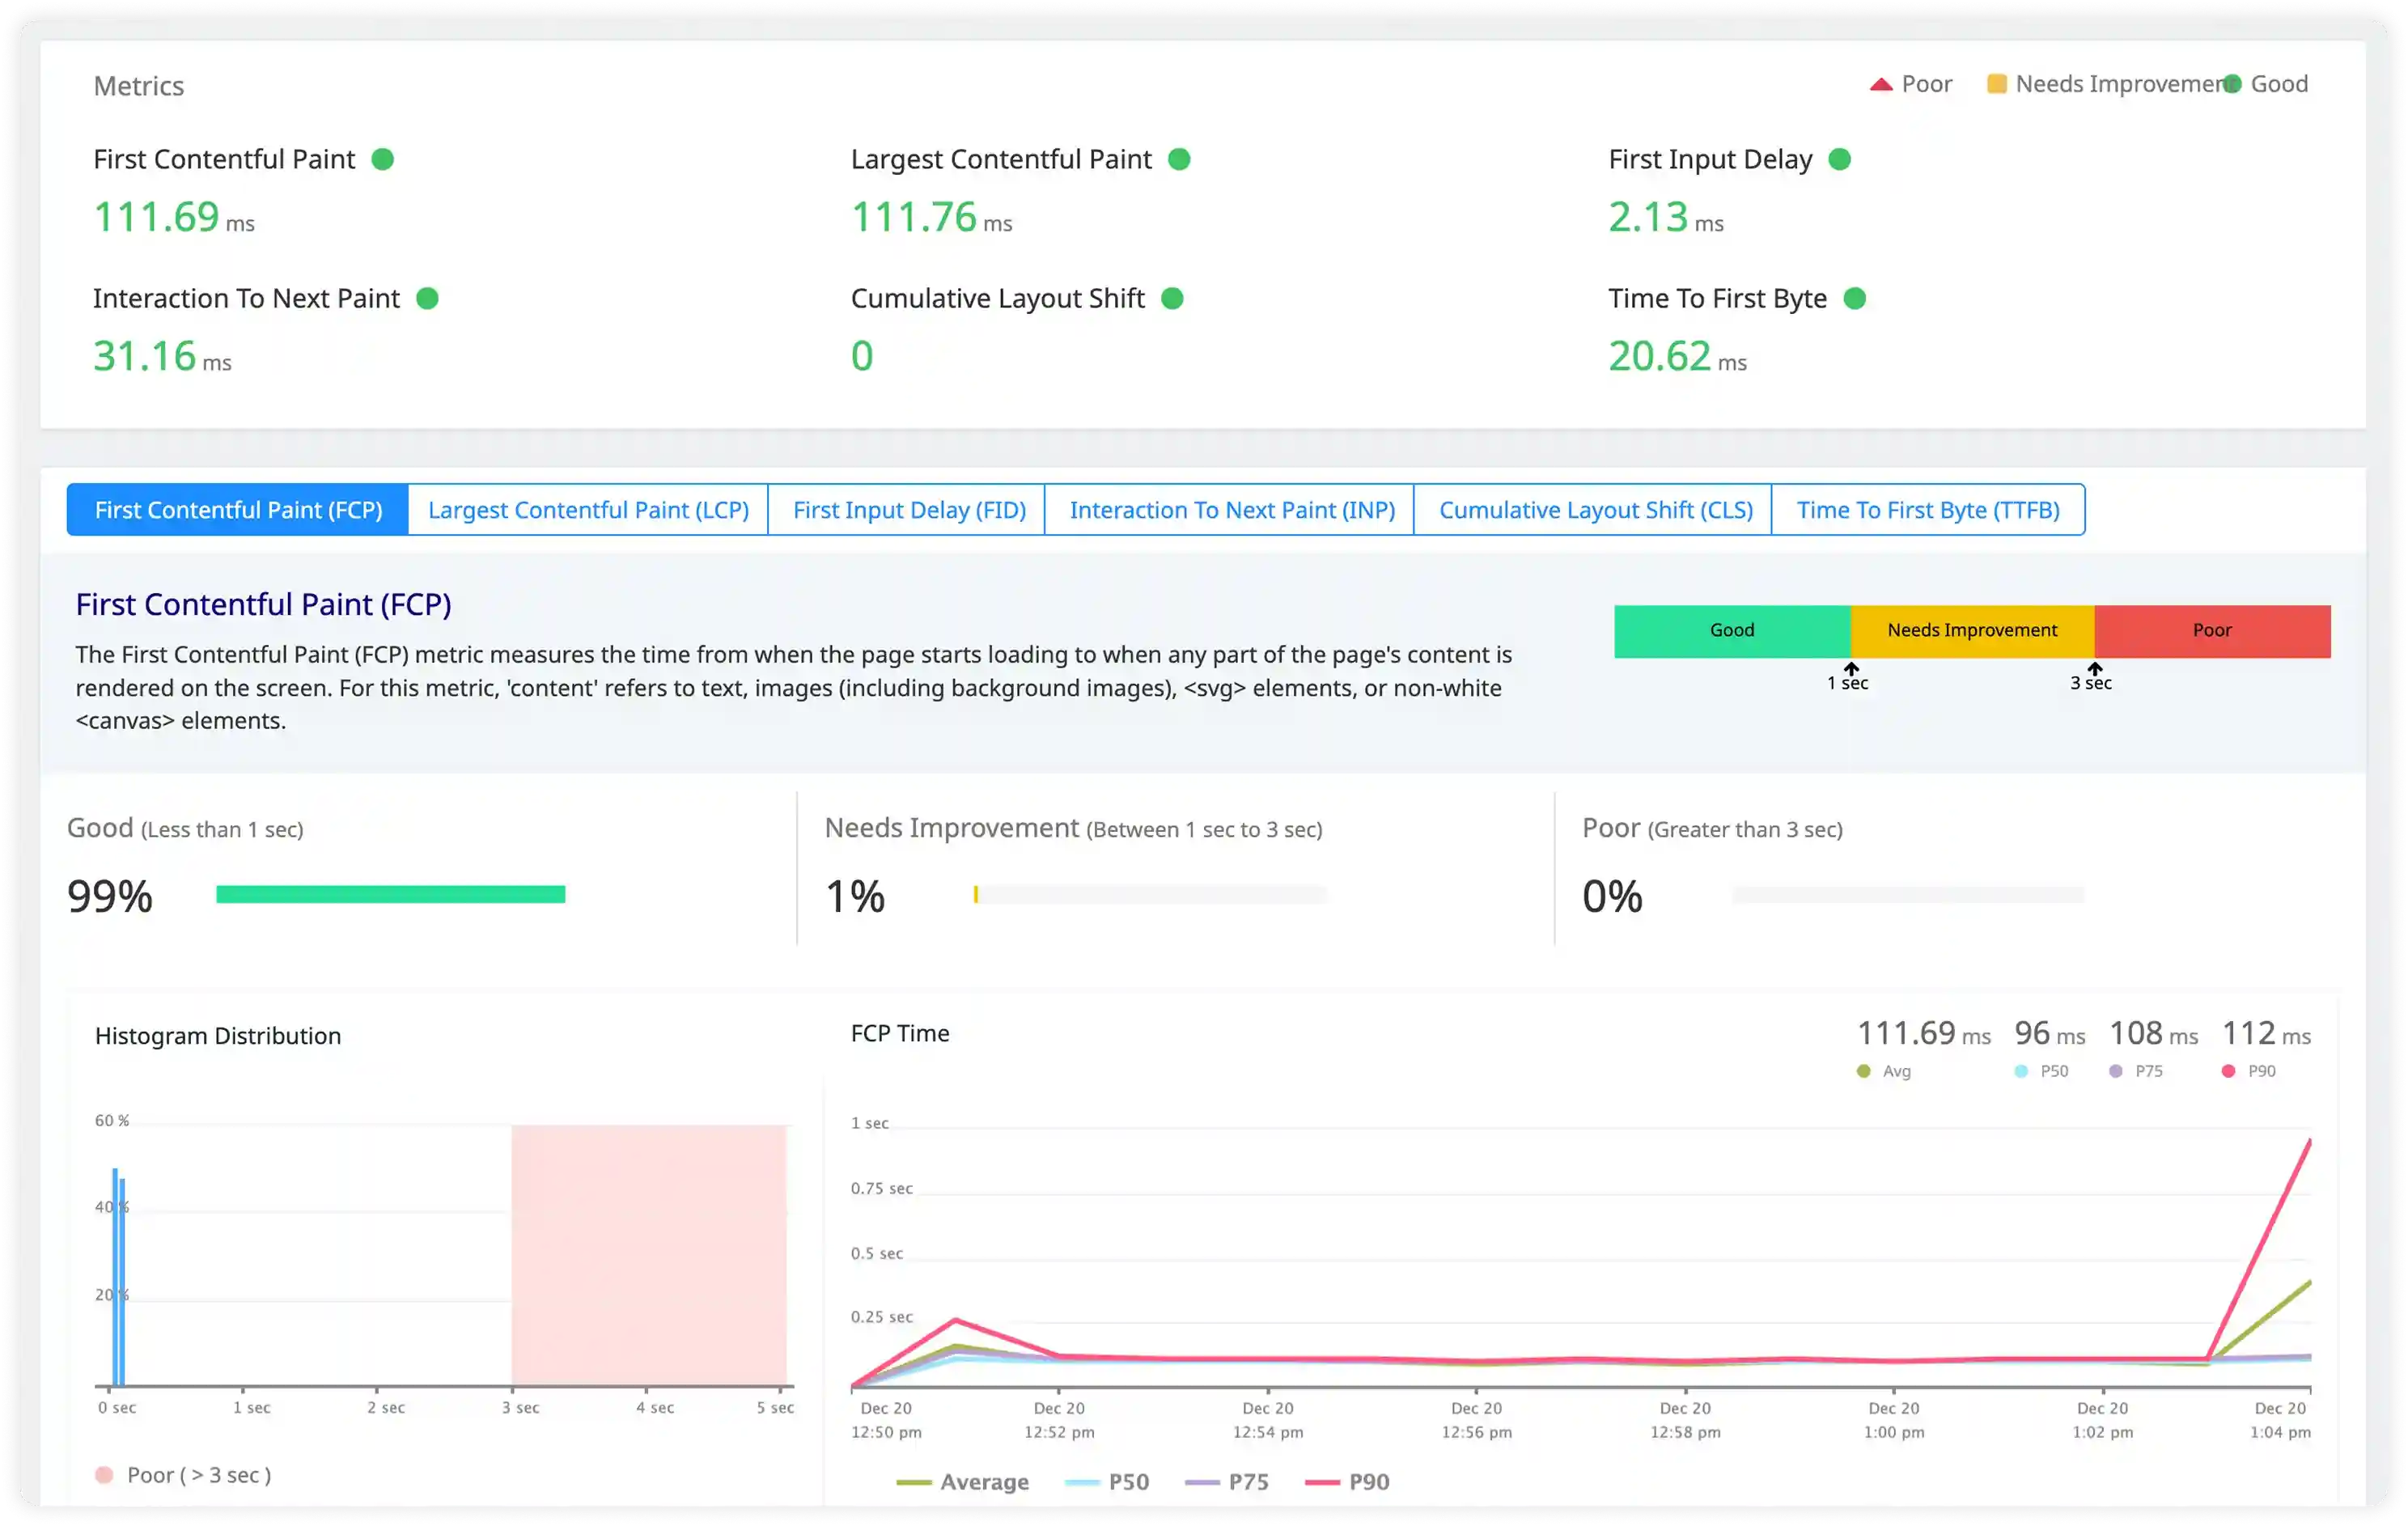
Meteor Core Web Vitals attribution
LCP/CLS/INP metrics tied to publication latency, Tracker recomputes, and minimongo sync timing.
Real-time app scaling
Enterprise-grade monitoring for high-concurrency Meteor deployments with live data synchronization.
Meteor growth pricing model
Scalable costs for Meteor real-time user sessions—no platform lock-in or deployment complexity.
Unified Observability for Every Engineering Team
Atatus adapts to how engineering teams work across development, operations, and reliability.
Developers
Trace requests, debug errors, and identify performance issues at the code level with clear context.
DevOps
Track deployments, monitor infrastructure impact, and understand how releases affect application stability.
Release Engineer
Measure service health, latency, and error rates to maintain reliability and reduce production risk.