Oracle Database Monitoring
From query execution and wait events to session activity and infrastructure health, get complete visibility into your Oracle environment with Atatus Database Monitoring.
Oracle runs your most critical data. But do you actually know what's happening inside it?
Oracle powers some of the most critical workloads in the enterprise — from financial transactions to ERP systems. Yet teams running Oracle struggle to get meaningful visibility without drowning in noise, manual configuration, or tools that treat Oracle as an afterthought
Complexity Without Context
Oracle's architecture — RAC, ASM, Exadata, PDBs generates enormous telemetry. Most monitoring tools surface raw metrics but fail to connect wait events, active sessions, and SQL execution plans into a coherent picture teams can act on.
Query Performance Blind Spots
Slow queries in Oracle don't always announce themselves. Without visibility into normalized SQL, execution plans, and wait class breakdowns CPU, I/O, concurrency, teams waste hours in AWR reports trying to find what a modern tool should surface in seconds.
Alert Fatigue from Shallow Integrations
Generic thresholds on CPU or memory don't reflect how Oracle actually behaves under load. Teams end up chasing false alarms, missing real incidents because their observability platform wasn't built with Oracle's internals in mind.
Complete Oracle Database Visibility, Layer by Layer
From slow queries to session bottlenecks. Atatus gives your team the depth and clarity to understand exactly what's happening inside Oracle, and act on it fast.
Query Performance & Slow SQL Detection
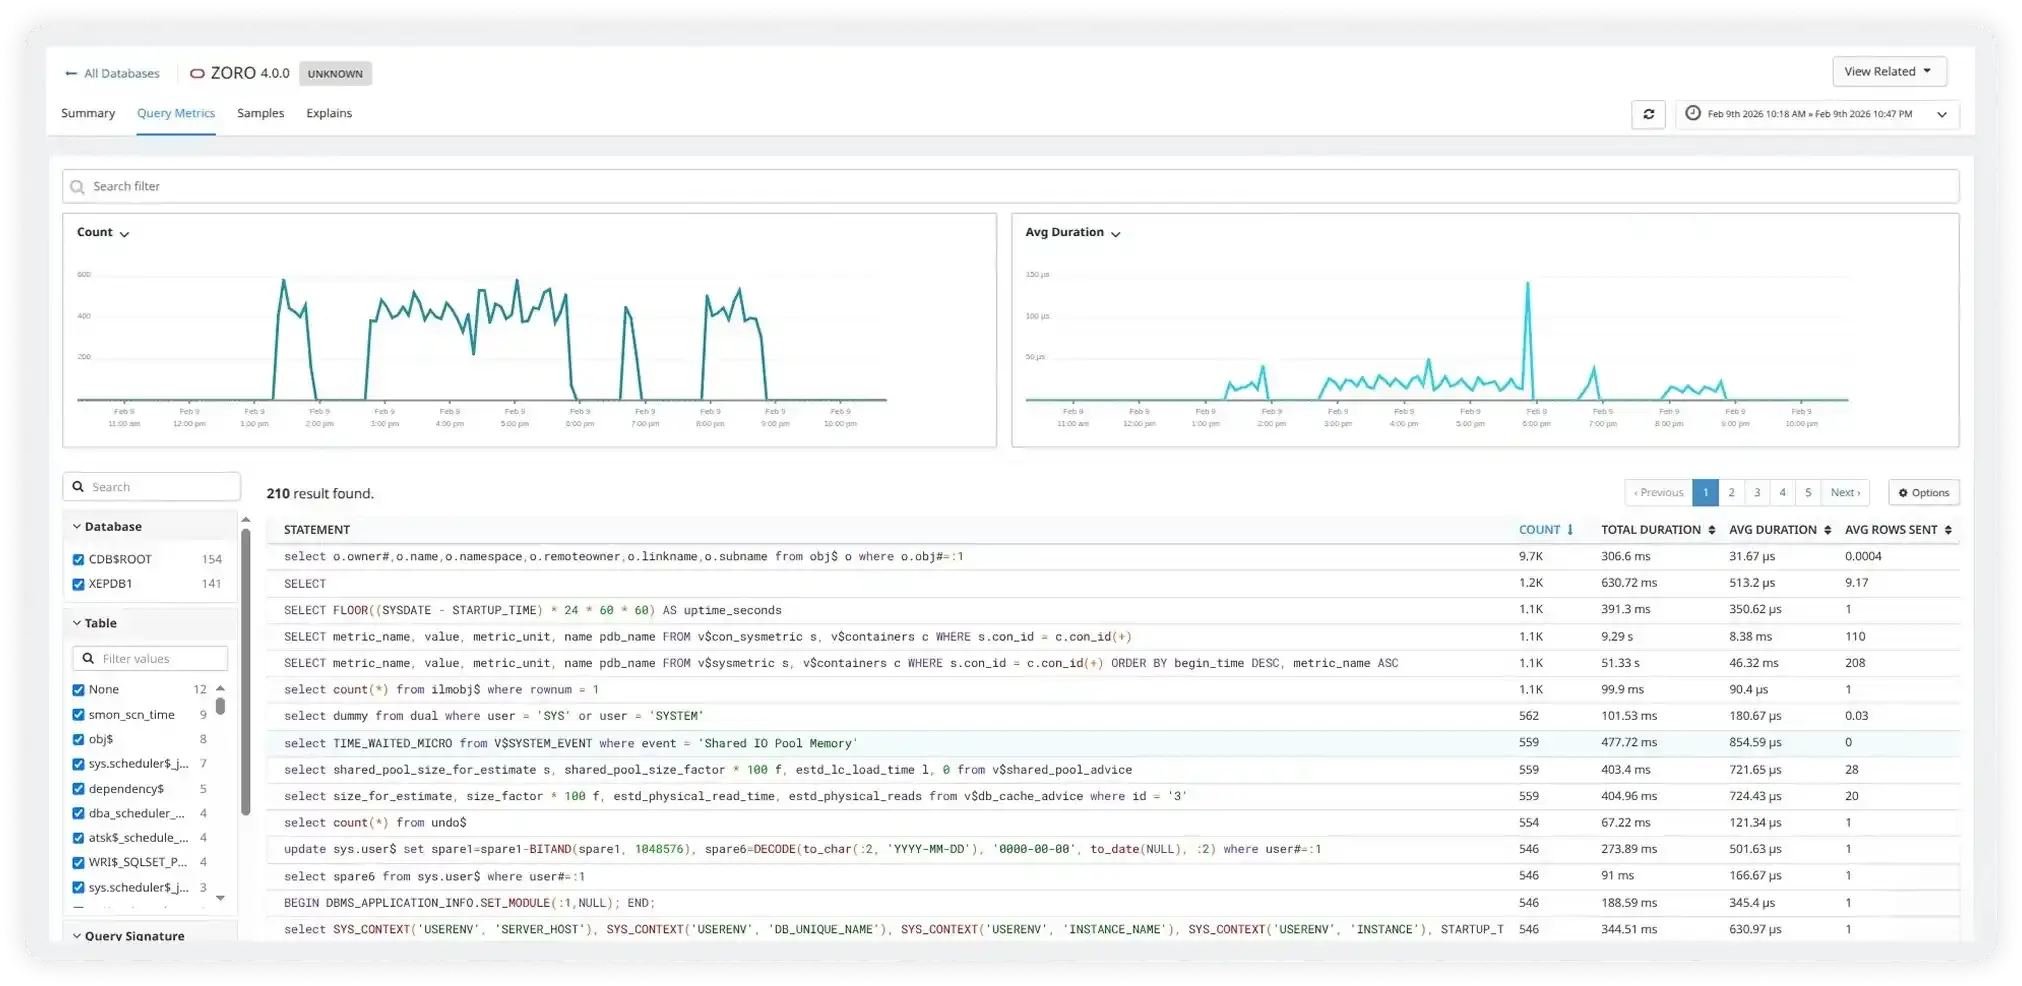
Slow queries in Oracle rarely surface on their own. By the time your application throws an error, the database has already been struggling. Atatus continuously tracks every SQL statement running on your Oracle instance — normalized, ranked, and broken down by execution count, average duration, and total time consumed.
- Identify top offending queries by CPU time, elapsed time, and logical reads.
- View historical query trends to catch gradual degradation before it becomes an incident.
- Filter and search queries by schema, module, or user to pinpoint exactly what's causing the slowdown.
- Get alerted when query execution time crosses defined thresholds — not after your users already notice it.
AI-Powered Explain Plans & Query Optimization
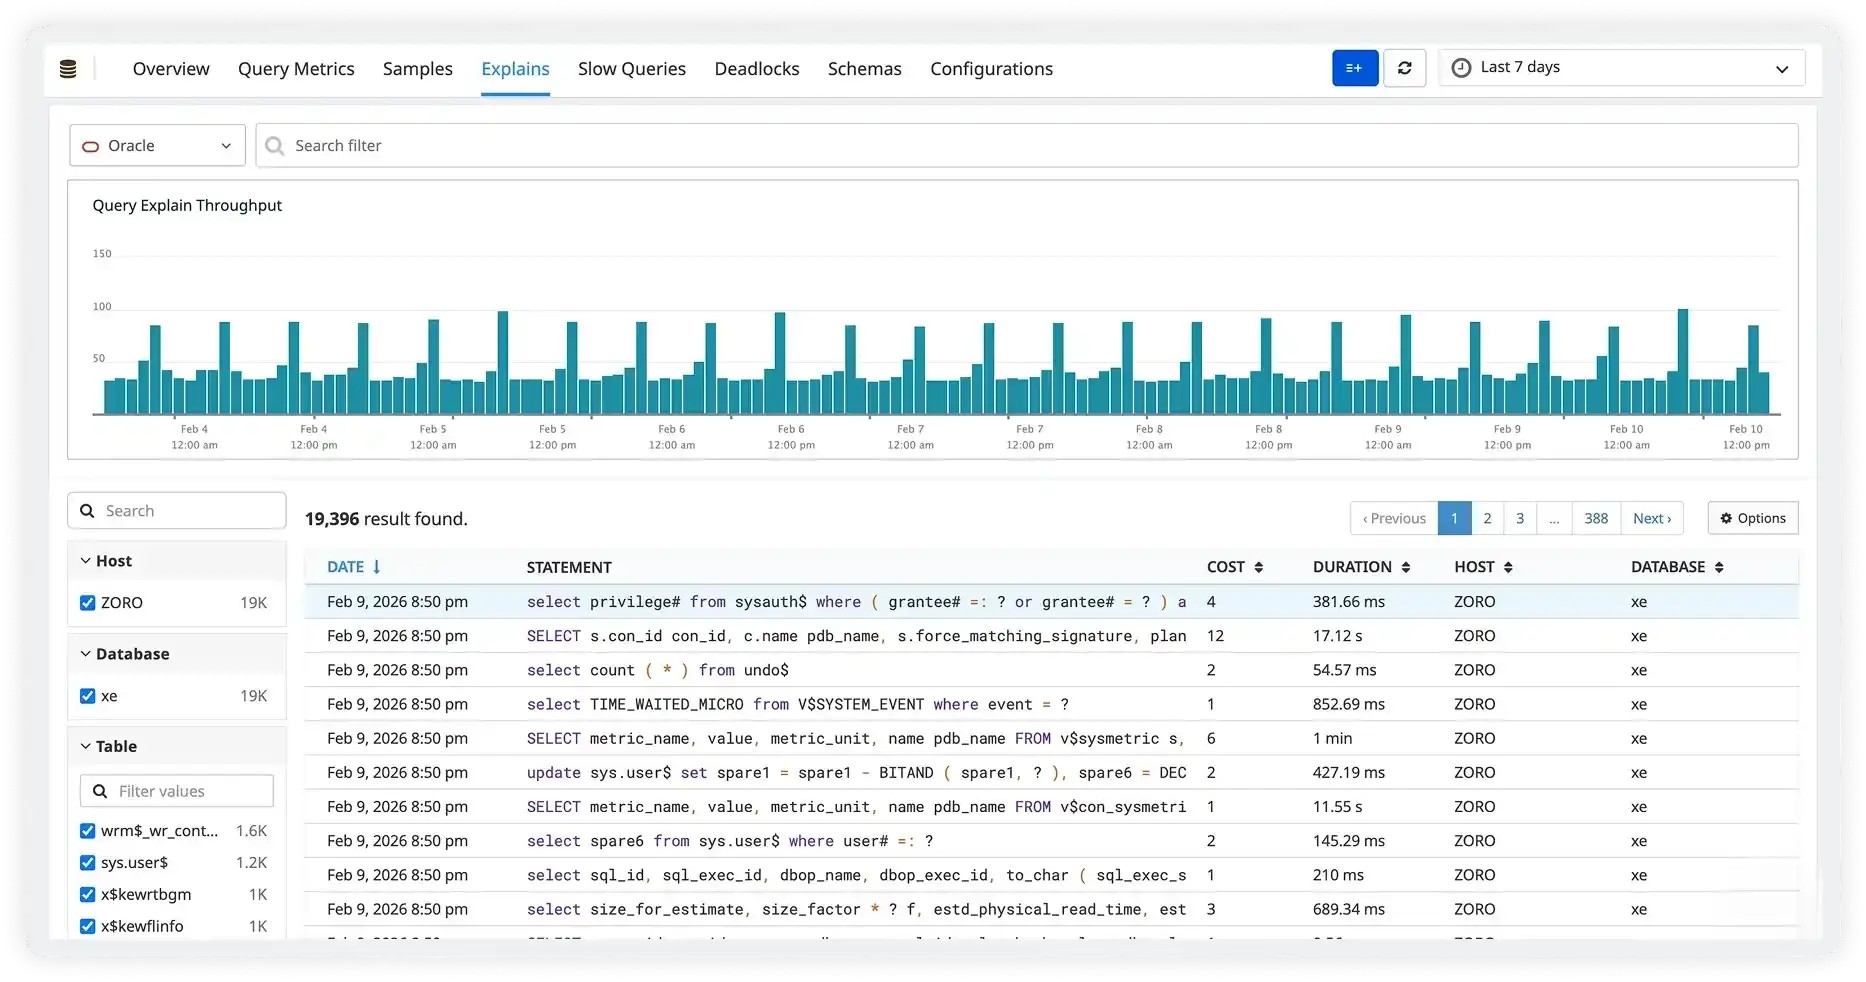
Tracking down the exact step that's slowing a query has always meant digging through SQL Developer or buried AWR reports. Atatus eliminates that back-and-forth with AI-powered query analysis that not only visualizes your execution plan but tells you what to fix and why.
- AI automatically identifies the most expensive nodes — full table scans, nested loops, hash joins and surfaces optimization suggestions in plain language
- Break down every query into its execution steps with cost annotations so your team can act without switching tools
- Spot missing indexes, poorly ordered joins, and unnecessary sort operations — flagged automatically, not after hours of manual analysis
- Track execution plan changes over time so a deployment that quietly breaks a query plan gets caught before users feel it
Wait Events & Session Activity
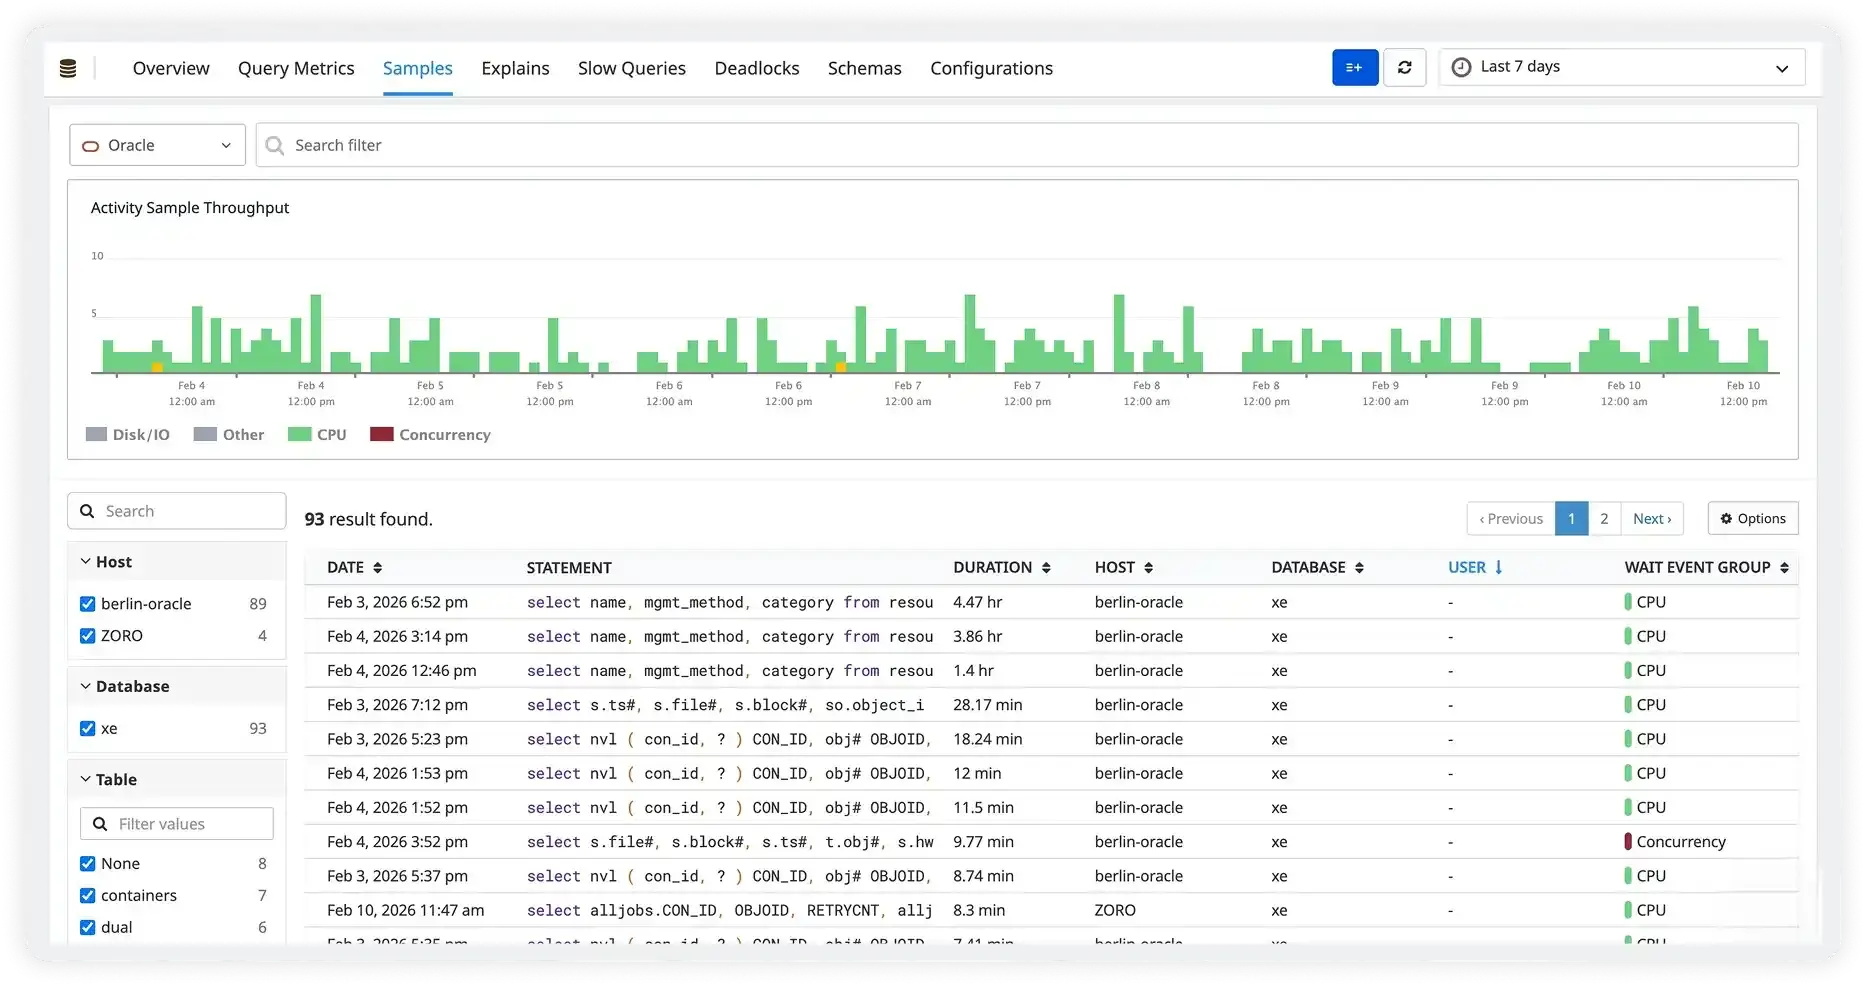
Oracle's wait event model is one of the most powerful diagnostic frameworks in any database, yet most platforms flatten it into a single metric. Atatus surfaces the full wait class breakdown — CPU, User I/O, System I/O, Concurrency, Application, so you can see exactly what your sessions are waiting for, in real time and historically.
- Monitor active sessions and their current wait states across all Oracle instances.
- Group wait events by wait class to understand whether you're dealing with an I/O problem, a CPU saturation issue, or a locking conflict.
- View session-level detail — user, program, SQL ID, machine to trace root cause without digging through V$SESSION manually.
- Correlate session spikes with application deployments or traffic surges for faster incident resolution.
Deep Oracle Observability, From Query Execution to Infrastructure Health
Atatus brings together query intelligence, session diagnostics, and infrastructure health into a single view — so your DBAs, developers, and SREs spend less time context-switching between tools and more time keeping Oracle performing at its best.
AI-Powered Query Intelligence
Atatus doesn't just show you slow queries — it tells you why they're slow. AI-driven explain plan analysis surfaces optimization opportunities automatically, without manual AWR digging.
Full Wait Event Visibility
Go beyond generic database latency metrics. Atatus breaks down Oracle wait classes — CPU, I/O, concurrency, application — so you know exactly what every session is waiting on, in real time.
All Oracle Deployments, One Platform
Whether you run self-managed Oracle, RDS, RAC, Exadata, or Autonomous Database — Atatus connects to all of them without separate agents or custom configurations for each environment.
Deadlock & Contention Detection
Lock waits, deadlock events, and rollback spikes are captured the moment they happen — with the full context of sessions, objects, and SQL involved, so nothing gets missed.
Unified Observability Across Your Stack
Correlate Oracle database performance with your application traces, infrastructure metrics, and logs — all in one place. No more context-switching between five different tools during an incident.
Alerts That Reflect Oracle's Reality
Set intelligent thresholds on query duration, session count, wait time, and resource utilization — and get notified before your users feel the impact, not after.
Unified Observability for Every Engineering Team
Atatus adapts to how engineering teams work across development, operations, and reliability.
Developers
Trace requests, debug errors, and identify performance issues at the code level with clear context.
DevOps
Track deployments, monitor infrastructure impact, and understand how releases affect application stability.
Release Engineer
Measure service health, latency, and error rates to maintain reliability and reduce production risk.