Optimize your Application Performance

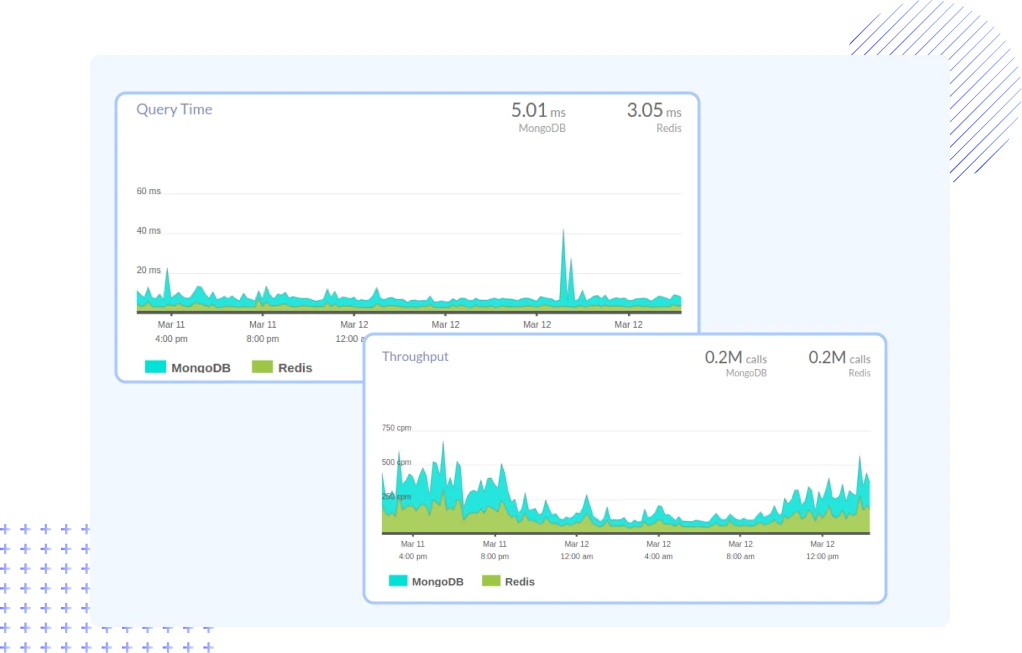
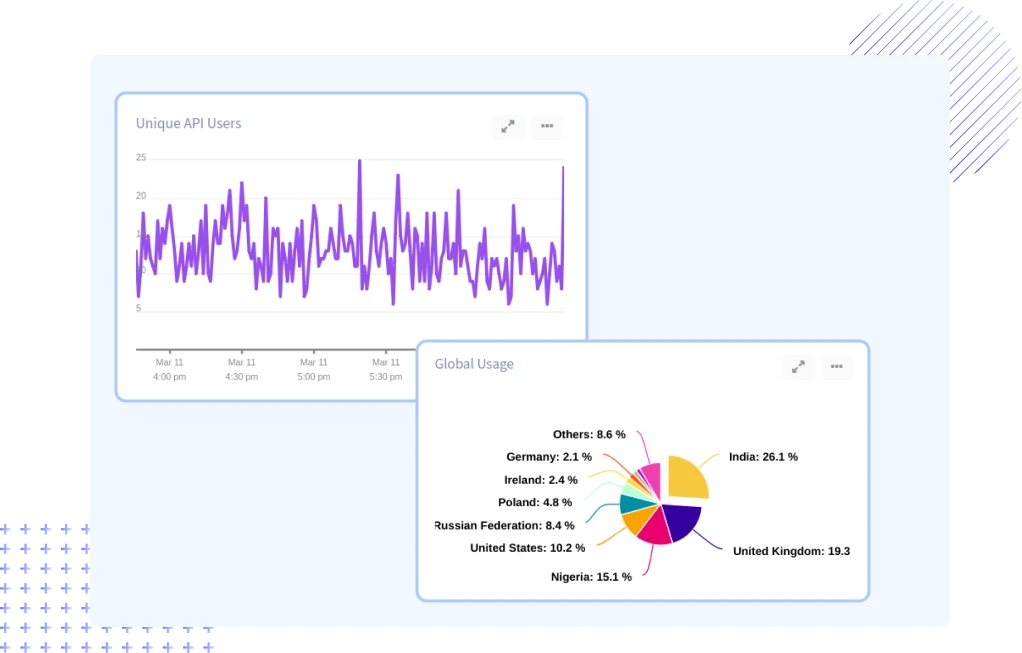
Atatus is a full-stack performance monitoring solution that offers great insight into how your entire software stack works. We monitor your application and servers in real-time and provide actionable insights which helps you to increase uptime and speed up your application's performance.

Free Sign Up. No Credit Card Required. Cancel Anytime.
App Performance

Measure and enhance app's performance

Performance of your application matters a lot at present since there are lot of good competition in all market segments. Thus, monitoring your application consistently for its performance does not let you down anywhere and increases the productivity and revenue of your organization.

Learn morearrow icon
Performance Dashboard

Gain insights in an integrated dashboard

Gain in depth knowledge about your back-end performance, server metrics, service logs and site performance. Atatus offers intuitive charts with great insights along with intelligent alerting using which you can identify issues and resolve them quickly.

Compare Releases

Compare releases

Identify the changes in your application and ensure whether it is performing as expected. Compare the older and new releases of your application before it goes live to make sure it doesn't affect your older version. Delight your customers with more releases to avoid bad user-experience.

Error Tracking

Spot the errors

Get to know about app crashes before it could impact a lot of your customers. Atatus also provides API failure monitoirng along with the HTTP status code and affected user details which will help you in clearing all the errors with ease.

FAQs on Monitoring Application Performance

How does Atatus help with application development?

Atatus offers features like application performance monitoring (APM), infrastructure monitoring, log management, and more. These tools allow developers to gain insights into application performance, identify bottlenecks, troubleshoot issues, and optimize code for better user experience.

What is Atatus APM?

Atatus APM (Application Performance Monitoring) is a feature that allows developers to trace requests as they flow through their applications. It provides detailed insights into performance metrics, dependencies, and errors, helping developers optimize application performance and improve user experience.

How can I integrate Atatus with my application?

Atatus provides various integration options including SDKs for different programming languages, APIs, and agent-based monitoring. Depending on your application's tech stack and requirements, you can choose the appropriate integration method to start monitoring your application with Atatus.

Can Atatus monitor containerized applications?

Yes, Atatus supports monitoring of containerized applications. It provides integrations with container orchestration platforms like Kubernetes, Docker, and Amazon ECS, allowing developers to monitor the performance of containerized workloads alongside other infrastructure components.

Does Atatus support distributed tracing?

Yes, Atatus supports distributed tracing, which allows developers to trace requests across microservices and distributed systems. It provides insights into the performance of each service, helping identify latency issues and optimize service-to-service communication.

How does Atatus APM trace requests within an application?

Atatus APM employs distributed tracing, where each traced request is assigned a unique trace ID. Instrumentation libraries embedded within the application code capture spans, representing segments of code execution, and send them to Atatus's backend for aggregation and analysis. This process allows developers to visualize the entire lifecycle of requests as they traverse through different components and services.

Can Atatus monitor serverless applications?

Yes, Atatus offers support for monitoring serverless applications deployed on platforms such as AWS Lambda, Azure Functions, and Google Cloud Functions. Through integrations with serverless platforms and libraries, Atatus can capture metrics, logs, and traces from serverless function invocations, allowing developers to monitor performance, troubleshoot issues, and optimize resource utilization.

How does Atatus handle high cardinality data in application monitoring?

Atatus employs techniques like tag indexing and cardinality-aware storage to efficiently handle high cardinality data in application monitoring. Tags allow developers to add metadata to metrics, logs, and traces, enabling flexible querying and aggregation. Atatus's backend architecture utilizes scalable storage solutions and indexing mechanisms optimized for high cardinality data, ensuring fast and reliable access to metrics and traces even in high-throughput environments.

Can Atatus provide insights into database performance for application developers?

Yes, Atatus offers integrations with popular databases such as PostgreSQL, MySQL, MongoDB, and Redis to provide insights into database performance. By collecting metrics related to query execution time, throughput, and resource utilization, Atatus enables developers to identify performance bottlenecks, optimize database queries, and ensure the overall health and reliability of database-backed applications.

What products does Atatus provide?

Atatus supports a wide range of products across various domains to help organizations monitor and optimize their systems and applications.

  1. Application Performance Monitoring
  2. Real User Monitoring
  3. Synthetic Monitoring
  4. Logs Monitoring
  5. Infrastructure Monitoring
  6. API Analytics
  7. Database Monitoring
  8. Kubernetes Monitoring

You're in good company.

You don't have to trust our word. Hear what our customers say!

Atatus is a great product with great support. Super easy to integrate, it automatically hooks into everything. The support team and dev team were also very helpful in fixing a bug and updating the docs.
Tobias
Tobias L
Full Stack Engineer, ClearVoyage
Atatus is powerful, flexible, scalable, and has assisted countless times to identify issues in record time. With user identification, insight into XHR requests to name a few it is the monitoring tool we choose for our SPAs.
Jan Paul
Jan-Paul B
Chief Executive Officer, iSavta
Atatus continues to deliver useful features based on customer feedback. Atatus support team has been responsive and gave visibility into their timeline of requested features.
Daniel
Daniel G
Software Engineer, MYND Management

Ready to see actionable data?

Avail Atatus features for 14 days free-trial. No credit card required. Instant set-up.