OpenTelemetry - Making Visibility Easy

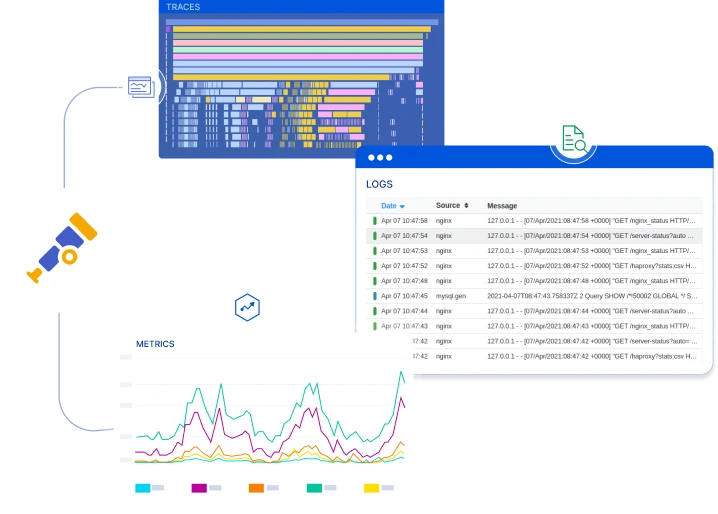
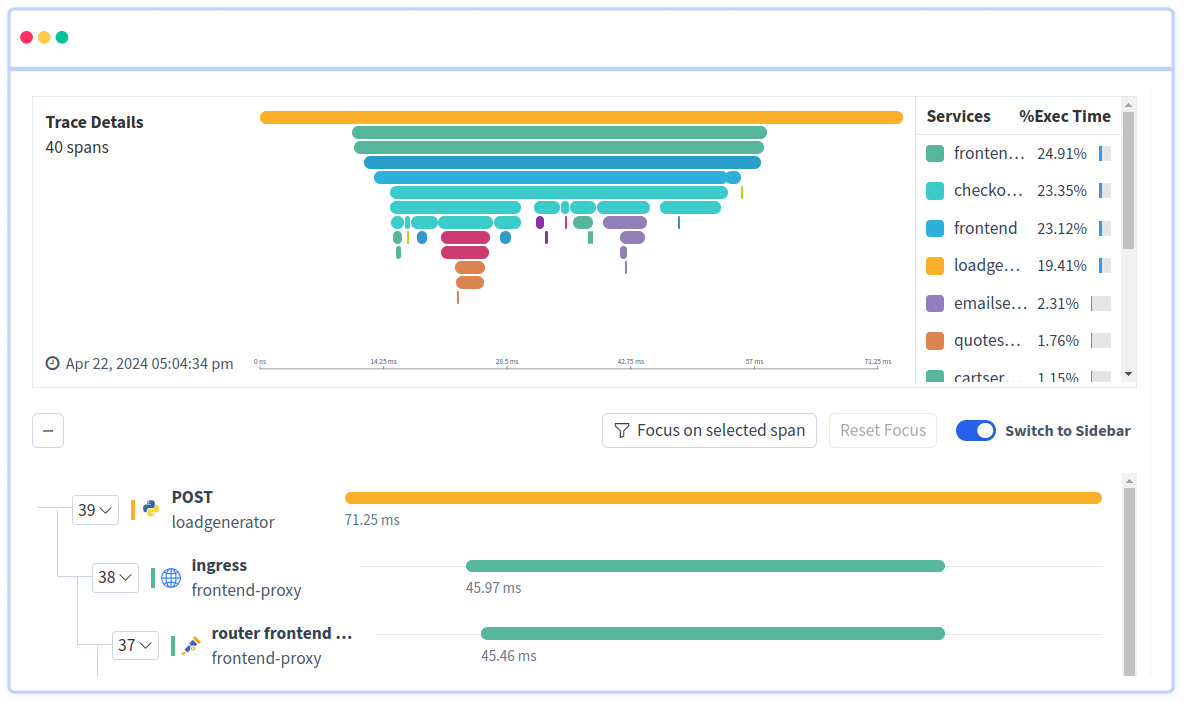
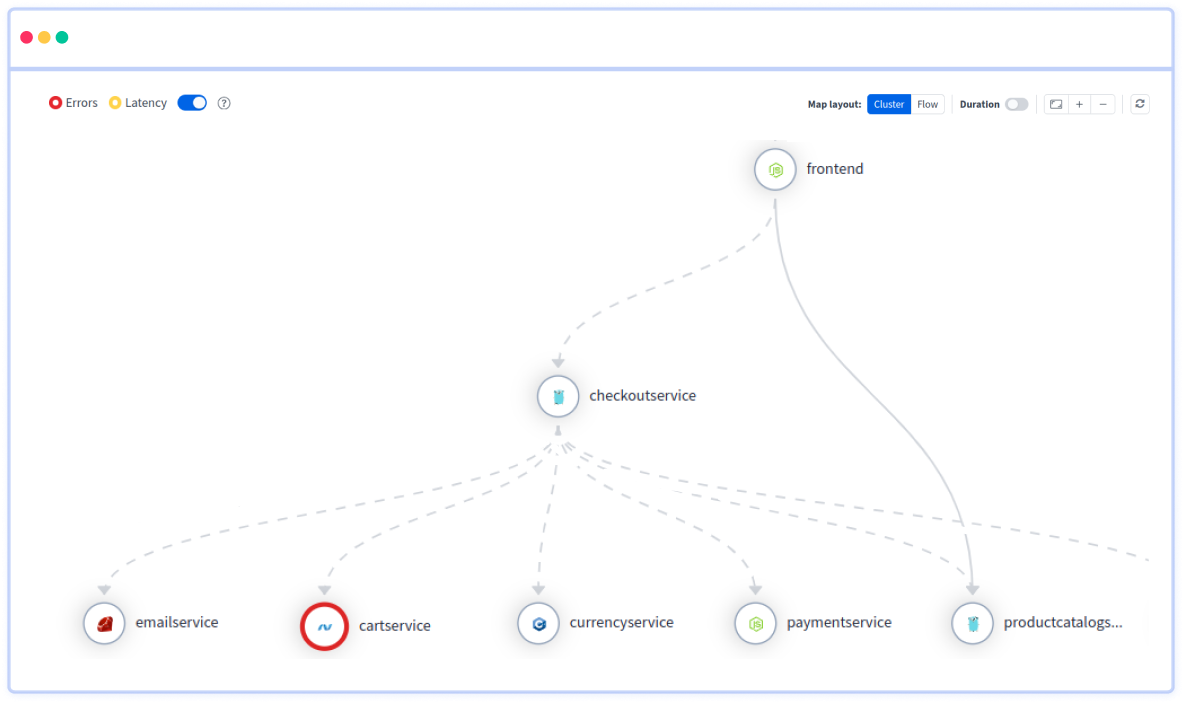
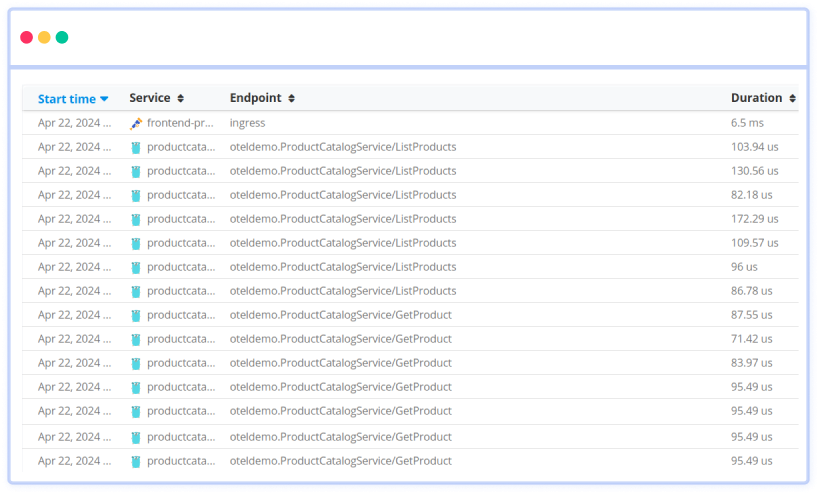
Effortlessly integrate telemetry data from metrics, logs, and traces to simplify data aggregation across your entire stack, enabling holistic insights into system performance and behavior.

Free Sign Up. No Credit Card Required. Cancel Anytime.
Opentelemetry Traces
Transactions Response TimeUnified Metrics

Logs, Metrics, Traces in One Place

Three pillars of observability integrated into a single platform ensure that each log message, metric data point, and trace span are enriched with contextual information, facilitating seamless correlation between different data types for faster root cause analysis and more effective problem resolution.

OTEL Root Cause Analysis
Transactions Response TimeCorrelate Data

Root-Cause Analysis with Diverse Data and OTEL

Correlating diverse data sources—from logs to tracing to transactions—in Atatus with OpenTelemetry (OTEL) empowers precise root-cause analysis. By providing rich context and correlation between different data types, the integration reduces mean time to resolution (MTTR) by revealing complex dependencies and patterns, ultimately enhancing troubleshooting efficiency.

OpenTelemetry Data Ingestion
Transactions Response TimePartner

Pioneering the Future of Instrumentation

Users can seamlessly ingest telemetry data from any OTEL-compatible source, whether it's a microservice on Kubernetes or a legacy monolithic app, ensuring consistent collection across the stack. Plus, with Atatus as an OpenTelemetry Adoption Partner, instrumenting everything becomes effortlessly streamlined.

Uniform Observability Standards
Transactions Response TimeStandard Approach

Uniform Observability Standards Across Teams

Standardized metrics, logging, and tracing instrumentation streamline collaboration, simplify onboarding, and ensure consistent monitoring across diverse microservices architectures, enabling teams to proactively address performance bottlenecks, enhance system resilience, and deliver more reliable applications to end-users.

FAQs about OpenTelemetry Monitoring

What is OpenTelemetry?

OpenTelemetry is a set of APIs, libraries, and agents that aims to provide a standardized way to instrument, generate, collect, and export telemetry data for cloud-native software. It allows developers to instrument their applications to collect metrics, traces, and logs, which can then be exported to various backends for analysis and visualization.

What are the benefits of using OpenTelemetry with Atatus?

Integrating OpenTelemetry with Atatus allows users to leverage Atatus's powerful monitoring and analytics platform to gain comprehensive visibility into their applications and infrastructure. Benefits include:

  1. Centralized monitoring: Users can view metrics, traces, and logs from their applications and infrastructure in a single platform, making it easier to troubleshoot issues and optimize performance.
  2. Distributed tracing: OpenTelemetry's tracing capabilities, combined with Atatus's distributed tracing features, enable users to trace requests across distributed systems, identify bottlenecks, and optimize application performance.
  3. Rich visualization and analysis: Atatus offers a wide range of visualization and analysis tools, allowing users to create custom dashboards, set up alerts, and perform deep dives into their telemetry data to gain insights and make informed decisions.
  4. Scalability and flexibility: Both OpenTelemetry and Atatus are designed to scale with the needs of modern cloud-native applications, making them suitable for monitoring applications of any size or complexity.
How do I get started with OpenTelemetry Monitoring with Atatus?

To get started, you'll need to instrument your applications using the OpenTelemetry SDK for your programming language. Then, configure the OpenTelemetry exporters to send data to Atatus. Atatus provides documentation and guides to help with the integration process.

Can I use OpenTelemetry with Atatus in a multi-cloud environment?

Yes, OpenTelemetry with Atatus can be used in multi-cloud and hybrid cloud environments. You can instrument your applications running in various cloud providers or on-premises environments and send the telemetry data to Atatus for centralized monitoring and analysis.

How does OpenTelemetry handle distributed tracing when exporting traces to Atatus?

OpenTelemetry automatically instruments your applications to capture distributed traces, including context propagation across service boundaries. When exporting traces to Atatus, OpenTelemetry ensures that the trace context is preserved and propagated to provide end-to-end visibility into distributed transactions.

How does OpenTelemetry handle resource utilization and performance overhead when instrumenting applications for monitoring with Atatus?

OpenTelemetry is designed to minimize resource utilization and performance overhead when instrumenting applications for monitoring with Atatus. Instrumentation libraries and exporters are optimized for efficiency, and you can configure sampling rates and resource limits to control the impact on application performance and resource consumption.

What products does Atatus provide?

Atatus supports a wide range of products across various domains to help organizations monitor and optimize their systems and applications.

  1. Application Performance Monitoring
  2. Real User Monitoring
  3. Synthetic Monitoring
  4. Logs Monitoring
  5. Infrastructure Monitoring
  6. API Analytics
  7. Database Monitoring
  8. Kubernetes Monitoring

You're in good company.

You don't have to trust our word. Hear what our customers say!

Atatus is a great product with great support. Super easy to integrate, it automatically hooks into everything. The support team and dev team were also very helpful in fixing a bug and updating the docs.
Tobias
Tobias L
Full Stack Engineer, ClearVoyage
Atatus is powerful, flexible, scalable, and has assisted countless times to identify issues in record time. With user identification, insight into XHR requests to name a few it is the monitoring tool we choose for our SPAs.
Jan Paul
Jan-Paul B
Chief Executive Officer, iSavta
Atatus continues to deliver useful features based on customer feedback. Atatus support team has been responsive and gave visibility into their timeline of requested features.
Daniel
Daniel G
Software Engineer, MYND Management

Trusted Protection through Global Compliance

Feel assured as we maintain rigorous security protocols, ensuring the safety of your data with every interaction

Soc 2 Type 2 Compliant
ISO 27001 Certified
ISO 27001 Certified
GDPR & CCPA Compliant

Ready to see actionable data?

Avail Atatus features for 14 days free-trial. No credit card required. Instant set-up.