Kafka Runtime Activity and Replication Health Logs
Track topic activity, cluster coordination events, performance signals, and access behavior across Kafka streaming environments in real time.
Monitor Kafka logs to troubleshoot brokers, topics, and message delivery issues
Broker startup and shutdown logs
Analyze Kafka broker logs to detect configuration errors, JVM startup failures, listener binding issues, and unclean shutdown events.
Track partition and leader events
Monitor Kafka log entries related to leader elections, partition reassignments, ISR shrinkage, and replica state changes.
Detect producer and consumer errors
Capture Kafka logs reporting producer send failures, consumer group rebalances, offset commit errors, and deserialization issues.
Monitor replication health
Inspect Kafka replication logs to identify under-replicated partitions, fetcher lag, and broker communication failures.
Track log retention and cleanup
Analyze Kafka log cleaner and retention-related messages to verify segment deletion, compaction behavior, and disk usage patterns.
Identify controller warnings
Detect controller log warnings related to Zookeeper or KRaft metadata inconsistencies affecting cluster stability.
Observe disk and I O issues
Capture Kafka logs reporting disk failures, log directory errors, and write latency affecting message persistence.
Correlate streaming and application logs
Link Kafka log events with application logs to trace message delivery failures back to producing or consuming services.
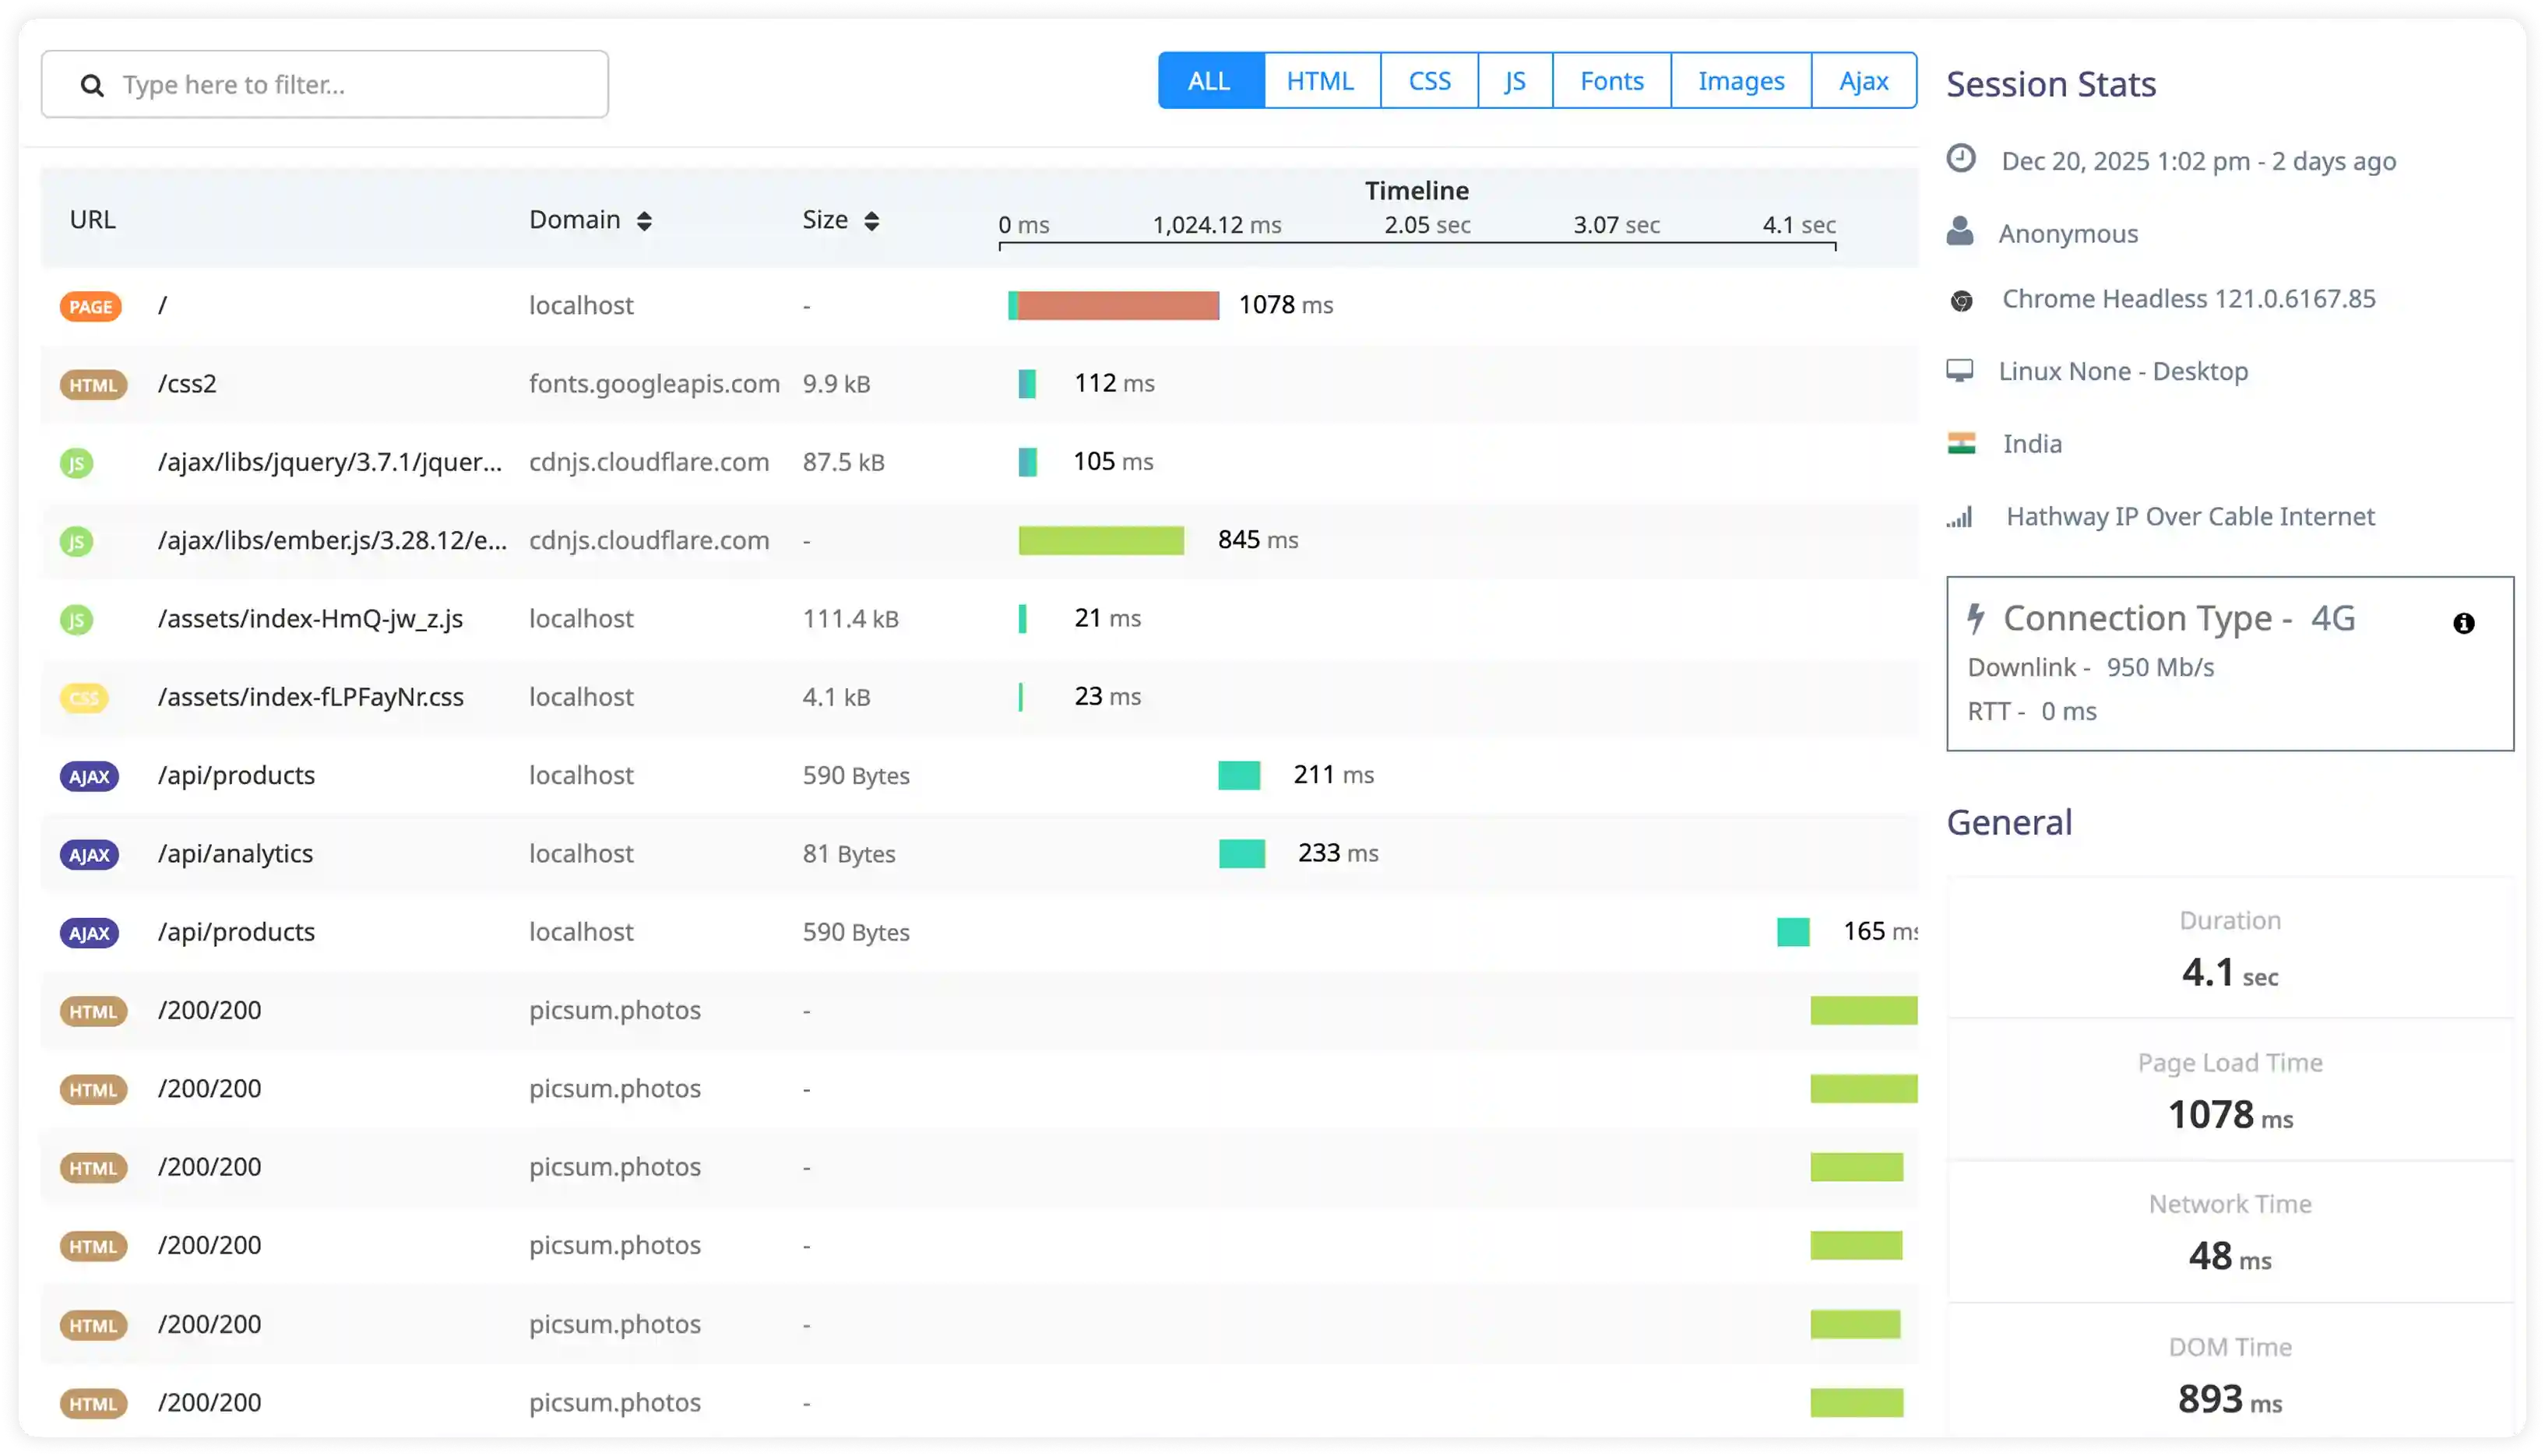
Broker and Topic Activity
- Monitor Kafka broker logs capturing topic creation, partition assignment, leader election, and request handling to understand message flow across the cluster.
- Correlate producer and consumer interactions with topic-level events to trace data ingestion and consumption behavior.
- Identify failed publish attempts, partition unavailability, and broker-side errors impacting message delivery.
- Detect disruptions in topic activity that affect event streaming continuity and system throughput.
Replication and Cluster Coordination
- Capture replication logs, ISR state changes, and controller communication events across Kafka brokers.
- Correlate replica lag, partition reassignments, and broker health with workload spikes and infrastructure conditions.
- Identify synchronization failures, leader instability, and cluster imbalance affecting reliability.
- Detect operational risks impacting data durability and failover readiness.
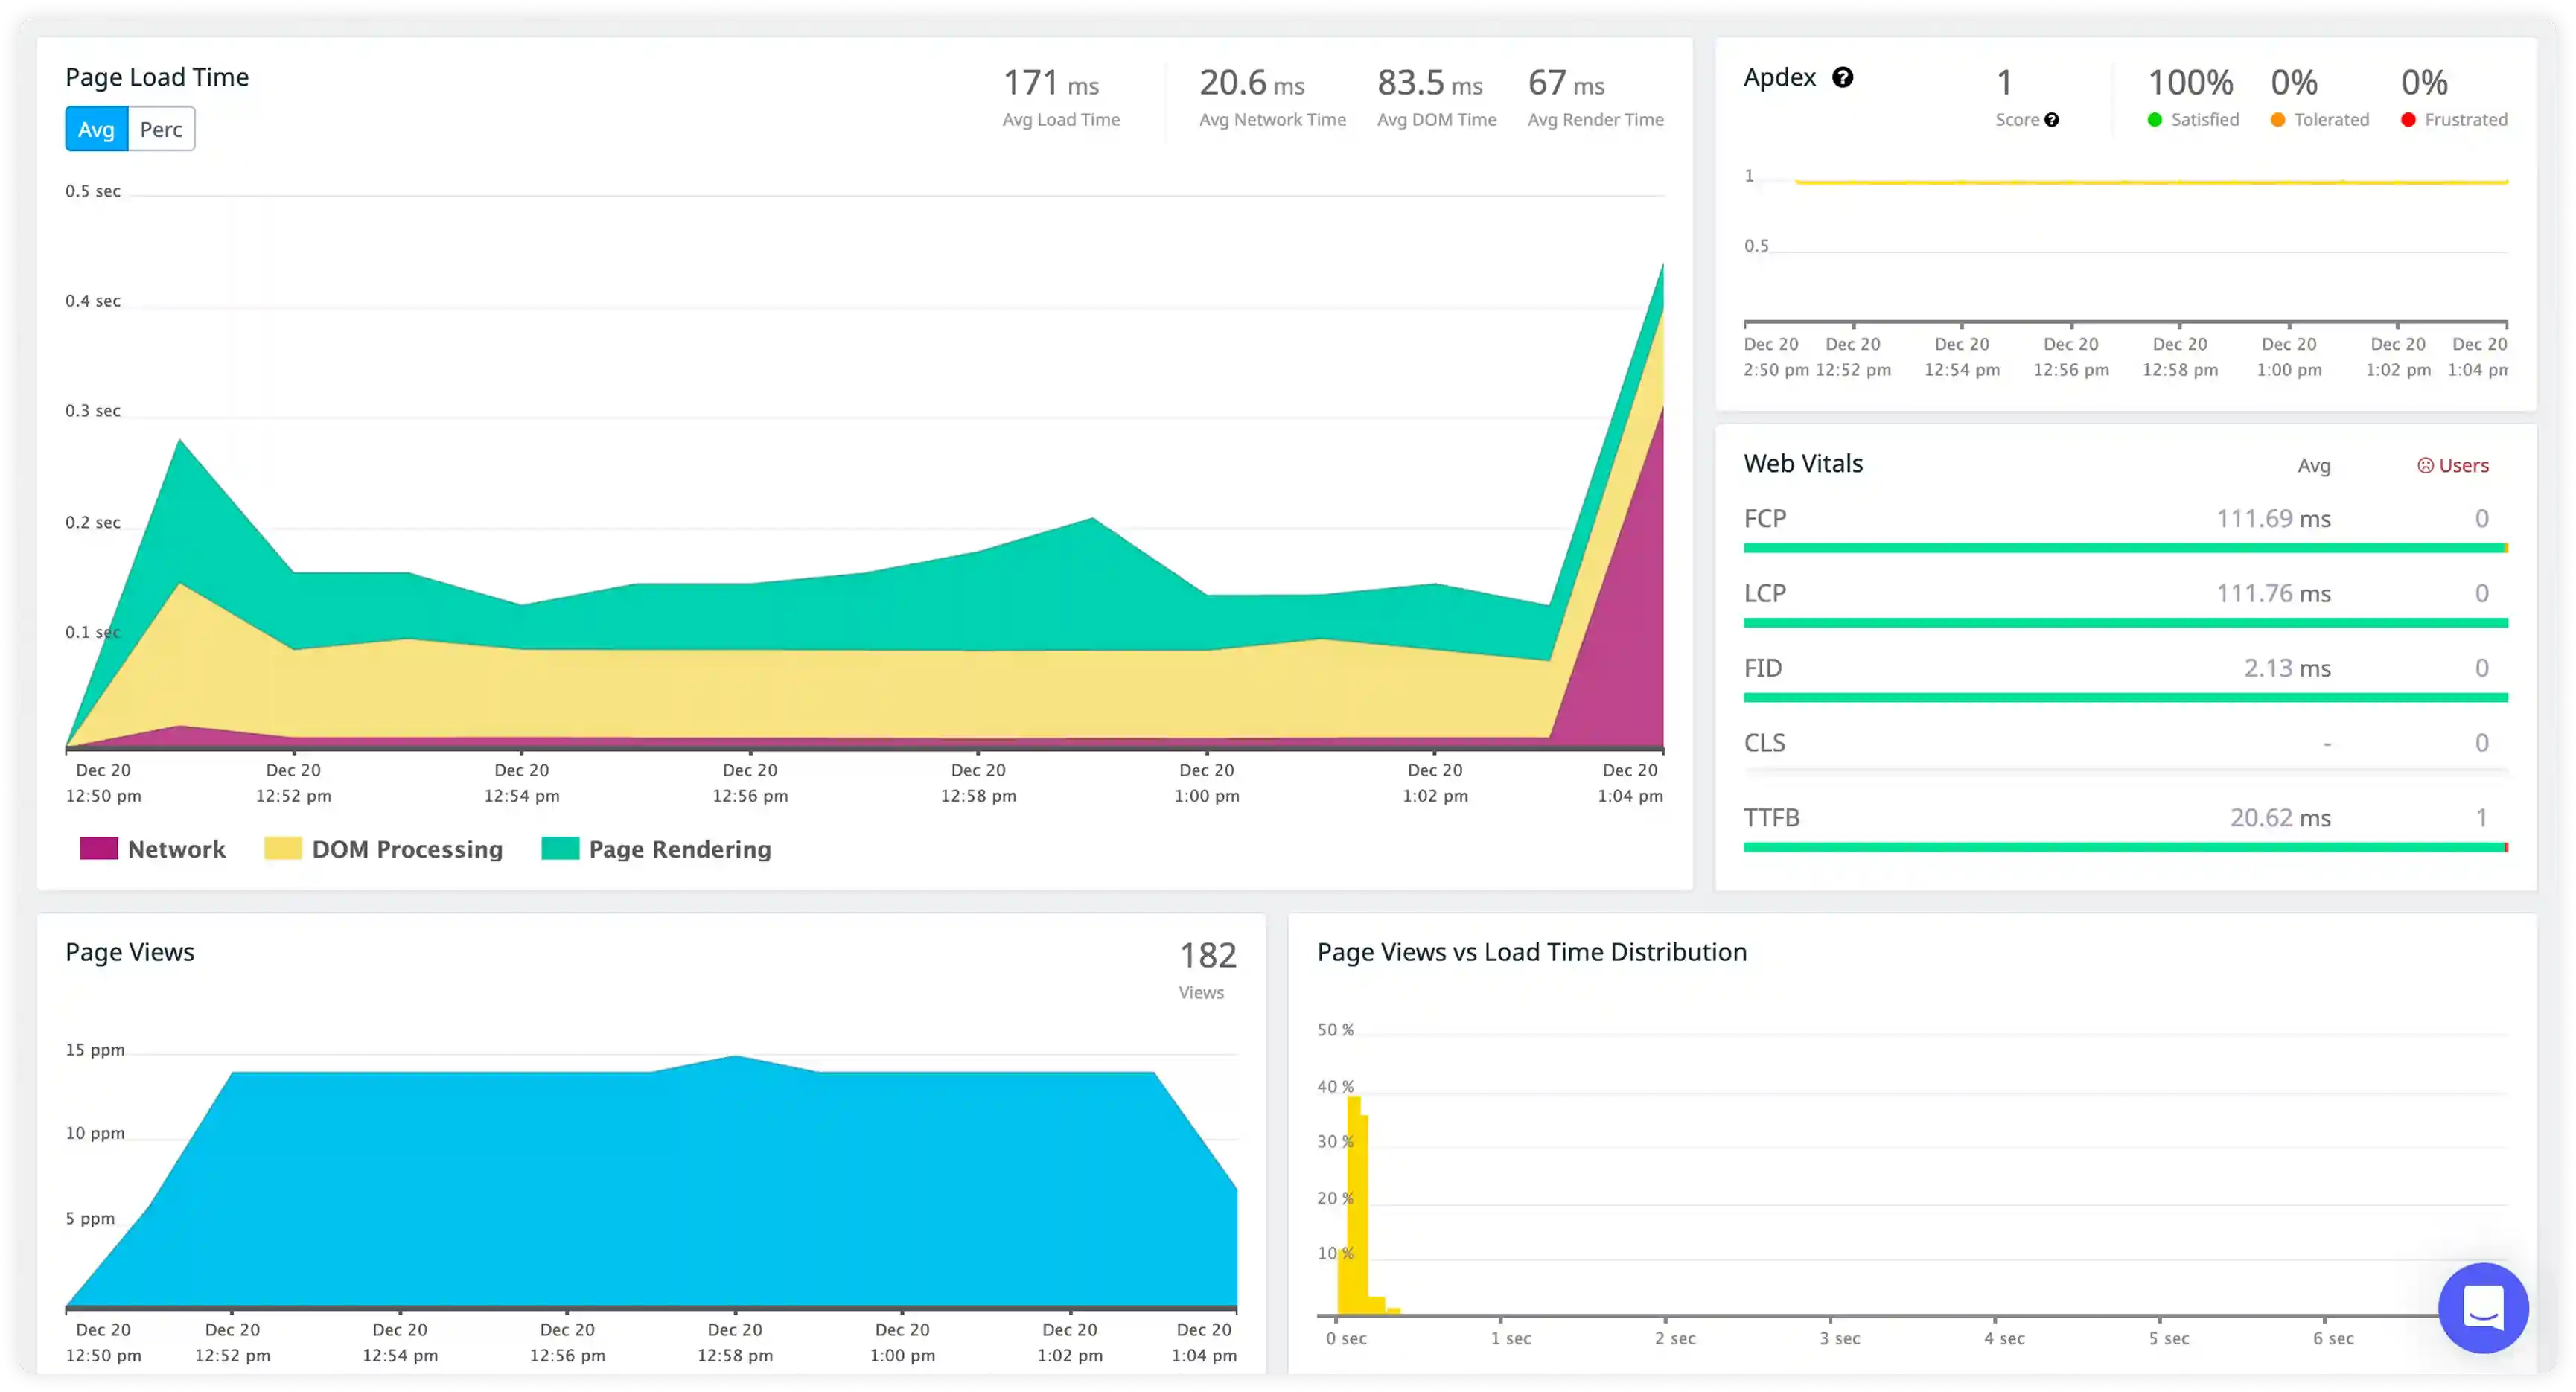
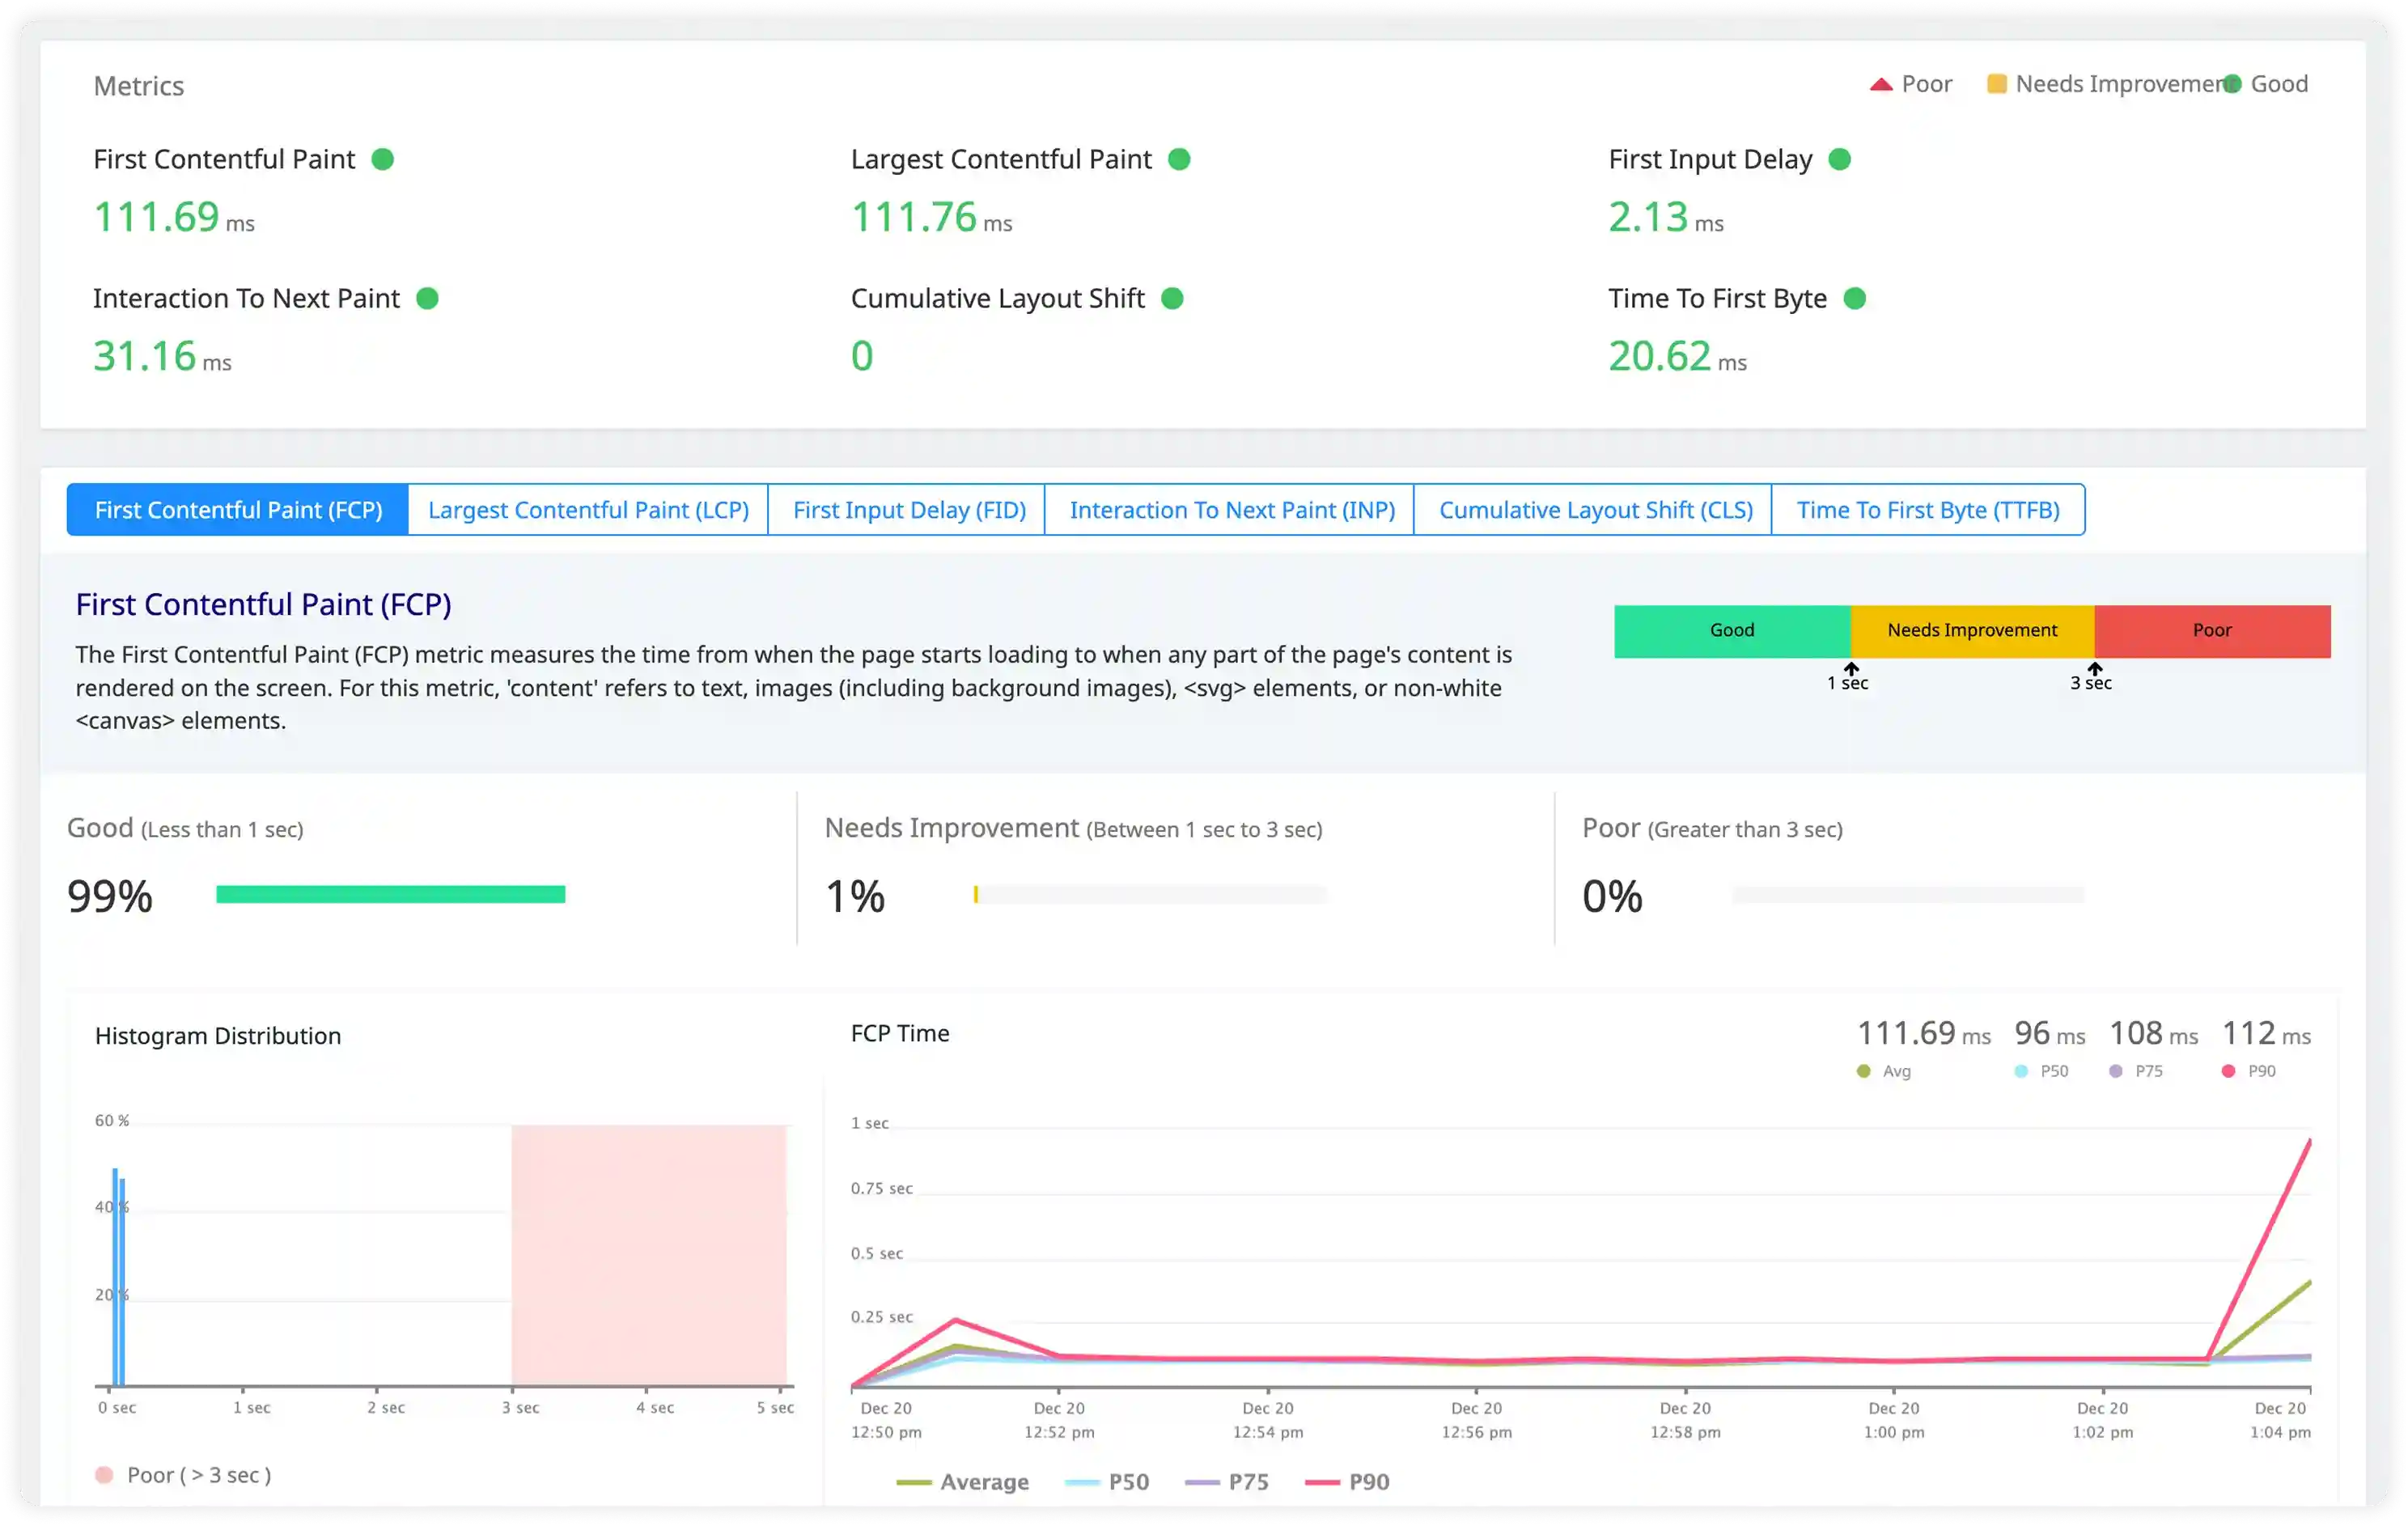
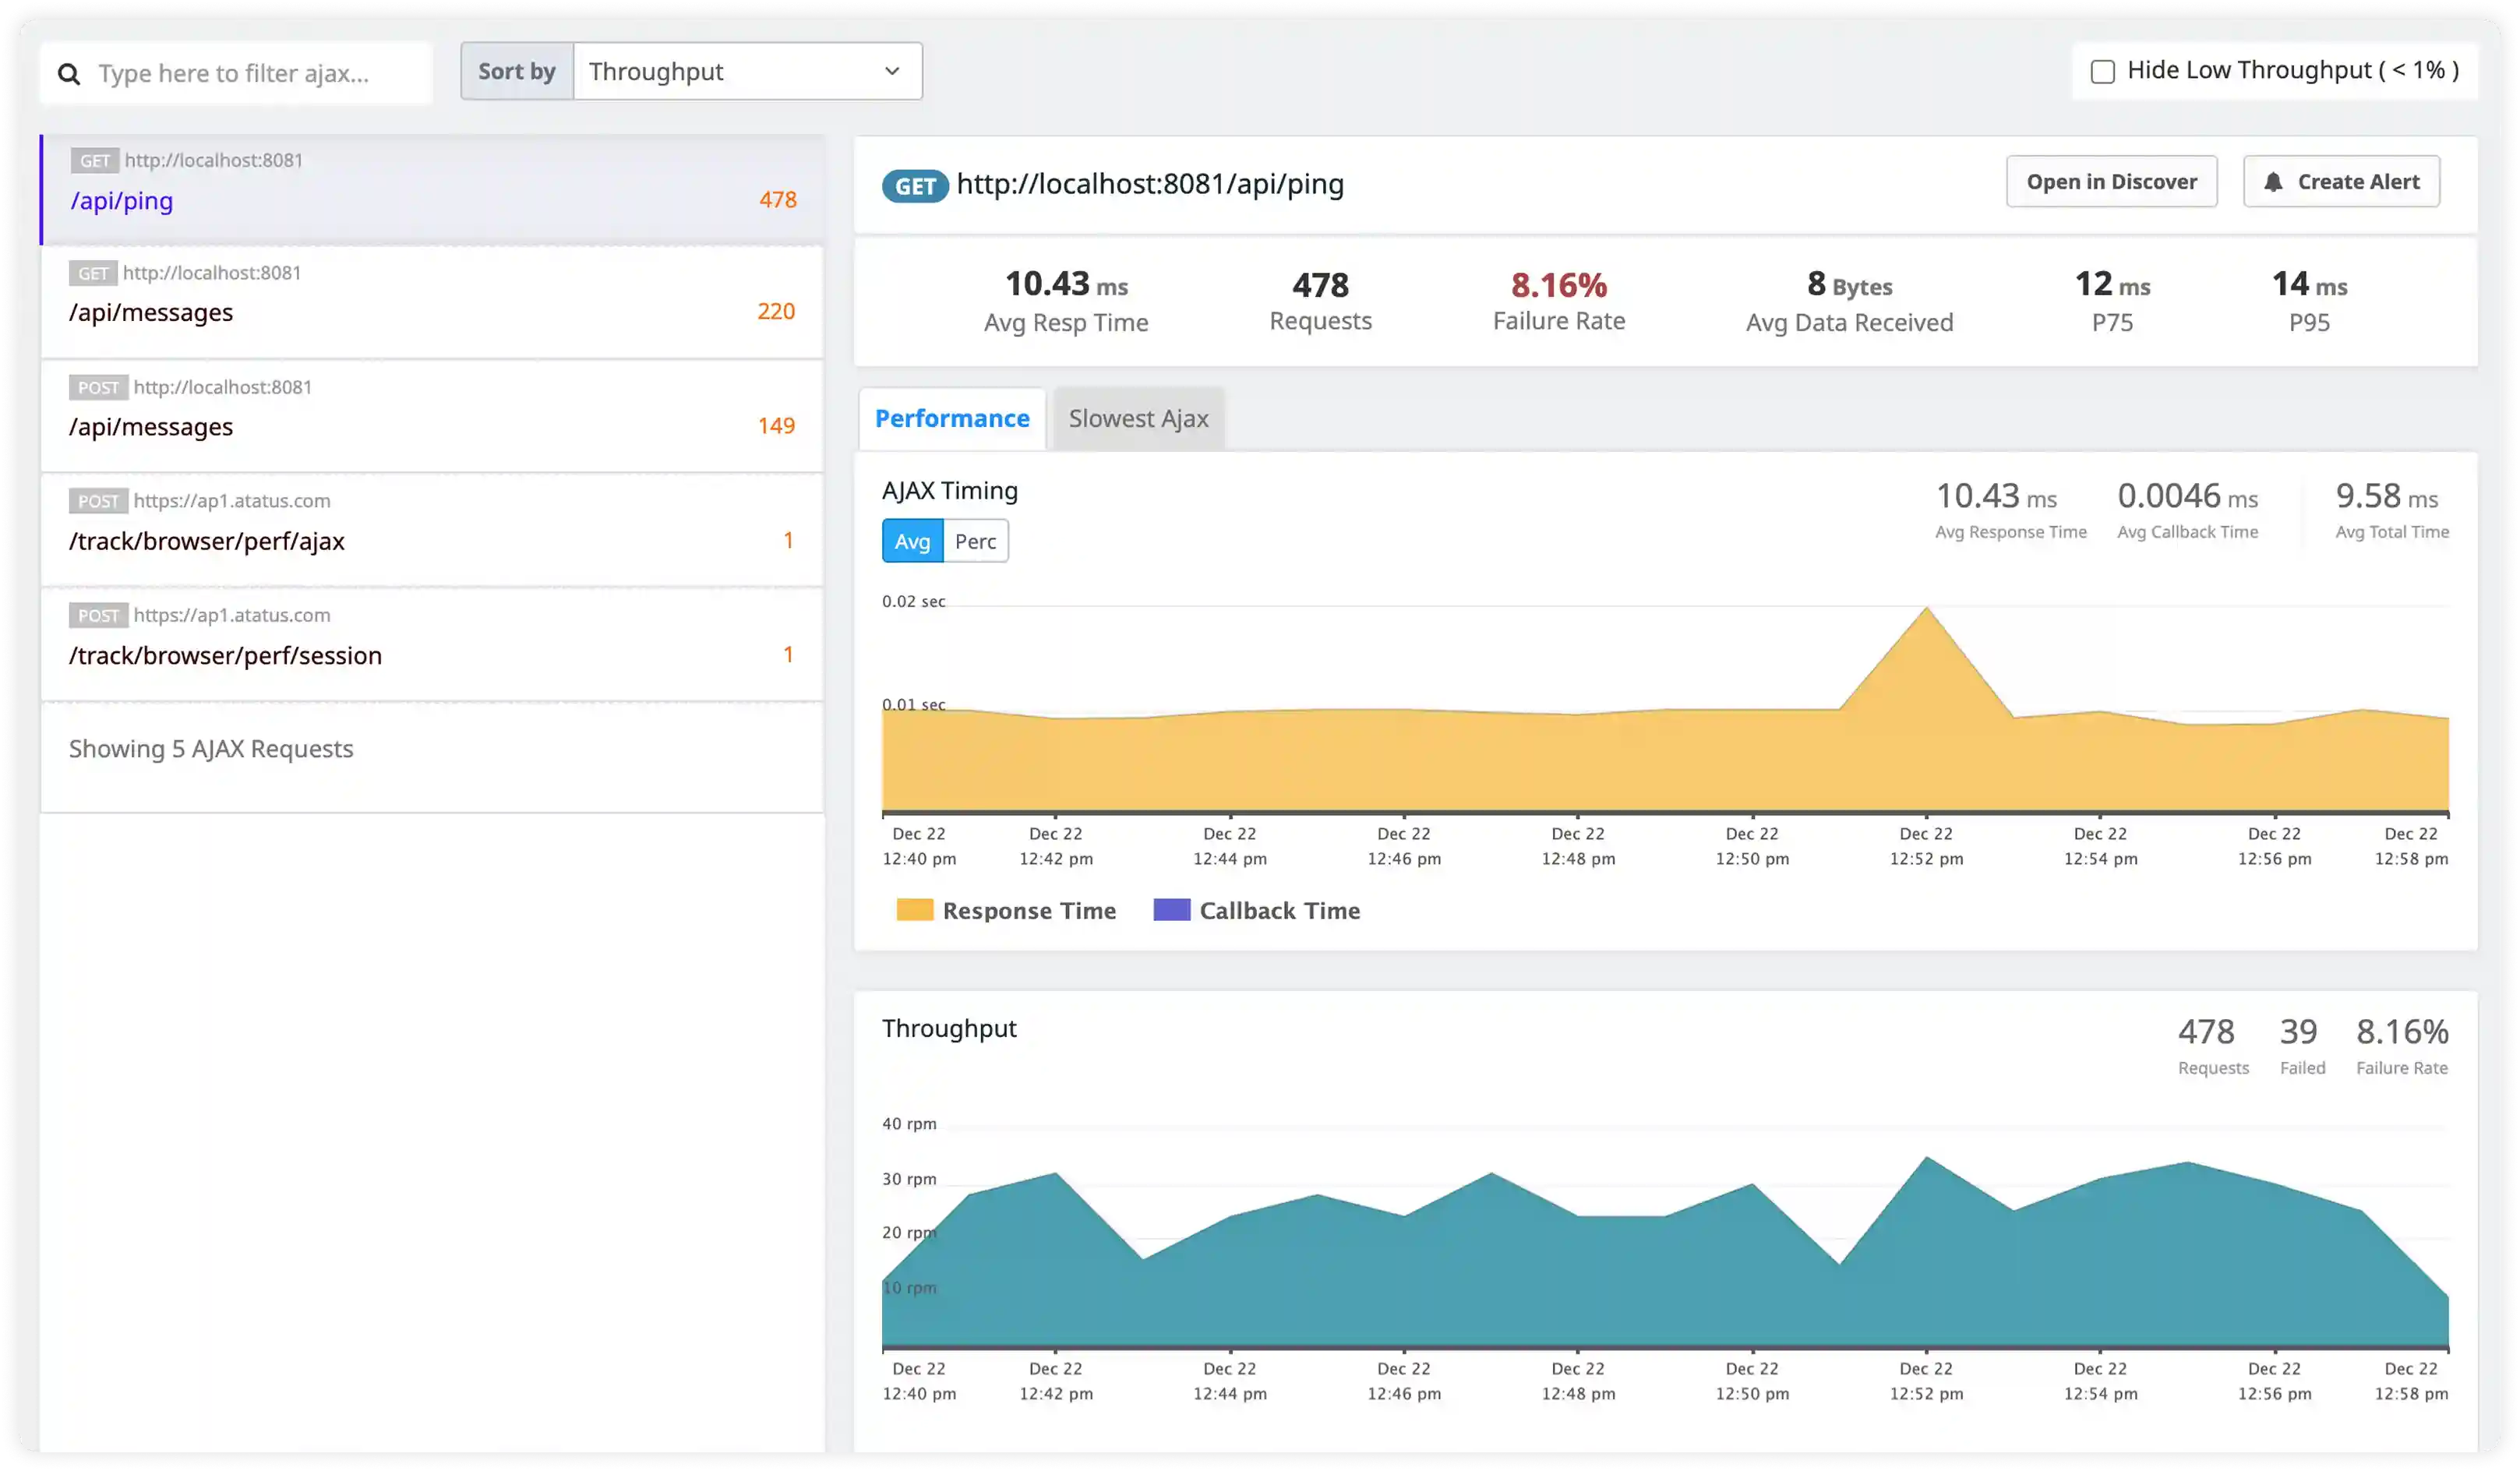
Performance and Throughput Signals
- Analyze request latency logs, fetch and produce timing metrics, and network I/O behavior influencing Kafka performance.
- Correlate message size distribution, batch processing patterns, and consumer lag with throughput fluctuations.
- Identify bottlenecks in disk I/O, network bandwidth, and broker processing that increase end-to-end latency.
- Detect performance degradation through abnormal request timing and irregular traffic patterns.
Security and Access Monitoring
- Track authentication attempts, ACL validation events, and unauthorized access patterns captured in Kafka logs.
- Identify misuse attempts, insecure client connections, and abnormal producer or consumer behavior.
- Correlate security events with application and infrastructure activity for incident investigation.
- Detect operational and security risks affecting Kafka deployments and streaming pipelines.
Why teams choose Atatus for Kafka logs monitoring
Kafka-native parsing
Atatus interprets broker, controller, and replication logs to extract operational signals automatically.
Cluster-wide visibility
Atatus centralizes logs from all Kafka brokers for a unified view of topics and partitions.
Streaming issue detection
Atatus identifies leader elections, ISR changes, and consumer instability through log analysis.
Real-time alerting
Atatus triggers alerts on broker failures, replication issues, and disk-related log events.
Cross-service correlation
Atatus connects Kafka logs with producer and consumer services to trace message flow issues.
High-volume ingestion
Atatus reliably ingests Kafka logs during peak traffic and cluster rebalancing.
Unified Observability for Every Engineering Team
Atatus adapts to how engineering teams work across development, operations, and reliability.
Developers
Trace requests, debug errors, and identify performance issues at the code level with clear context.
DevOps
Track deployments, monitor infrastructure impact, and understand how releases affect application stability.
Release Engineer
Measure service health, latency, and error rates to maintain reliability and reduce production risk.