Rails APM and Performance Monitoring

Monitor response times, throughput, and errors in your Rails applications with code-level observability for unparalleled performance insights.
Free Sign Up. No Credit Card Required. Cancel Anytime.

Uncover and Resolve Performance Bottlenecks Instantly

  • Pinpoint slow database queries, memory leaks, and CPU bottlenecks with ease.
  • Monitor Rails applications in real-time to capture precise performance data for lightning-fast operations.
  • Automatically detect and address performance anomalies before they impact end-users.
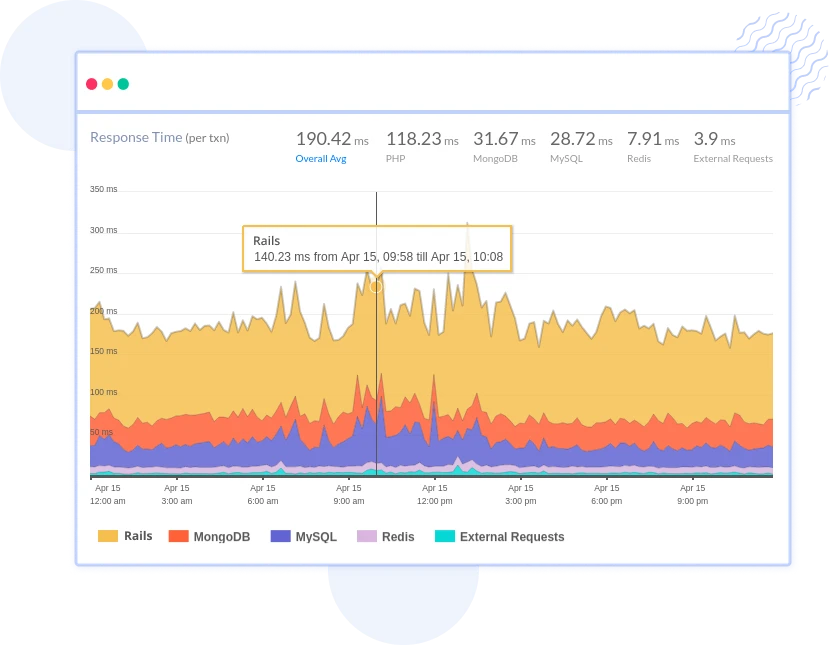
  • Visualize critical performance metrics through intuitive dashboards for streamlined monitoring.
Rails Dashboard

Achieve Complete Visibility in Rails Monitoring

  • Gain comprehensive visibility across your Rails applications, from real-time request handling to server-side performance.
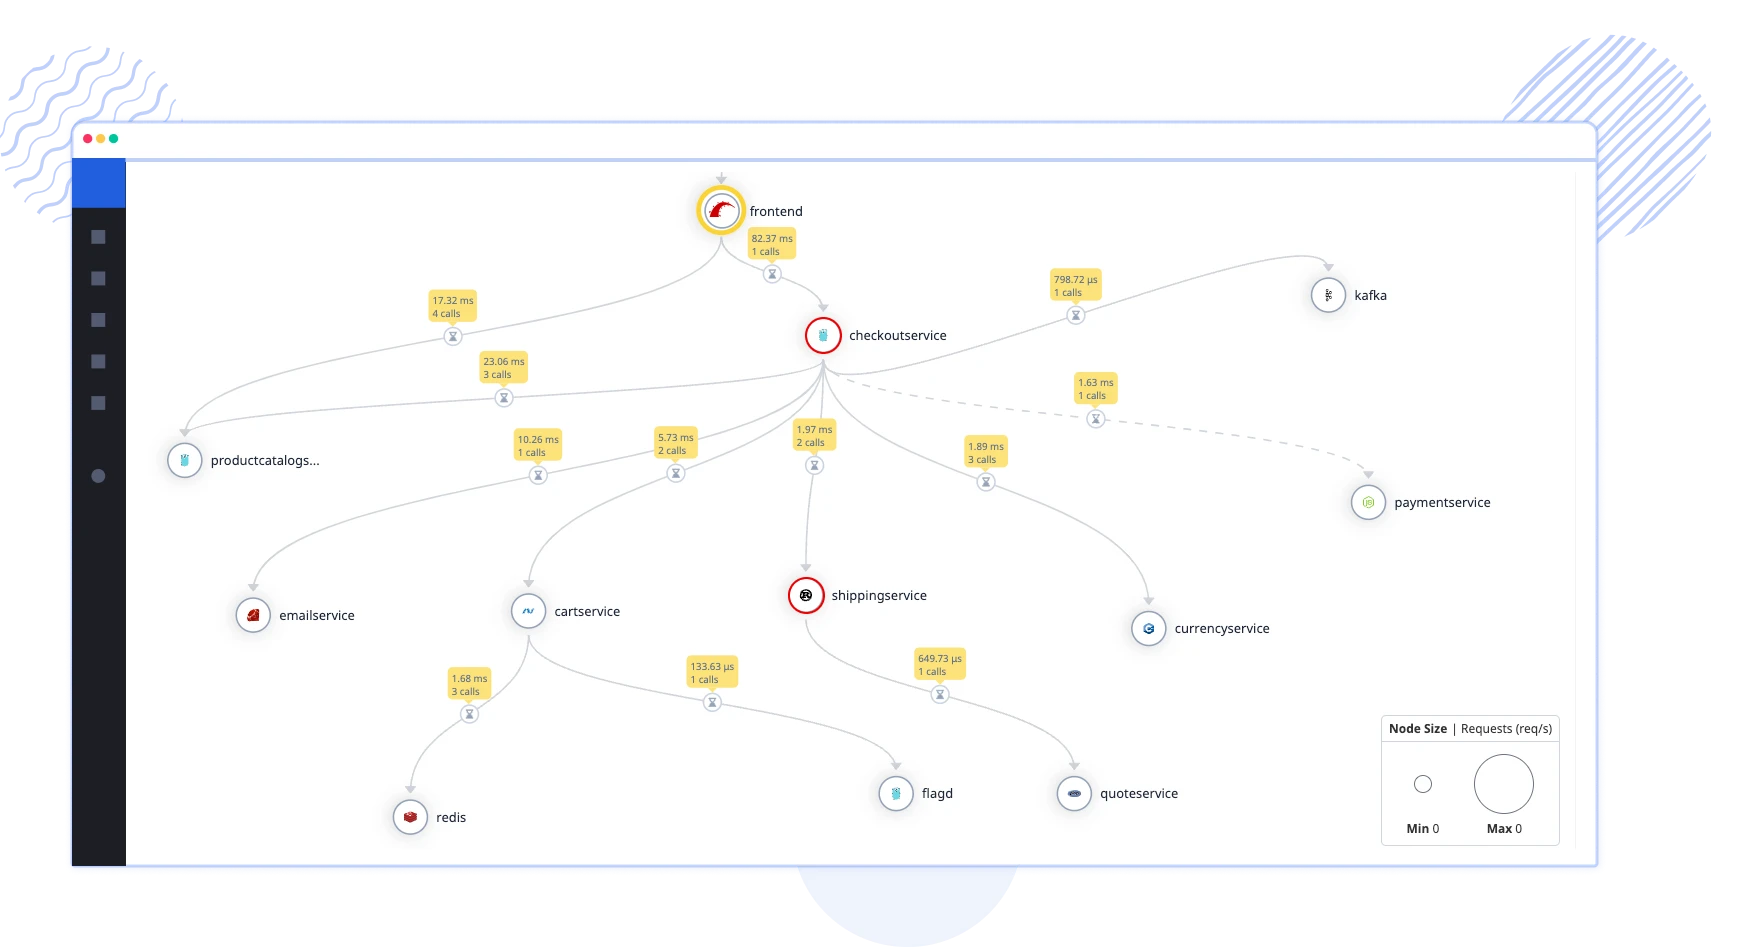
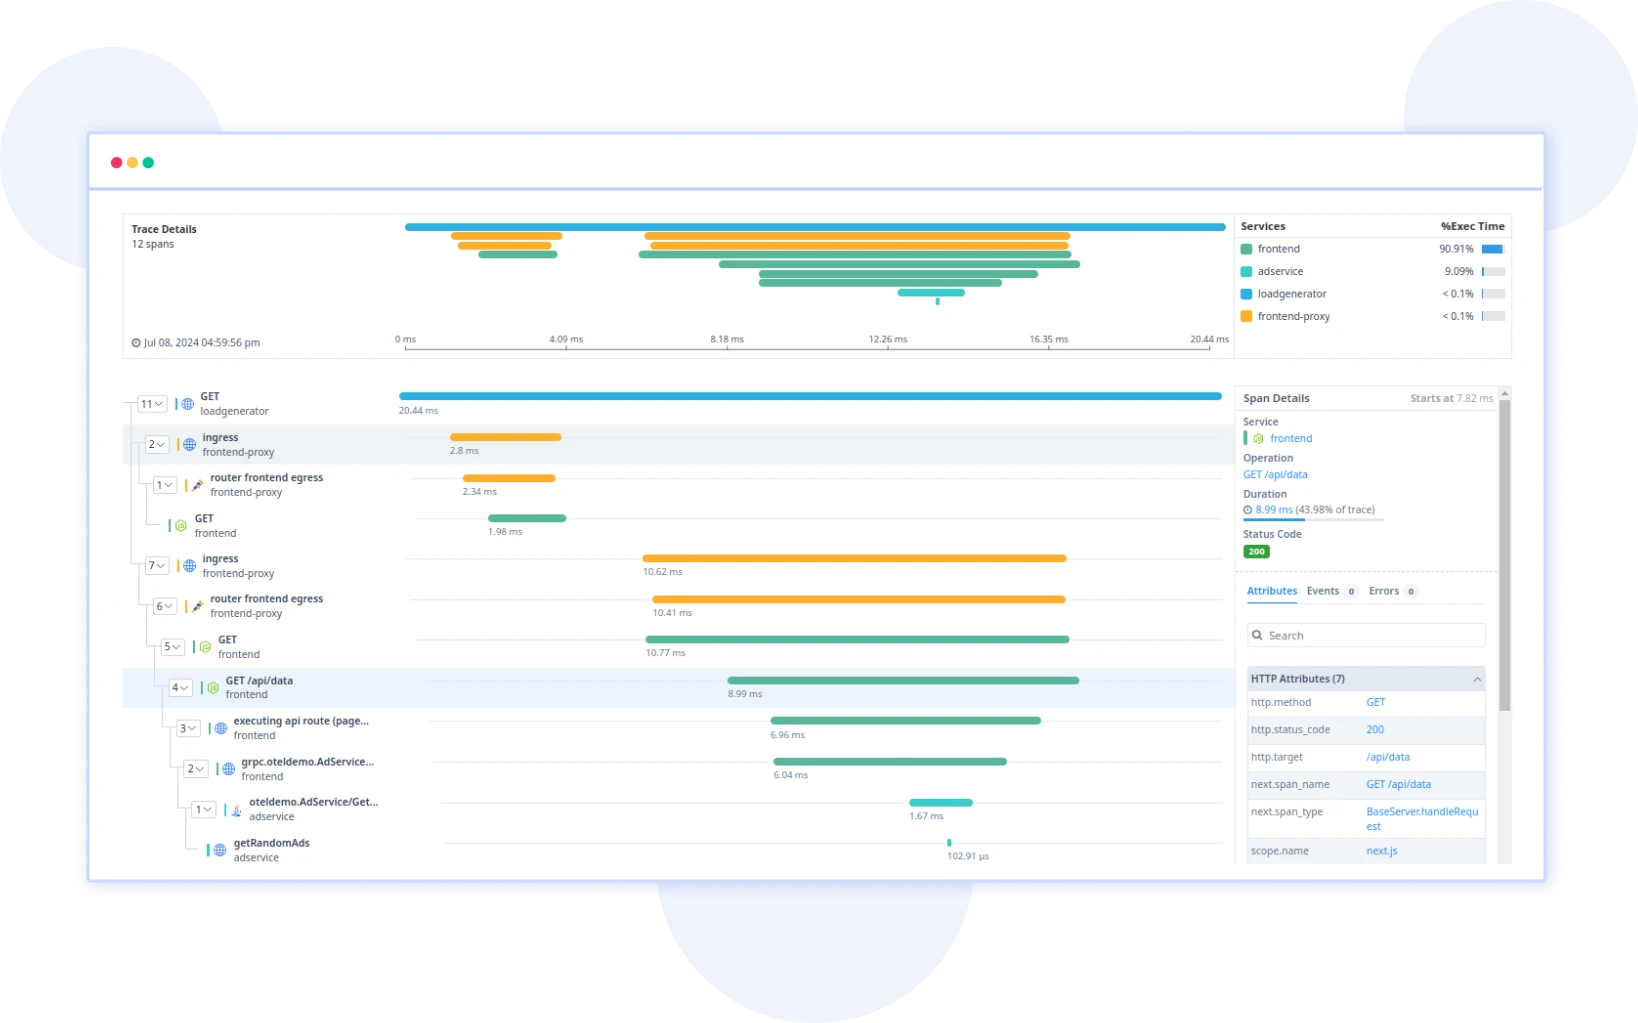
  • Trace every request in your distributed systems and optimize for faster performance across your Rails-powered apps.
  • Stay ahead of issues with proactive alerts that prevent minor inefficiencies from turning into major problems.
  • Leverage detailed logs and traces for quick troubleshooting and fine-tuned performance monitoring in Rails.
Rails Session Traces

Proactively Prevent Downtime for High Availability

  • Monitor Rails applications to minimize downtime and guarantee seamless performance.
  • Conduct rapid root cause analysis to resolve issues swiftly and boost system stability.
  • Set up customizable alerts to identify and mitigate potential downtime risks early.
  • Ensure maximum uptime by continuously monitoring critical performance metrics in Rails.
Rails Service Map

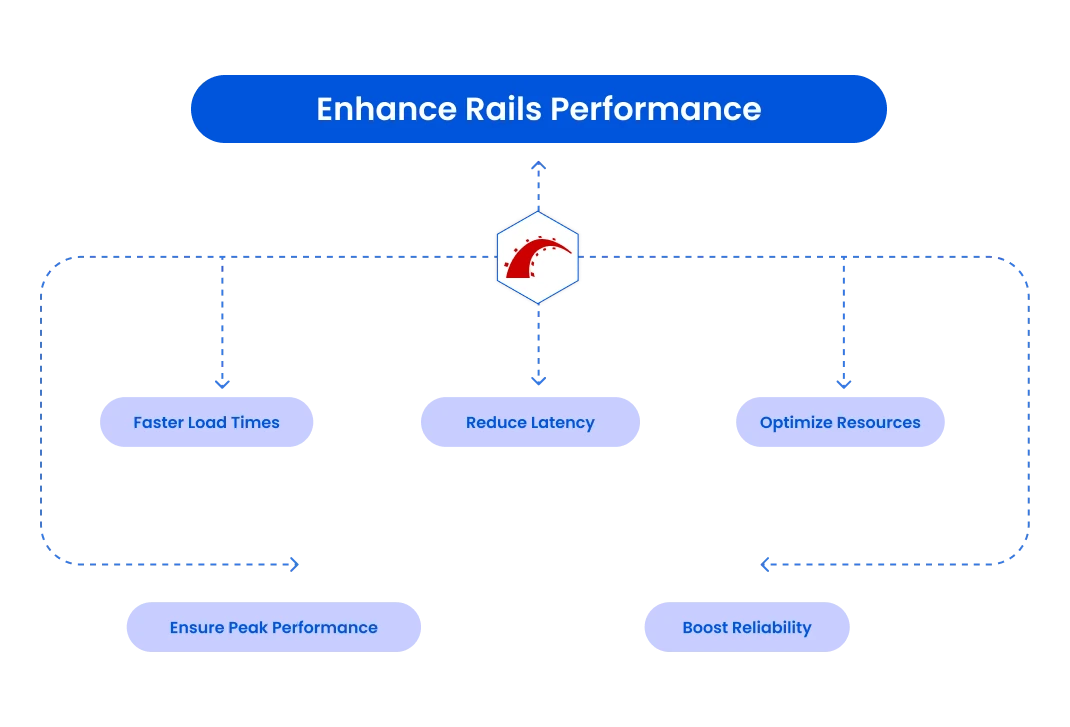
Boost User Satisfaction with Enhanced Rails Performance

  • Deliver a superior user experience with blazing-fast load times and optimized responsiveness.
  • Reduce latency and keep users engaged with the high-speed performance of Rails.
  • Optimize resource consumption to ensure peak performance under heavy traffic and demanding loads.
  • Enhance reliability through ongoing monitoring and fine-tuned performance optimization.
Rails Performance

Optimize ActiveRecord and Background Jobs for Peak Efficiency

  • Track and analyze slow or inefficient ActiveRecord queries to optimize database interactions and reduce bottlenecks.
  • Monitor background jobs in tools like Sidekiq and Redis to detect processing delays and maintain smooth task execution.
  • Evaluate memory and CPU usage in background job processing to improve efficiency under heavy workloads.
  • Get detailed insights into failed background jobs and resolve issues quickly, ensuring continuous and reliable task processing.
Rails Metrics

Start fixing issues impacting your users right now

Try it free. No credit card required. Instant set-up.

Awesome Support

Best APM Monitoring tool

"Atatus customer service is just amazing. I had before New Relic and Stackify and I can honestly say that Atatus compared to those two is the leader! Leader in pricing and user interface and ability to drill down to the problem."

— S Herman Kiefus, DevOps Admin, Compass

We've Got Your Stack Covered!

Boost Framework Performance

Boost Framework Performance

Gain insights into your performance, enhancing transaction flow and speeding up error resolution.

Trace Every Request Instantly

Trace Every Request Instantly

Visualize end-to-end traces across your stack, ensuring that you catch every error, performance issue, or bottleneck before it affects users.

Identify Slow Queries Instantly

Identify Slow Queries Instantly

Pinpoint and resolve slow database queries and eliminate performance bottlenecks impacting your application's responsiveness, leading to faster response times

Stay Alert to Vulnerabilities

Stay Alert to Vulnerabilities

Get alerted to potential library vulnerabilities, preventing security risks before they affect your customers or compliance.

Simplify Logs, Troubleshoot Faster

Simplify Logs, Troubleshoot Faster

Centralize all your logs in one place, and quickly identify the root cause of issues using advanced filtering, pattern detection, and log pipelines.

Custom Metrics That Matter

Custom Metrics That Matter

Set up and track custom metrics that align with your app's KPIs to ensure you're monitoring exactly what matters most for your success.

Quick Request Analysis Anytime

Quick Request Analysis Anytime

Explore request-level analysis, including stdout APM logs, to understand execution times, bottlenecks, and areas that need optimization.

Align APM with Server Metrics

Align APM with Server Metrics

Correlate your app’s APM metrics with server health to get a complete picture of your application’s performance and infrastructure dependencies.

Actionable Alerts

Actionable Alerts

Receive real-time alerts for app performance degradations and critical issues. Take immediate action to prevent downtime and optimize user experiences.

FAQ on Rails APM and Performance Monitoring

How to fix poor Rails performance?

To fix poor Rails performance:

  1. Identify performance issues: Use Rails APM tools to detect root causes of slowdowns, such as inefficient ActiveRecord queries, memory leaks, or high CPU usage.
  2. Optimize code: Refactor slow-performing code, optimize Rails services, and manage resource usage for better performance.
  3. Tune application settings: Adjust Rails configurations like caching, database connection pooling, and session management to improve performance.
  4. Manage resources: Ensure efficient use of CPU, memory, and optimize background jobs in tools like Sidekiq for smoother operations.
  5. Monitor regularly: Continuously monitor Rails applications to detect and resolve performance issues early.
What metrics are needed for Rails Performance Monitoring?

Essential metrics for Rails performance monitoring include:

  1. Response times: Measures how quickly your Rails application responds to user requests.
  2. ActiveRecord query performance: Tracks the efficiency of database queries executed through Rails’ ActiveRecord ORM.
  3. Memory usage: Monitors memory allocation and usage in your Rails application.
  4. Queue performance: Observes the processing speed and efficiency of background jobs using tools like Sidekiq or Redis.
  5. Middleware performance: Measures how efficiently middleware components handle requests.
Can I set up alerts for performance issues in my Rails application?

Yes, Atatus allows you to set up custom alerts for performance issues in your Rails application. You can configure alerts based on specific metrics like response times, error rates, and memory usage, ensuring immediate notifications when performance degrades.

What are the benefits of Rails APM?

The benefits of Rails application performance monitoring (APM) include:

  1. Real-time insights: Receive immediate feedback on Rails application performance.
  2. Quick issue resolution: Identify and resolve performance issues faster.
  3. Resource management: Optimize CPU, memory, and background jobs in your Rails applications.
  4. Improved user experience: Ensure smooth and responsive operation of your Rails applications.
Does Atatus support distributed tracing for Rails applications?

Yes, Atatus supports distributed tracing for Rails applications, allowing you to trace requests as they move through different services and components. This helps you understand the end-to-end performance of your application and identify issues in microservices or complex architectures.