Top 9 DevOps Monitoring Tools in 2024
DevOps has evolved in terms of its tools, techniques, and culture. Software developers can gain a completely new perspective when operations and development work together.
The tech sector now depends heavily on DevOps. It is essential in enterprises, from software delivery to project planning. Businesses in DevOps employ a variety of monitoring tools for a range of activities, including development, testing, and automation.
According to a recent poll on DevOps trends, 50% of respondents indicated their organizations had a dedicated DevOps team, and 99% of respondents claimed DevOps had a positive impact on their firm.
This article will discuss the significance of DevOps monitoring, its types, and the tools you can use to be productive.
We will cover the following:
What is DevOps Monitoring?
DevOps monitoring describes the continuous, automated process of locating, following, evaluating, and reporting on particular pipeline parts. The pipeline consists of continuing operations, continuous planning, development, integration, testing, and deployment.
Engineers also refer to DevOps monitoring as continuous monitoring (CM) and continuous control monitoring (CCM).
Monitoring DevOps improves development productivity by enabling teams to see possible problems before releasing code to production. DevOps engineers can do this by planning, designing, developing, testing, deploying, and reviewing a predetermined amount of work.
Teams can respond instantly and automatically to any changes in the client experience due to DevOps monitoring. Additionally, it enables developers to go back to previous phases of the development process, reducing the number of unsuccessful product alterations.
DevOps monitoring allows you to:
- Define, monitor, and evaluate the real key performance indicators for DevOps in all its aspects.
- Find system behavior patterns that a DevOps engineer should be on the lookout for going forward.
- Find ways to automate the DevOps process so that engineers can use their DevOps toolkits more effectively.
- Improve communication between engineers, users (internal and external), and the rest of the organization by developing a continuous feedback loop.
- To detect when different parts of your DevOps stack fail in performance, security, cost, or other areas, increase the observability of those parts.
- Investigate logs and stats to find the root causes as soon as you can. Locating the source of an issue can be done with the aid of log and metric tracking. Your mean time to detect (MTTD), mean time to isolate (MTTI), mean time to repair (MTTR), and mean time to recovery (MTTR) can all get better as a result.
- Several tools can be used to instantly or automatically respond to threats.
- To prevent problems from affecting the user experience, rapidly identify abnormalities and report them to the appropriate teams.
Types of Monitoring Tools in DevOps
The majority of DevOps monitoring tools fall into one of the following categories.
- Server Monitoring
Server monitoring, also known as resource monitoring or infrastructure monitoring, compiles information on your server's performance. It offers data about remaining disk space, CPU loads, and RAM usage. It is useful for collecting data from virtual server systems for cloud-based settings. - Network Monitoring
It looks at the information that enters and leaves your computer network. Using this monitoring tool, you can monitor incoming requests and outgoing responses across all components, including switches, firewalls, and servers. - Application Performance Monitoring
It measures the general effectiveness of a service. These tools independently query the server and monitor response time and completion stats. For services to operate as intended, it is crucial to make sure that application performance issues are quickly identified and diagnosed.
9 Best DevOps Monitoring Tools
#1 Atatus
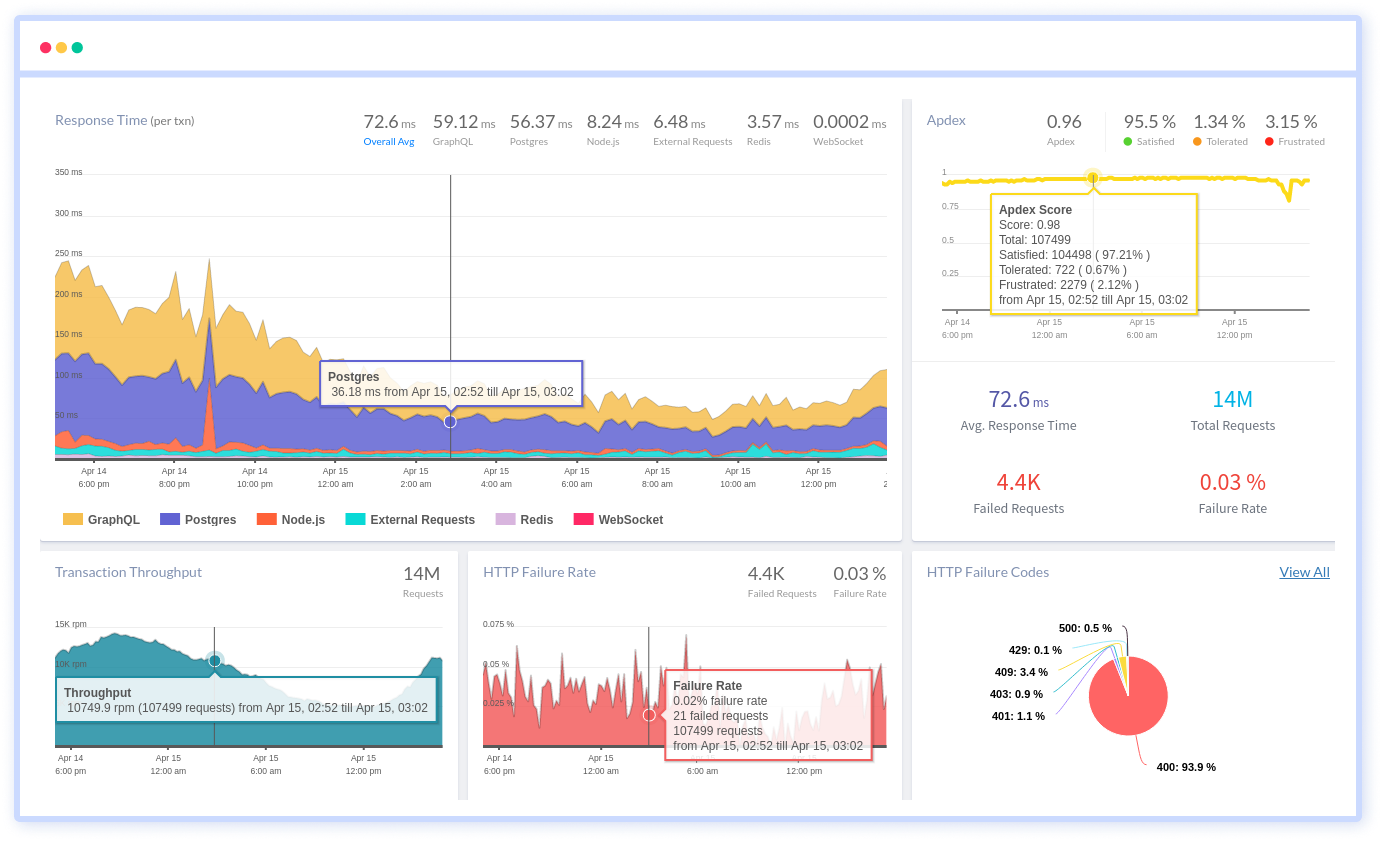
Atatus is a full-stack observability platform that provides continuous monitoring which supports infrastructure, network, and application monitoring. The fact that this solution gives DevOps teams access to a single platform that combines four different forms of telemetry data—including events, logs, metrics, and traces—is one of its biggest benefits.
DevOps teams can collect data from applications, end-user sessions, database transactions, infrastructure components, and other sources to retain complete visibility into the technical attack and react quickly to performance issues. This aids in preventing any circumstance that might have a detrimental effect on the client experience.
Session monitoring, server visibility, complete tracing, external requests monitoring, process monitoring, core web vitals monitoring, transaction monitoring, cloud-native infrastructure, real user monitoring, and synthetic monitoring capabilities are some of this tool's important characteristics.
Features:
- Analyze transactions in detail to see where your application is spending the most time
- Examine the group of network calls that have an impact on the throughput and response time of your individual request
- Find actionable information quickly to fix performance issues and errors
- Find and fix slow database queries in your complicated architecture schema with ease
- Find hidden API errors that were occurring in your application in minutes
- Find high-priority production incidents right away on your preferred notification system
- See the code breakdown to stay ahead of issues that are hard to uncover
- Start keeping track of releases, release with assurance, and observe the effects of each production deployment on your end users
- View logs, infrastructure metrics, and virtual machine metrics about the initial request
#2 Sensu
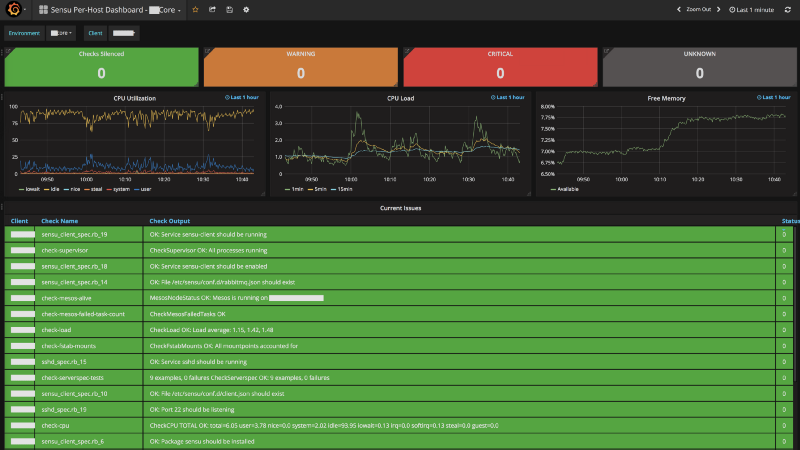
Sensu is one of the best DevOps monitoring tools, and it is used to monitor both applications and infrastructure. You can use this platform to measure and monitor the functionality of your applications, infrastructure, and business KPIs.
Sensu mixes static, dynamic, and temporary infrastructure to address complex challenges in platforms for modern infrastructure. Sensu does not offer software as a service (SaaS), but you are allowed to monitor your system however you see fit.
Health checks, incident management, self-healing, alerting, and OSS observability across various environments are all provided by Sensu's monitoring as a code solution. Workflows for monitoring can be codified in declarative configuration files and distributed to your engineers.
You can examine, edit, and version them if you consider them similar to code. Sensu Go interfaces with various DevOps monitoring tools like Splunk, PageDuty, ServiceNow, and Elasticsearch in addition to being scalable.
Features:
- Despite being open-source software, it offers excellent commercial support
- Enables the deployment of dynamic client registration and deregistration
- Enables the sending of alerts and notifications
- Even with mission-critical applications and multi-tiered networks, Sensu performs admirably
- It is excellently suited for needs involving automation
- Sensu measures business KPIs and keeps track of the health of servers, services, and applications
#3 PagerDuty
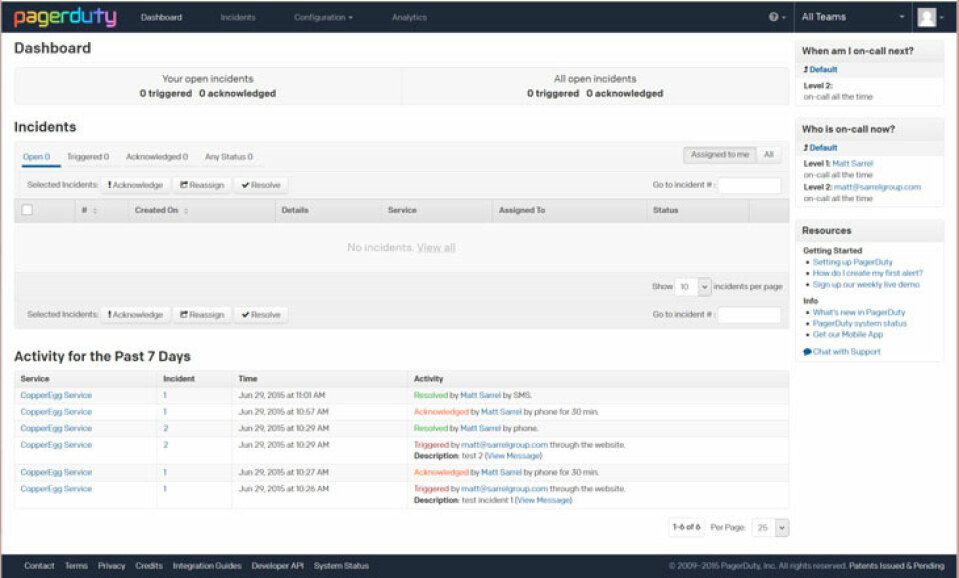
PagerDuty is a platform for executing functions that work closely with operations specialists. The tool enables the development team to keep an eye on the performance and dependability of the application and to handle errors as soon as they arise.
Alarms that are timely transmitted from the development to the production environments can be noticed, prioritized, and handled by the operations team more quickly. An excellent and user-friendly incident response and alerting system are PagerDuty.
It is a platform designed specifically to enhance the performance and dependability of the operations teams' capabilities, such as alert monitoring, on-call scheduling, escalation policies, and incident monitoring to address issues with their applications.
Features:
- Ease of operation
- Has a provision to auto-escalate
- Intuitive alerting API
- Powerful GUI tool for escalation policy and scheduling
- Simple and user-friendly
#4 Librato
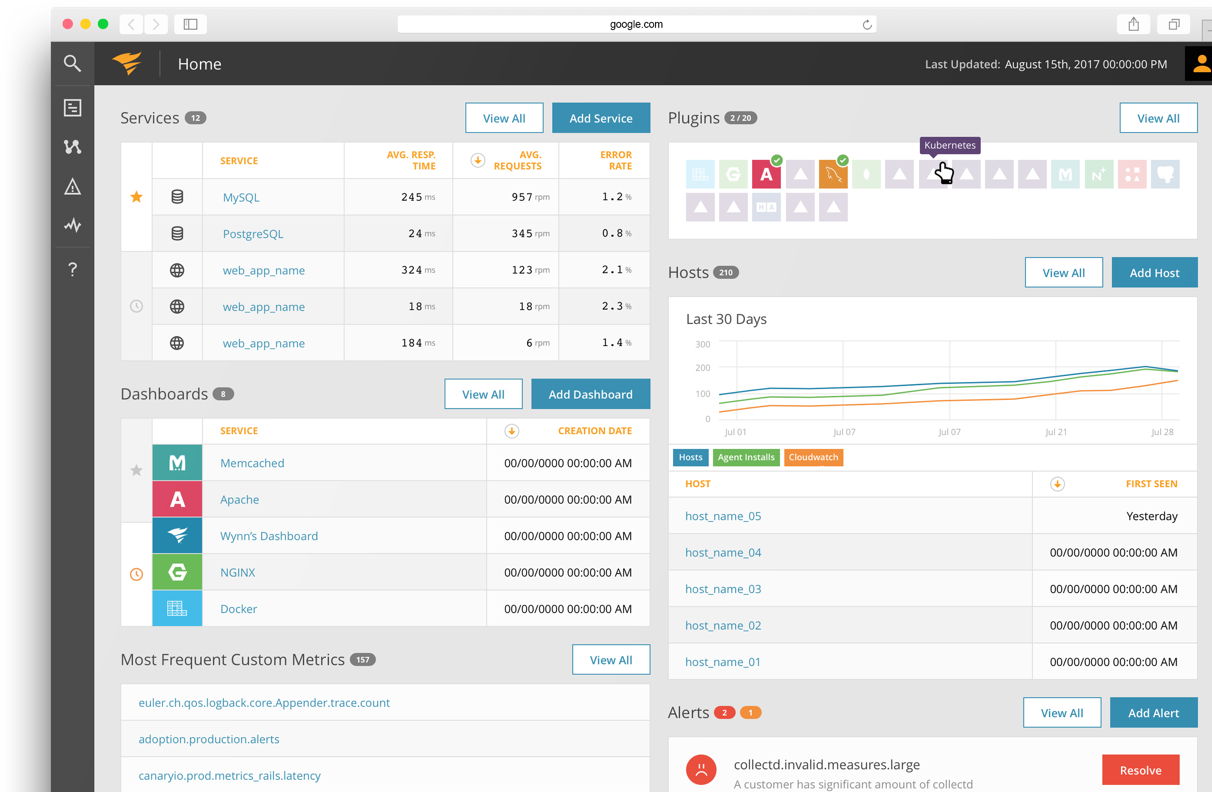
A real-time cloud monitoring tool called Librato can be used to track and understand the metrics that have an impact on enterprises at all stack levels. To observe, analyze, and receive alerts on the aforementioned variables, Librato offers all the functionality one would anticipate from a monitoring solution.
The tool accepts metrics from nearly any source for real-time data collection and modification. The Zapier platform, which offers webhooks for interacting with more than 400 applications and services, is entirely dependable for Librato users.
A trigger and an action are components of every recipe or zap. You can build a personalized delivery pipeline with Librato and Zapier that can carry out any of the supported actions.
Features:
- An integrated approach to data monitoring and analysis
- No installation at all
- Provides wonderful visualizations of the underlying data
- Send notifications when all of the activity's various metrics have been processed
- Simple user interface
#5 Prometheus
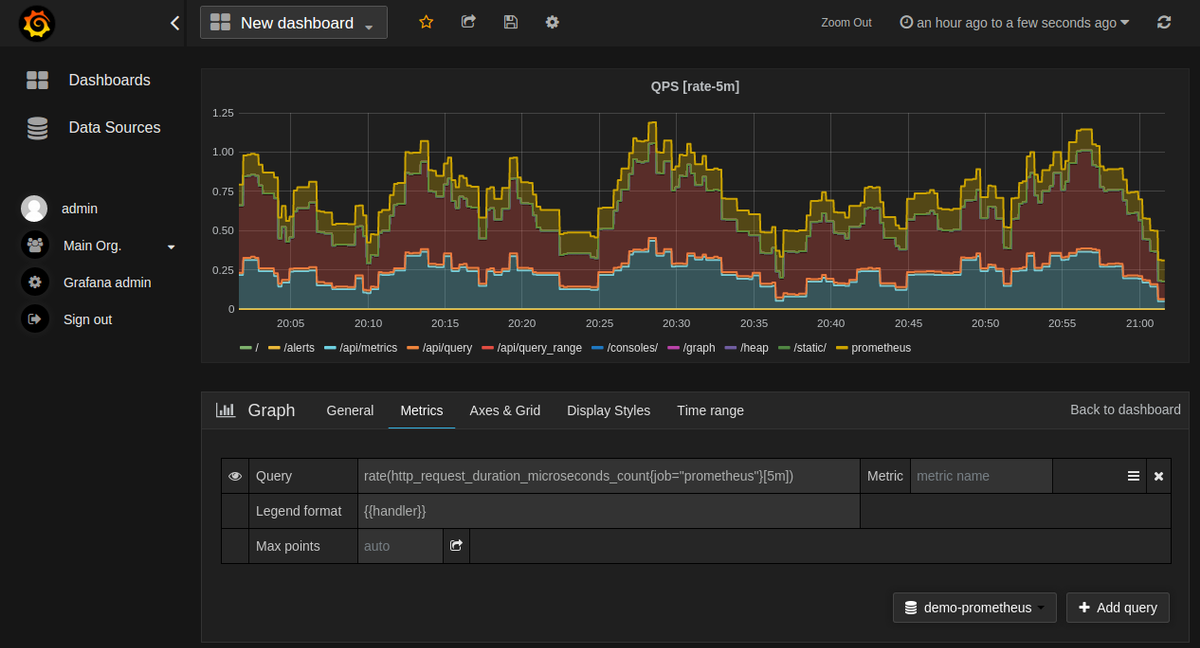
Prometheus is another metrics-based time series database that is primarily made for white-box monitoring. It is a system monitoring and alerting open-source solution with a vibrant ecosystem.
Since its creation, numerous organizations and businesses have integrated the tool into their ecosystems, allowing both the user and developer communities to remain vibrant.
It is currently a stand-alone open-source project that is independently maintained and does not rely on any specific Organization. In 2016, joining the Cloud Native Computing Foundation comes in second place to Kubernetes.
Prometheus can be downloaded as well. It has various monitoring capabilities that are beneficial in a DevOps environment, including alerting, storing time series in local memory or storage, and graphically displaying data (with Grafana). Numerous integrations, libraries, and measurement types are also supported.
Features:
- Addresses monitoring micro-services
- Collect time-series data
- Deploy applications with any of the configuration management tools
- Gives plenty of Web APIs for customized development
- No dependencies altogether
- Provide fairly simple pre-made docker images
- Seamless integration
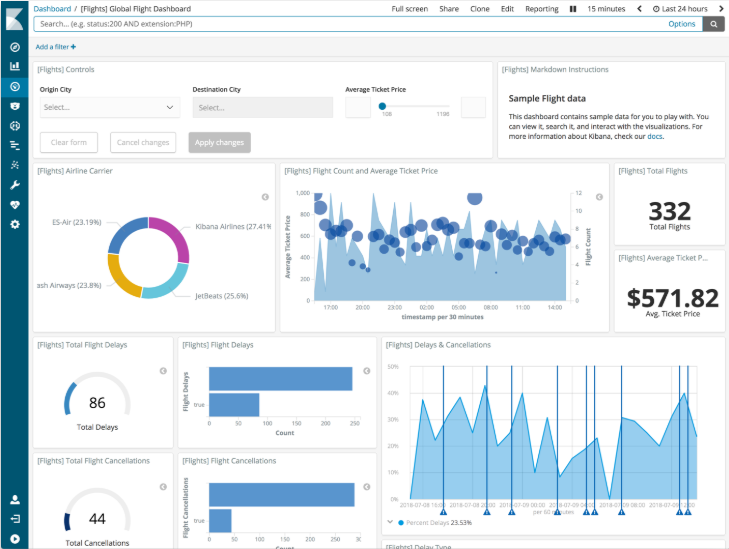
#6 Kibana
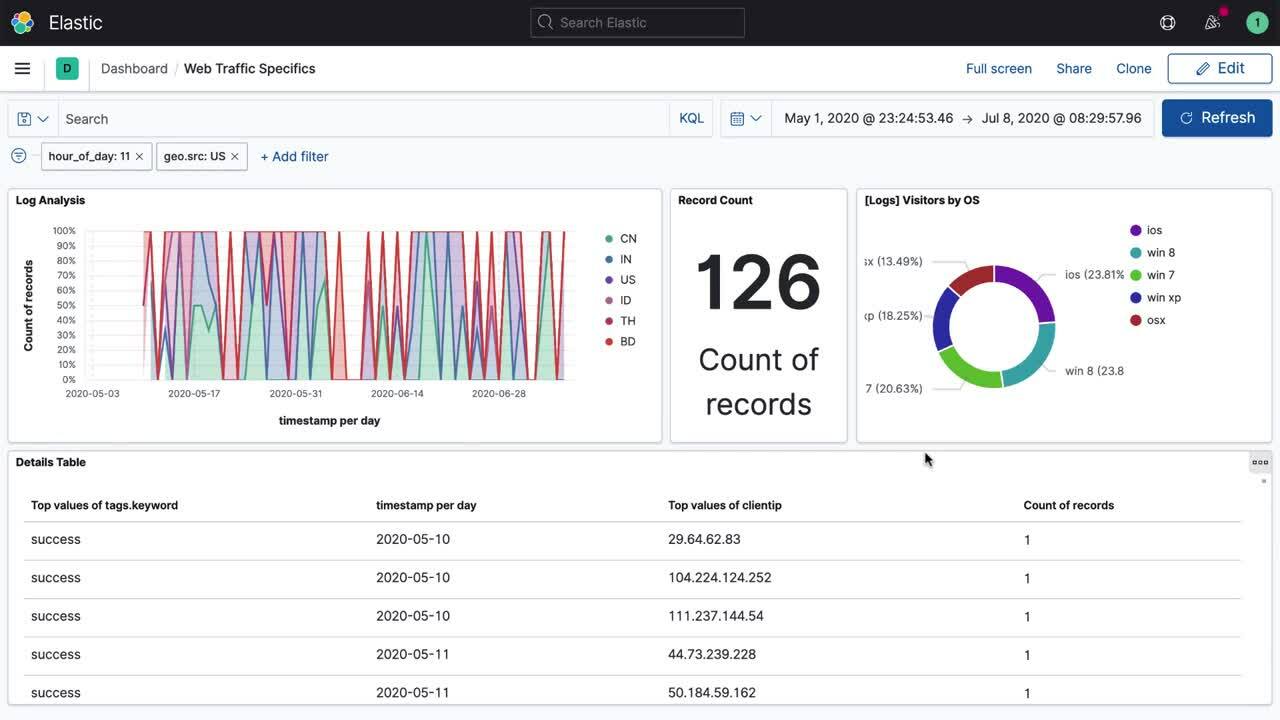
Kibana is an open-source analytics and visualization tool that was created expressly to integrate with Elasticsearch. Kibana's main use is for searching, viewing, and interacting with internal Elasticsearch indexes of data.
Charts, tables, and maps make it simple to perform advanced data analysis as well as visualize your data. To put it very precisely, it can be described as a tool that can comprehend increasing amounts of data.
You can quickly construct or share dynamic dashboards that can show changes to Elasticsearch queries in real time using its simple, browser-based interface.
Kibana installation takes only a few minutes and installing and exploring your Elasticsearch indices can be done without writing any code or requiring any additional infrastructure. It enables you to visualize your data and spot any tendencies that can occasionally cause you to wake up early.
Features:
- Easy setup process
- Enables you to visualize log files
- Enabling you to determine quickly the errors
- Provides one of the best documentation guides
- Provides the ability to automatically highlight the search fields
- The data from the logs can be visualized pretty easily
#7 Splunk
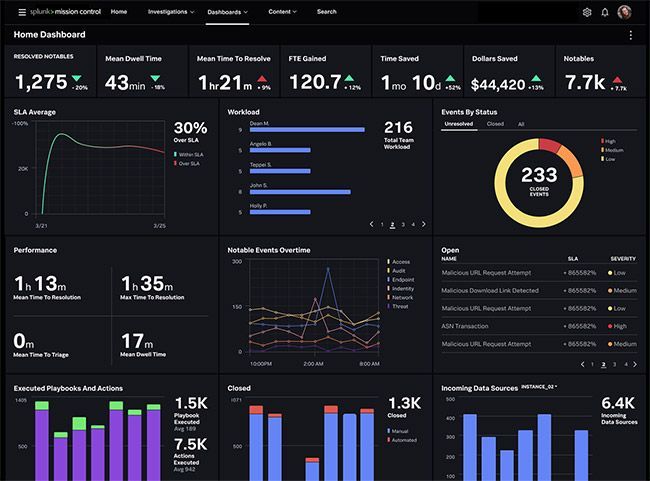
Splunk is a robust platform that aids in the analysis of machine data especially logs that get generated frequently but seldom used effectively. The Production data center and the others in the Marketing department are the greatest situations to understand the power of the tool.
The company Splunk creates software that is used for monitoring, searching, and analyzing machine-generated data using a web-style interface. It compiles all the pertinent data into a central index so that users may quickly search for the needed information.
Splunk can give you a complete view of what's going on with your machine-generated data. We can also rely on Splunk to recognize historical trends, correlate data from many sources, and assist in various ways.
Splunk is the only tool that can effectively capture and analyze large amounts of unstructured, time-series textual machine data; no other solution can fulfill this need.
Features:
- Analyze data from multiple sources, such as networks, servers, and applications
- Anyone can deploy it in a production environment with ease
- Ease of use
- Provides fantastic analytic results
- Reports are accurate
- The pricing model is pretty reasonable
#8 Nagios
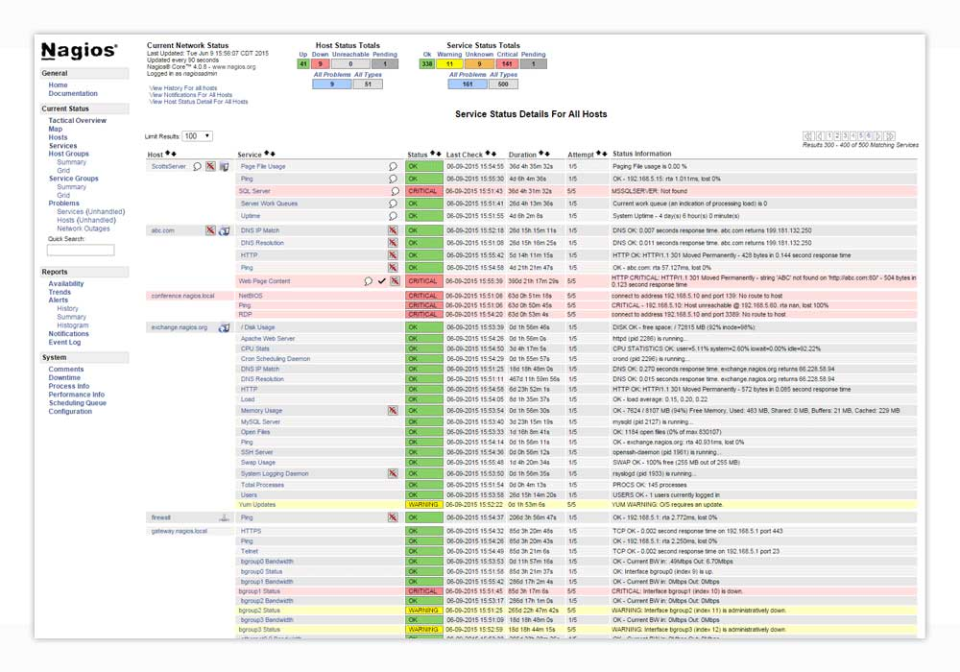
Nagios is a network monitoring tool and an open-source server that offers many features. Any network device with an IP address can be monitored by Nagios, which will send out an alert if anything out of the ordinary happens to the service being watched.
Nagios offers a 24/7 monitoring environment to keep an eye on your system resources like the CPU, Memory, Swap, and Load. It is capable of keeping an eye on a variety of services on a server.
Additionally, it gives you access to an intuitive web interface that displays the status of each service being monitored using Nagios. Nagios can check the status of each of these services and monitor them in several different ways.
Features:
- Both the client and server sides of the configuration are simple
- Custom plugins
- Flexible with its usage
- Has pretty good documentation
- Monitor the traditional pagers to deliver notifications
- Operate pretty well in environments like production
- Perform quick checks
- Provides a provision to set up services
- Receive downtime and maintenance notifications
#9 Elasticsearch
Another open-source application that was created entirely in Java is Elasticsearch. It is a scalable Lucene-based application that also functions as a standalone data analysis tool. With the rise of social media, data gathering is no longer a Herculean undertaking in the modern world.
These social media-generated data are known as "Big Data," which can be unorganized, dispersed, and unimportant when left to develop on its own. Elasticsearch is a fantastic solution designed to address the Big Data issues discussed above.
It is a very effective tool that is adaptable enough to handle the toughest problems, which are dispersed and real-time. Elasticsearch is a popular tool in today's world for handling queries with projects like Mozilla and GitHub as well as for content search and data analysis.
Features:
- Allows one to extend it the way they want and optimize it
- Log aggregation and search in the production environment
- Provides Full-text search, document custom scoring, suggestions and results highlighting, etc.
- There are plugins like Logstash and Kibana for logging as well as for displaying metrics
- Wonderful documentation
Conclusion
The performance and security of cloud-based apps, infrastructure, and services are visible to DevOps teams due to software solutions for continuous monitoring.
We've compiled a list of the most well-liked and widely applied continuous monitoring solutions we've come across, outlining each one's capabilities and salient characteristics.
We hope that this list will help you choose the best option for your forthcoming software development projects by broadening your understanding of the current landscape of continuous monitoring technologies available in the market.
Monitor Your Entire Application with Atatus
Atatus is a Full stack observability platform Platform that lets you review problems as if they happened in your application. Instead of guessing why errors happen or asking users for screenshots and log dumps, Atatus lets you replay the session to quickly understand what went wrong.
We offer Application Performance Monitoring, Real User Monitoring, Serverless Monitoring, Logs Monitoring, Synthetic Monitoring, Uptime Monitoring, and API Analytics. It works perfectly with any application, regardless of framework, and has plugins.

Atatus can be beneficial to your business, which provides a comprehensive view of your application, including how it works, where performance bottlenecks exist, which users are most impacted, and which errors break your code for your frontend, backend, and infrastructure.
If you are not yet an Atatus customer, you can sign up for a 14-day free trial.
#1 Solution for Logs, Traces & Metrics
![]() APM
APM
![]() Kubernetes
Kubernetes
![]() Logs
Logs
![]() Synthetics
Synthetics
![]() RUM
RUM
![]() Serverless
Serverless
![]() Security
Security
![]() More
More