Monitor JavaScript errors to track and fix before your users start noticing the errors. Atatus cuts through the noise and reports JavaScript errors that affect users of your application.
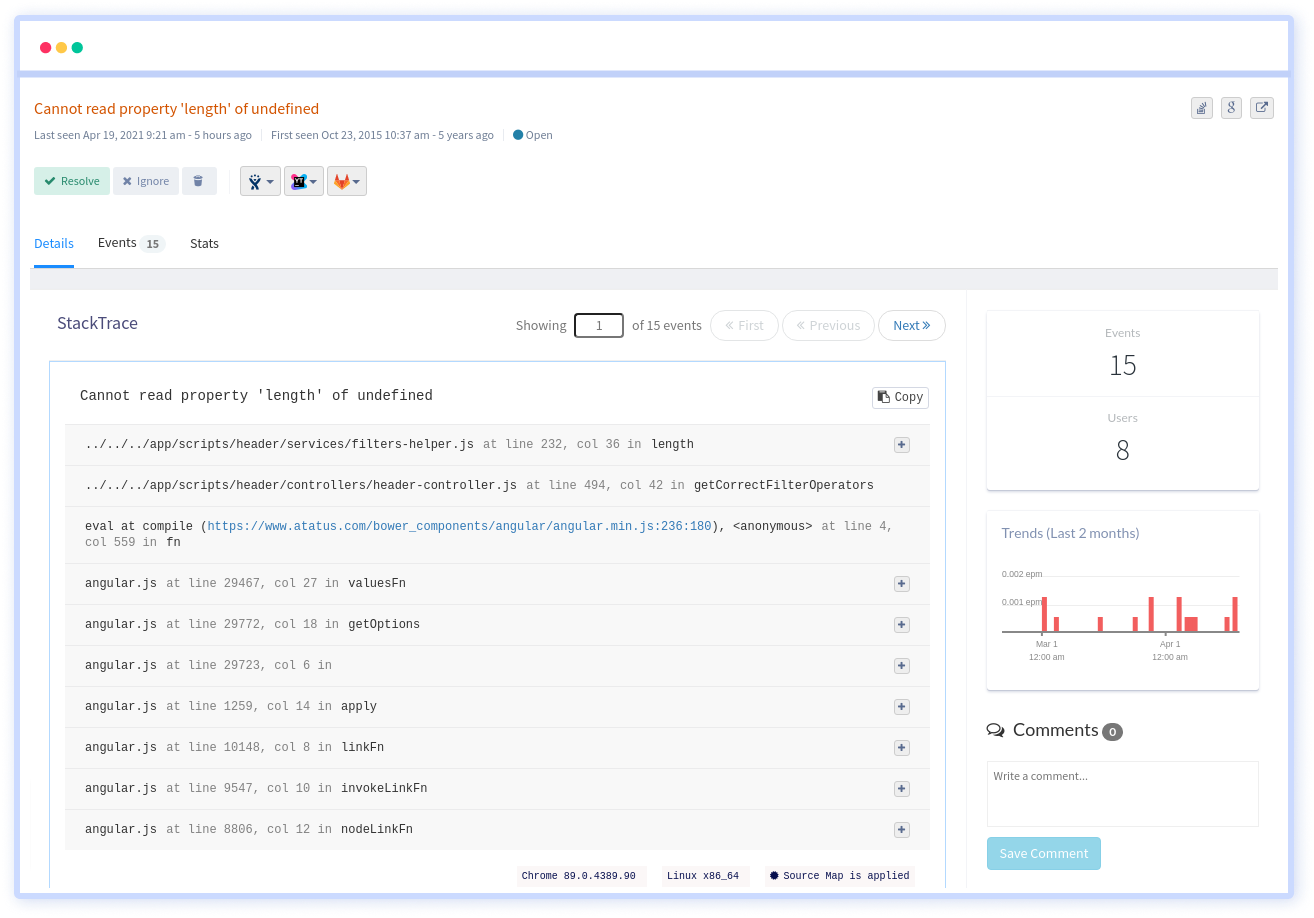
See the full stack trace that pinpoints the exact line of code that caused the error. Use source maps to unminify and get the original source location making it easier for you to resolve. Identify the release or commit that introduced this error and resolve it sooner.
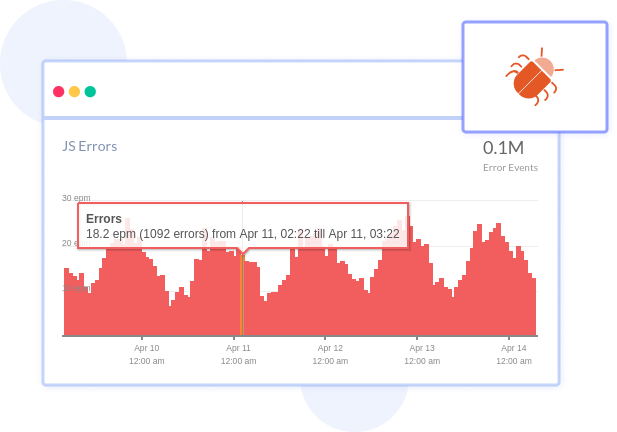
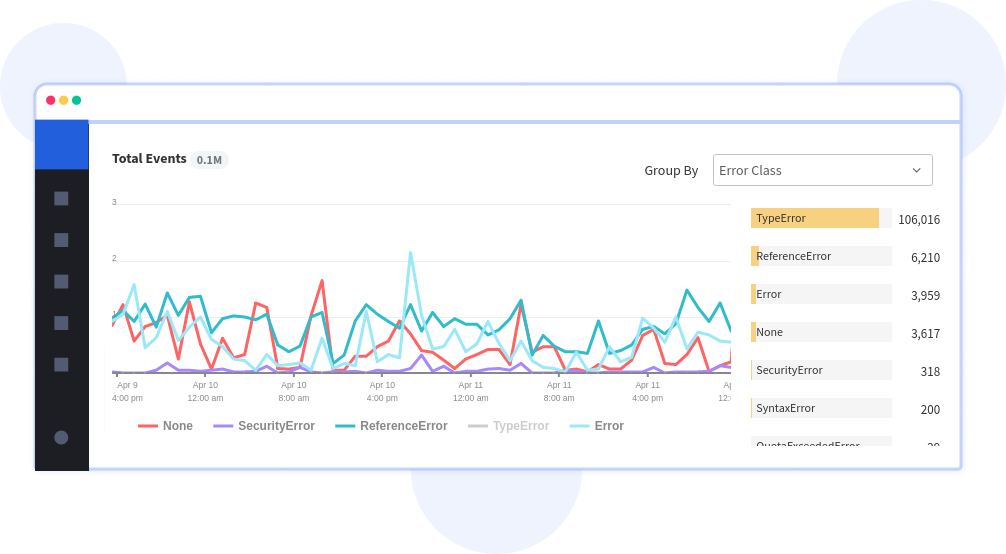
Similar JS errors that happen across different browsers are intelligently grouped into one. Reduces the noise and helps you focus on errors that matter. You can also train the algorithm by creating your own fingerprinting rules for grouping errors into different buckets.
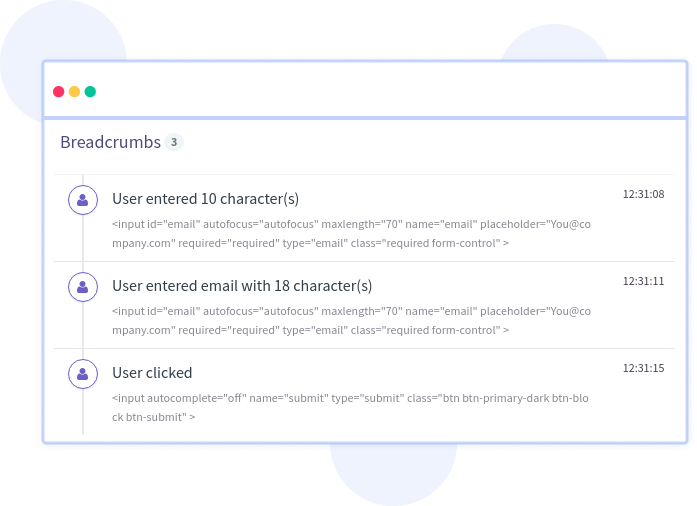
Telemetry provides a timeline of all the user actions that led to the JavaScript error. Recreate JS errors from the telemetry detailed info on network activity, user behaviour to root cause the JavaScript exception.
Get notifications on new issues, link and start tracking them in your own management tools with a two way synchronization. Some of the most popular integrations we offer are JIRA, Asana, GitLab, Slack, Teams, PagerDuty, VictorOps, WebHooks and more.
Adding two lines of code gets you started with tracking your frontend performance and errors. Start seeing immediately what are the pain points your users are facing.
Make readable stack traces in your errors by providing source maps. Un-minifying JavaScript lets you view source code in their original form, which helps in debugging minified code from production.
You can filter Bots, Domains, IPs, User Agents and many other configurations in making sure that you get actionable insights from the real data that affects your customers.
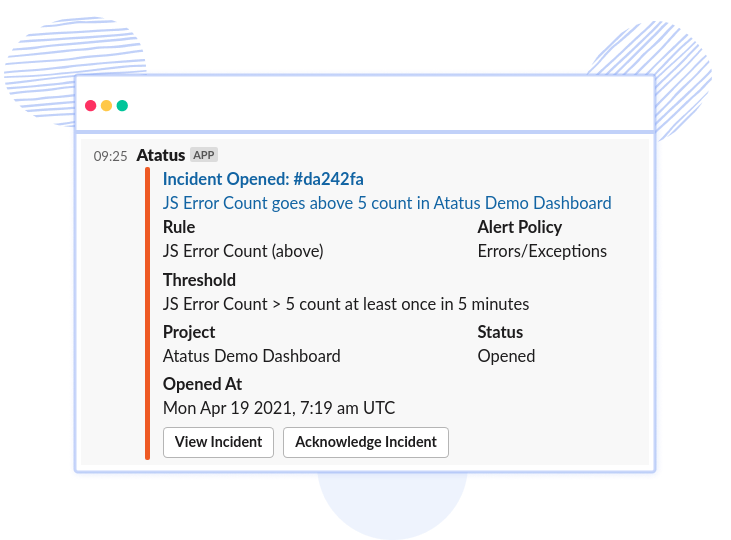
Setup alerts to automatically monitor your applications for increase in response time, API failures, or error rate and much more. Get notified through various channels, including Slack, Teams, Email, PagerDuty and more.
Invite your team members and work together to resolve issues. Add comments to the errors, so that your team members who view the errors, get to know what and how the fix was made.
Get your questions answered. Use custom queries to slice and dice the data by transaction, URL, error, user, browser, host OS and more.
Track all your websites in one place. Add your production, dev, staging, QA to monitor your websites through the complete software development cycle.
Don't miss out on your application performance and error stats. Atatus can send you weekly and monthly summaries directly to your inbox.
Maintain your workflow with Atatus issues in various Project Management integrations. We support Jira, Asana, BugHerd, GitHub, GitLab, and more.
You don't have to trust our word. Hear what our customers say!
Atatus is a great product with great support. Super easy to integrate, it automatically hooks into everything. The support team and dev team were also very helpful in fixing a bug and updating the docs.
Atatus is powerful, flexible, scalable, and has assisted countless times to identify issues in record time. With user identification, insight into XHR requests to name a few it is the monitoring tool we choose for our SPAs.
Atatus continues to deliver useful features based on customer feedback. Atatus support team has been responsive and gave visibility into their timeline of requested features.
Avail Atatus features for 14 days free-trial. No credit card required. Instant set-up.