Monitor your application for complete visibility into Java application performance and errors that are having impact on your end user experience. With Atatus Java Monitoring tool, get actionable insights to root cause issues, improve business metrics and performance of your application.
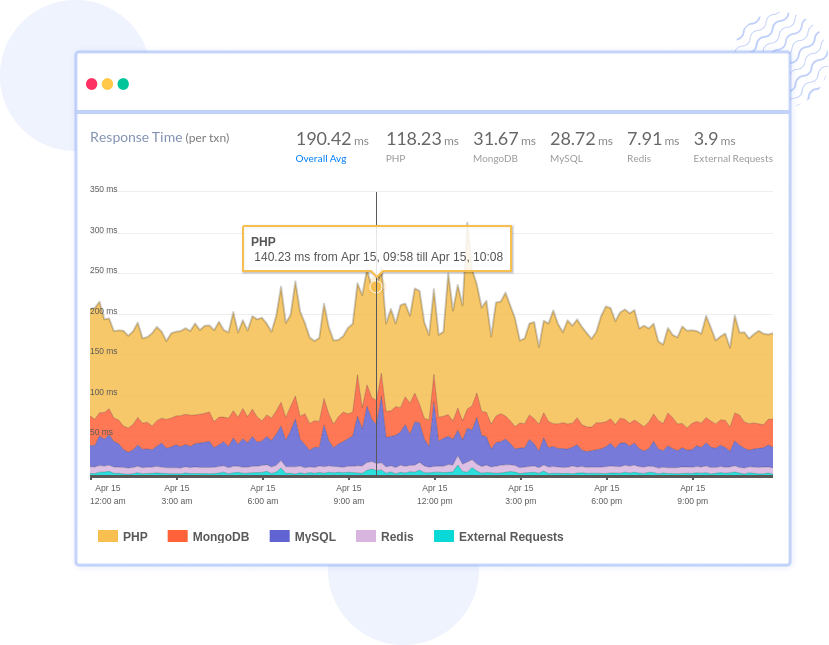
Try it freeRequest a DemoDrill down into the most time-consuming transactions, slowest database queries, poor performing network calls, exceptions that are impacting your users with complete stack trace and more. With the detailed report that Atatus offers you can optimize the performance of your Java application and improve your end-user experience instantly.
Gain insights on what is slowing down your application, with slowest transaction, percentiles and average pinpointing where you need to focus, slow performing SQL queries, undetected network fails, and more. Resolve errors and enhance customer satisfaction. Monitor your application to understand the huge impact it has on your business revenue and improve them.
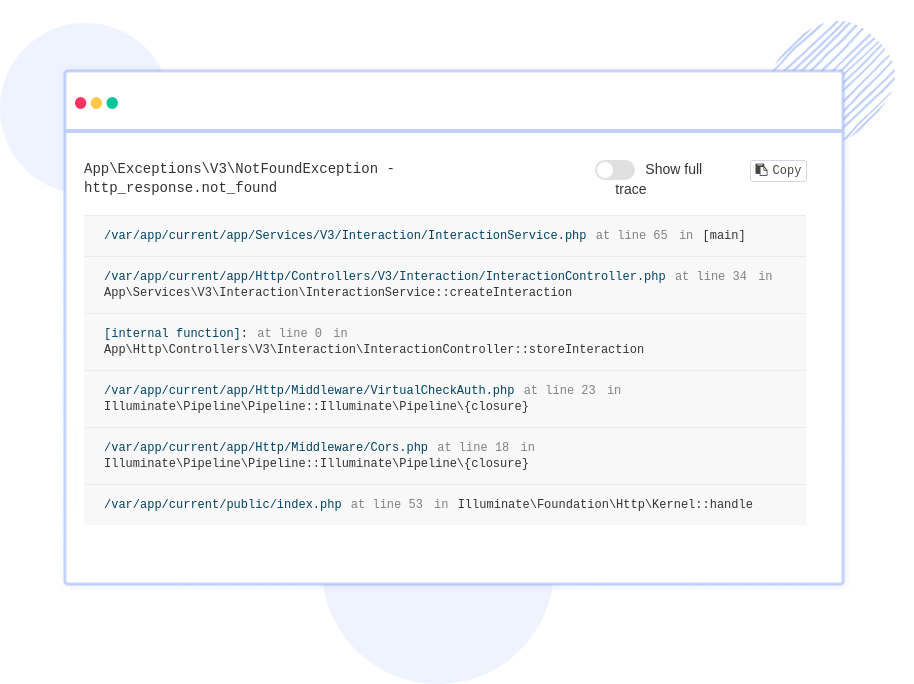
Get the full stack trace of each error down to the exact line of the code that caused it, along with all the data you need to debug including URL, request parameters, host, version, and more. See all errors impacting your customers in one place. Filter and write custom queries on the error data, discover new errors, reduce noise and focus on the most critical errors.
Minor glitches does not raise exceptions, thus add your own custom error message and log your own events. Link the logs along with APM slow traces, so understand what was happening while the application had an impact. With a live tail, watch all your logs at one place and pause to analyze the most crucial errors detected. View the log event for detailed insights including error info, host, service, tags and more about the event to fix them.
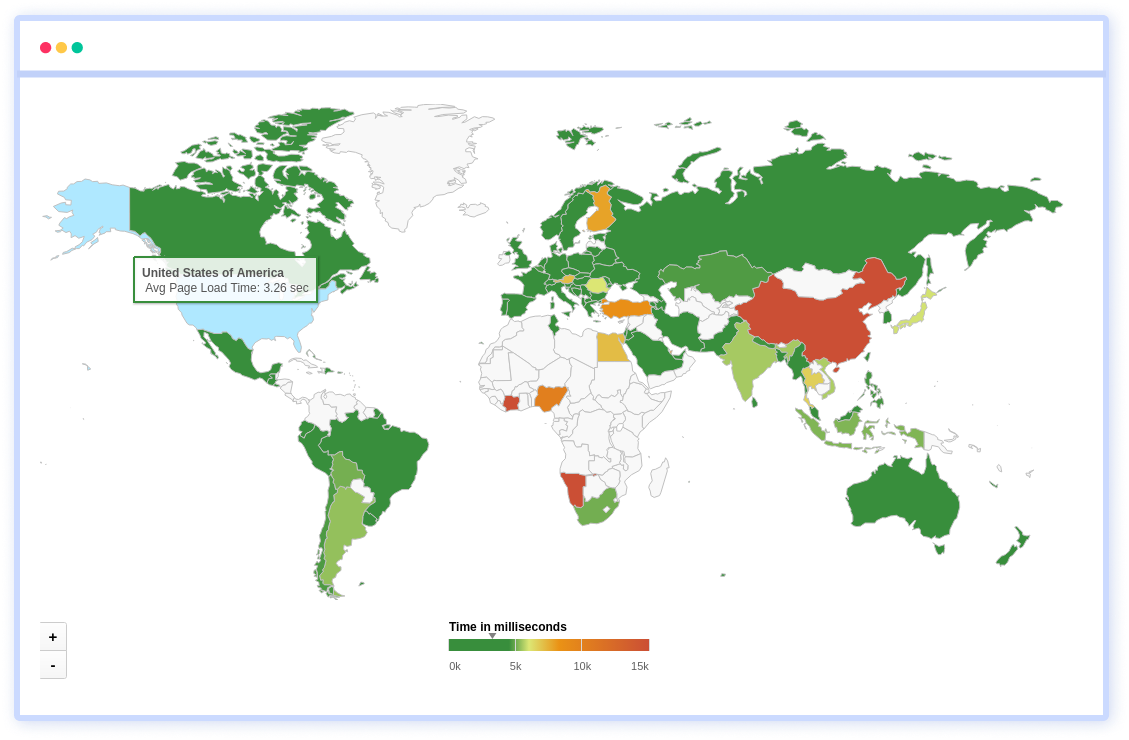
View how the frontend performance is in relation to the backend Java performance. Get user satisfaction score with Apdex value and optimize your frontend, improve user journeys, see key AJAX performance impacts, JS Errors that affect your users all under one roof. Start resolving frontend performance issues with Real User Monitoring.
Try it free. No credit card required. Instant set-up.
Essential tool to monitor your apps and websites
— Eduardo D, Founder & CEO, Ace Exhibits
See detailed overview of all the Java transactions with percentiles, apdex score, histogram. Focus on business critical transactions that have the most impact on your customers.
Track each session and analyze where your significant resources are spending its time. Analyze the sessions to understand which part of your code is slowing down.
With detailed capturing of all slow SQL queries, trace them back to the original source location from where the SQL query is used in your code. Get the context and diagnostic information you need to resolve issues faster.
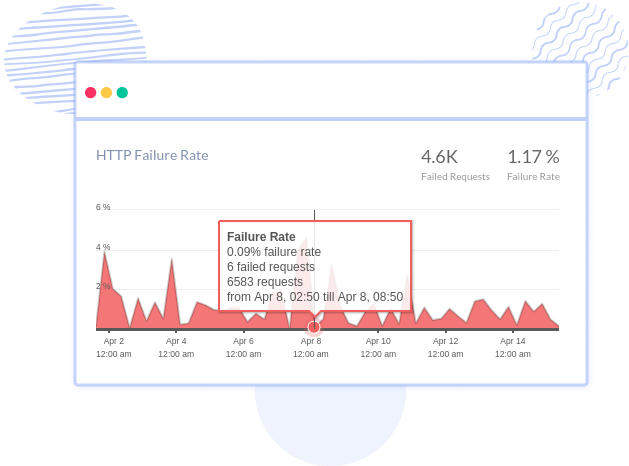
Capture all the Java errors & exceptions with full stack trace, find the transaction which fails the most and resolve them with request parameters, custom data and more.
Start seeing hidden API failures in minutes that were happening in your frontend and backend code. Along with the request parameters, user details, custom data resolve issues faster.
Starting seeing infrastructure metrics, VM metrics in context with the original request when you encounter a slow request. See if the issue is related to your host is have an effect on your application
With deployment tracking, keep a close watch on every new release and ship with confidence. See how each Java deployment impacts your users in real-time.
Get notified when your application performance or availability is affecting your end users. Immediately identify high priority incidents to be reported in your favorite notification systems.
Adding two lines of code gets you started with tracking your application performance and errors. Start seeing immediately what are the pain points your users are facing.