
PHP Monitoring
Atatus offers a powerful yet streamlined PHP monitoring solution with in-depth performance metrics to identify and resolve issues in your PHP application.
Try it freeRequest a DemoAtatus offers a powerful yet streamlined PHP monitoring solution with in-depth performance metrics to identify and resolve issues in your PHP application.
Try it freeRequest a Demo
Atatus provides unique and cutting-edge issue detection with high-level performance overview of every back-end services that you monitor. Spend less time searching through graphs and data sources.
Monitoring PHP performance metrics with Atatus makes it easier to troubleshoot PHP performance issues. Tracks the slowest transaction and provides detailed information about the entire transaction path. You can speed up your PHP application by debugging the API request consuming the most memory.
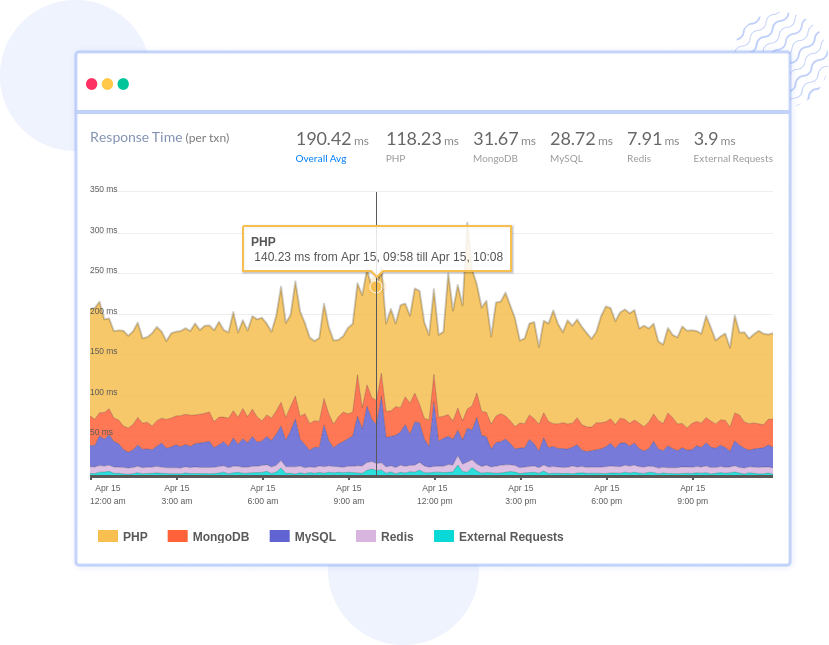
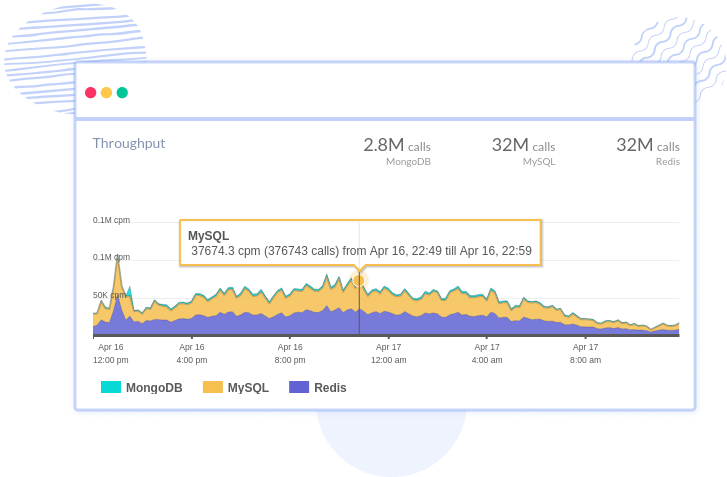
Analyze database calls and identify the slower-performing SQL queries to optimize them. Discover the database hotspots and view database response times, the slowest database queries, the most time-consuming queries, as well as the number of times the query has been invoked and failure rates.
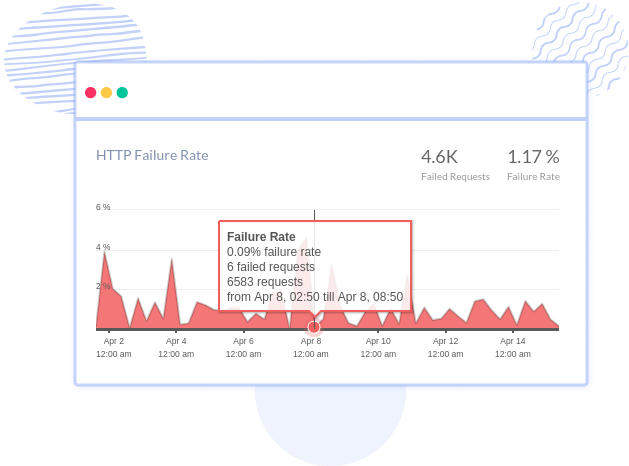
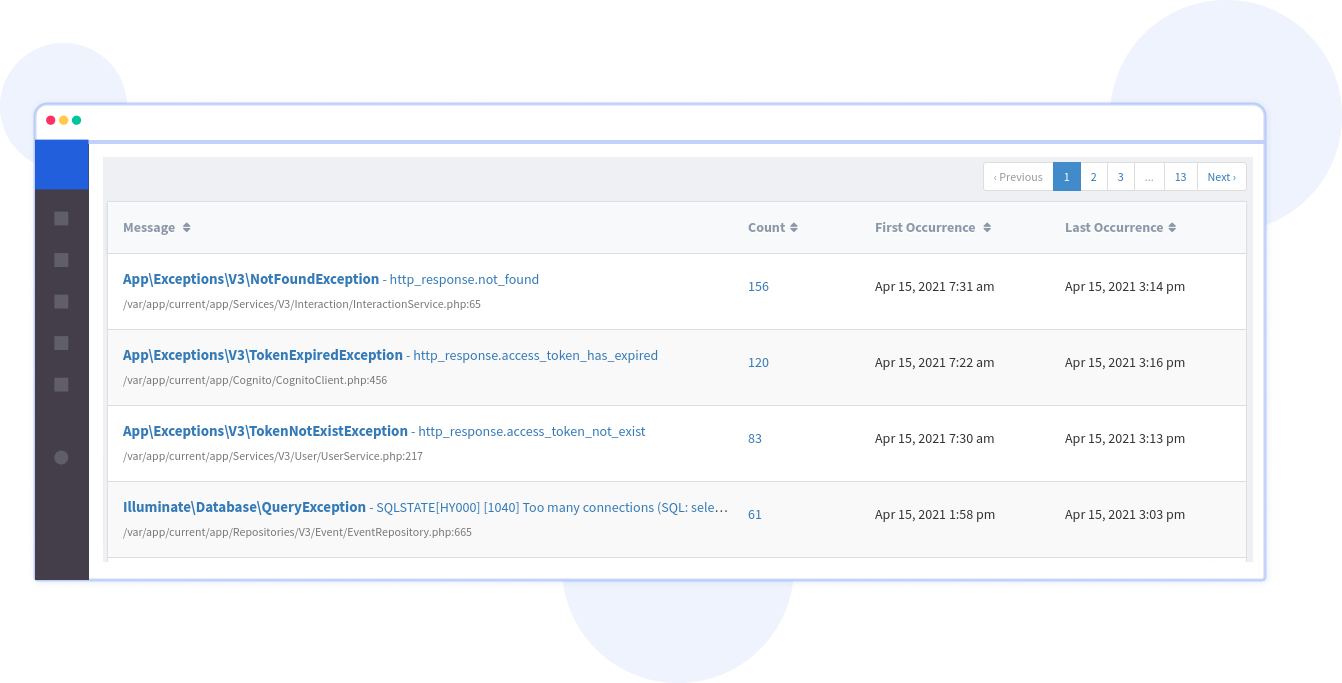
PHP exceptions are monitored by Atatus and provide you with an overview of the exception and the stack trace, and deduplication of the exception is also available. Monitor HTTP requests and discover how network calls affect the performance of your PHP application.
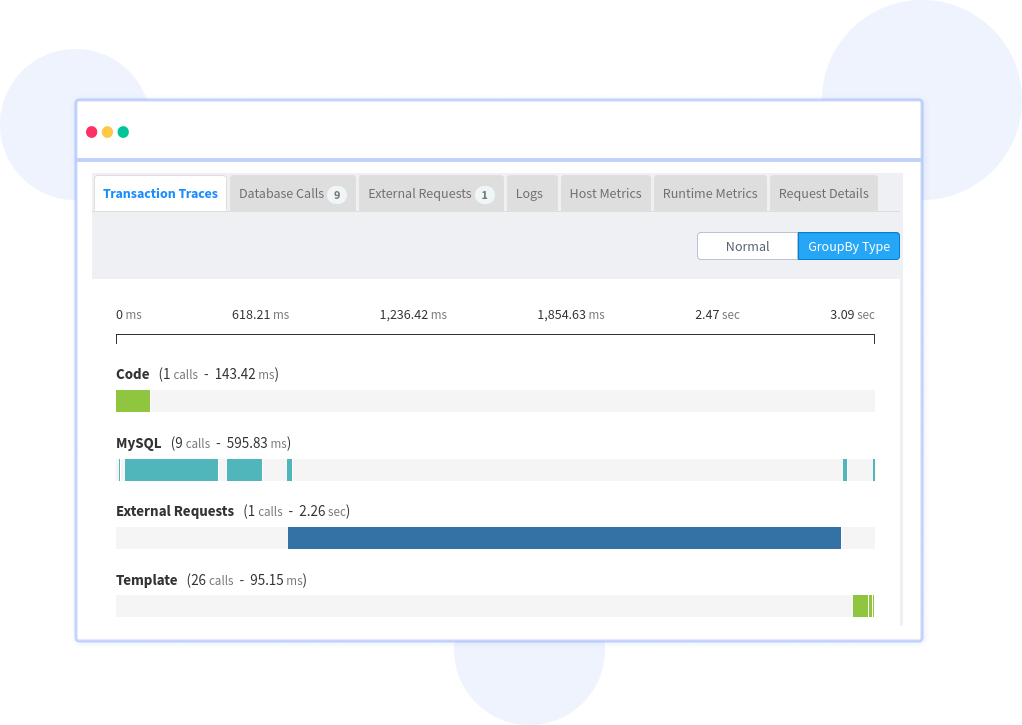
Detect all the methods with performance bottlenecks and get the comprehensive overview of each trace with PHP monitoring. The traces will be displayed in a cluster form and by clicking on a specific point in the cluster you can view the complete stack trace where you can view the db calls, transactions, logs, runtime metrics, host metrics and so on.
A few seconds delay in your application might cause a big impact in your revenue. Increase your sales by providing the best application to your end-users by detecting the PHP errors and performance related metrics with Atatus PHP monitoring and be the 1st in the market.
 Latency
Thorughput
Exception rate
HTTP failure rate
Network traffic
Session traces
DB Query time
Slowest queries
Apdex score
CPU and memory usage
Deployment changes
Most time consumed transactions
Try it free. No credit card required. Instant set-up.
Essential tool to monitor your apps and websites
— Eduardo D, Founder & CEO, Ace Exhibits
See detailed overview of all the PHP transactions with percentiles, apdex score, histogram. Focus on business critical transactions that have the most impact on your customers.
Track each session and analyze where your significant resources are spending its time. Analyze the sessions to understand which part of your code is slowing down.
With detailed capturing of all slow SQL queries, trace them back to the original source location from where the SQL query is used in your code. Get the context and diagnostic information you need to resolve issues faster.
Capture all the PHP errors & exceptions with full stack trace, find the transaction which fails the most and resolve them with request parameters, custom data and more.
Start seeing hidden API failures in minutes that were happening in your frontend and backend code. Along with the request parameters, user details, custom data resolve issues faster.
Starting seeing infrastructure metrics, VM metrics in context with the original request when you encounter a slow request. See if the issue is related to your host is have an effect on your application
With deployment tracking, keep a close watch on every new release and ship with confidence. See how each PHP deployment impacts your users in real-time.
Get notified when your application performance or availability is affecting your end users. Immediately identify high priority incidents to be reported in your favorite notification systems.
Adding two lines of code gets you started with tracking your application performance and errors. Start seeing immediately what are the pain points your users are facing.
 +1-760-465-2330


