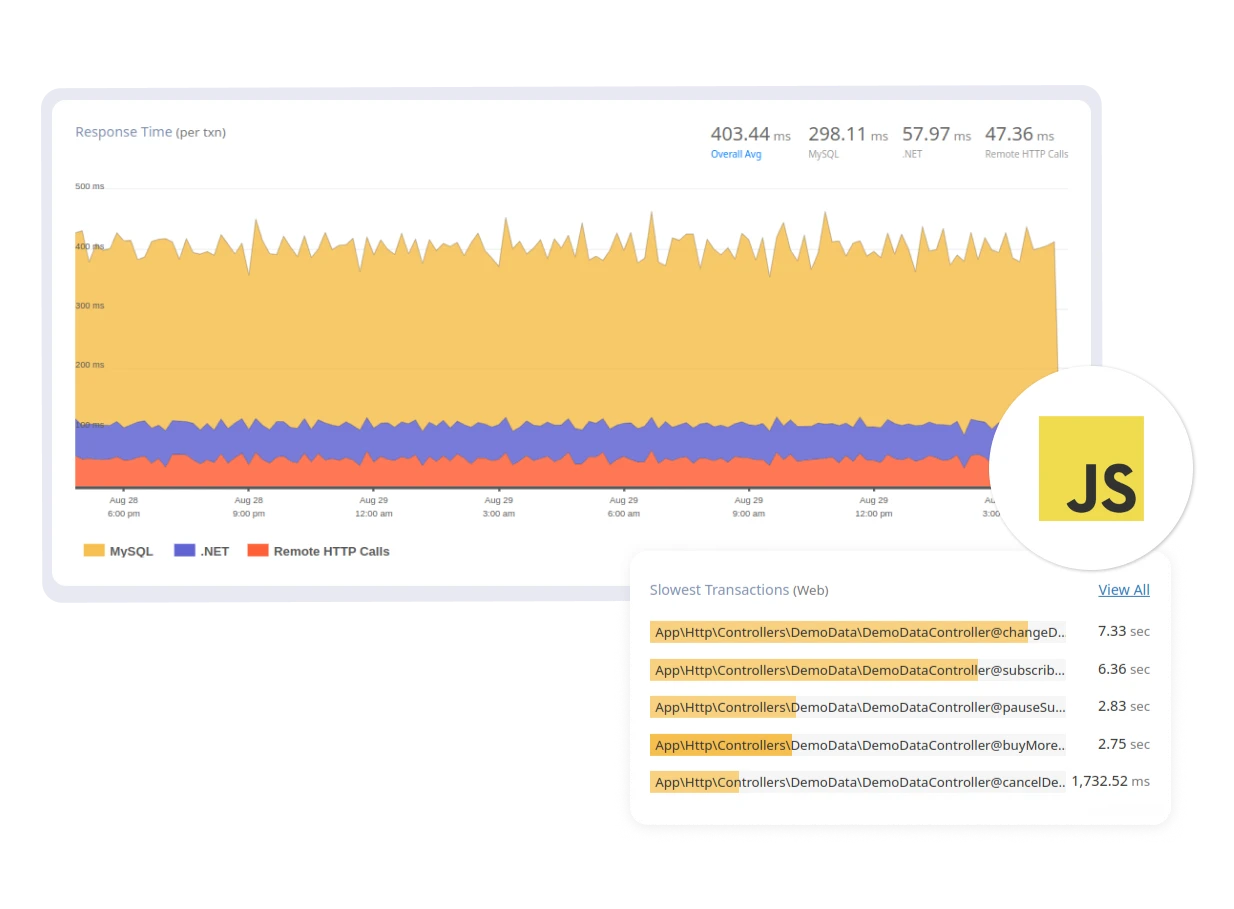
Setting up JavaScript monitoring agent is easy

Monitor, troubleshoot, and optimize JavaScript app performance with Atatus. No code changes required in your app. Start seeing hidden JavaScript errors in minutes.

Install Setup Code

Copy & paste this code into the <head> tag of your html (every page) to start using Atatus on your site. Please make sure that you add it before other script tags as well.

<script src="//dmc1acwvwny3.cloudfront.net/atatus.js"> </script>
<script type="text/javascript"> atatus.config('YOUR_API_KEY').install(); </script>
Replace the YOUR_API_KEY string with the API Key that is assigned for your project.

Send an event

Just reload your page now. That's it! You've sent your first event.


Questions and answers on JavaScript Monitoring


What is JavaScript monitoring?

JavaScript monitoring is a process used to track the usage and performance of JavaScript code on a website or application. This process can help identify issues with the code, such as errors or slow loading times, and can provide insights on how to improve the code for better performance.

JavaScript monitoring is a powerful tool for web developers. By tracking the activity of a web page or application, developers can improve the performance of the web page and fix errors.

How monitoring JavaScript code improve user experience?

Monitoring JavaScript code can help identify errors and potential problems. It can also provide information on how users interact with the website or application. This information can be used to improve the overall user experience.

There are a number of tools available that can help with monitoring JavaScript code. These tools can be used to track errors, monitor performance, and track user interactions.

How to detect front-end errors?

In any web development project, the front-end code is what interacts with the user. It's what they see and click on, so any errors in the front-end code can cause big problems. But how can you detect errors in the front-end code?

There are a few different ways to detect errors in front-end code:

  1. Keep an eye on the browser console. The console is where you'll see most of the front-end errors that are happening in your code.
  2. You can also use a testing tool like Selenium, which can automatically test front-end code for errors.
  3. Another way to detect front-end errors is to use a browser extension. There are a few different extensions that can help you with this, but one of the most popular is called "Errorception."
  4. Finally, you can set up your own front-end error monitoring tool like Atatus. This can be a bit more involved, but it's definitely worth it if you're serious about catching errors in your code.
How does Atatus makes it easy to improve JavaScript application?

Atatus makes it easy to improve the performance of your JavaScript applications by monitoring and tracing every aspect of your code. By understanding how your code is executed, Atatus can help you identify and fix bottlenecks in your code. In addition, Atatus provides a JavaScript Monitoring tool to collect and visualize front-end performance data. Atatus also provides valuable insights into your application's performance, so you can make informed decisions about how to improve it.

What are Apdex scores?

An Apdex score is a numerical value between 0 and 1 that is used to measure user satisfaction with the front-end monitoring tool. The score is calculated by taking the average of the response times for all actions performed by users within a specific time period, and then converting that average into a value between 0 and 1.

The Apdex score is a useful metric for measuring the overall performance of a software application and for identifying areas where improvements can be made.

How to collect JavaScript console logs with Atatus?

By default, console is set to disabled. Atatus will watch all the console activities and displays the information in the timeline. It also captures console.error() which automatically triggers an error.

To capture the console activities you will have to set the option to "true" to enable it.

What are core web vitals?

Web vitals are a set of metrics that measure the quality of a user's experience when they interact with a web page. They include measures of loading speed, interactivity, and visual stability. Google has identified these metrics as being important for the overall user experience, and has thus included them in their search ranking algorithm.

While all web vitals are important, there are three that are considered to be the most important:

  1. Largest Contentful Paint (LCP): Measures how long it takes for the main content of a page to load.
  2. First Input Delay (FID): Measures how long it takes for a page to become interactive.
  3. Cumulative Layout Shift (CLS): Measures how much visual stability a page has.

Improving your web vitals can help improve your overall search ranking, and thus drive more traffic to your website.

Does Atatus collects core web vitals metrics?

Yes, Atatus JavaScript Monitoring collects all the core web vitals metrics to help you keep track of your website's front-end performance.

These metrics are important because they help you track the loading, interactivity, and stability of your website. By monitoring these metrics, you can make sure your website is performing well for your users.

Start fixing issues impacting your users right now

Try it free. No credit card required. Instant set-up.

Awesome Support

Best APM Monitoring tool

"Atatus customer service is just amazing. I had before New Relic and Stackify and I can honestly say that Atatus compared to those two is the leader! Leader in pricing and user interface and ability to drill down to the problem."

— S Herman Kiefus, DevOps Admin, Compass

Ready to see actionable data?

Avail Atatus features for 14 days free-trial. No credit card required. Instant set-up.