Ruby application monitoring

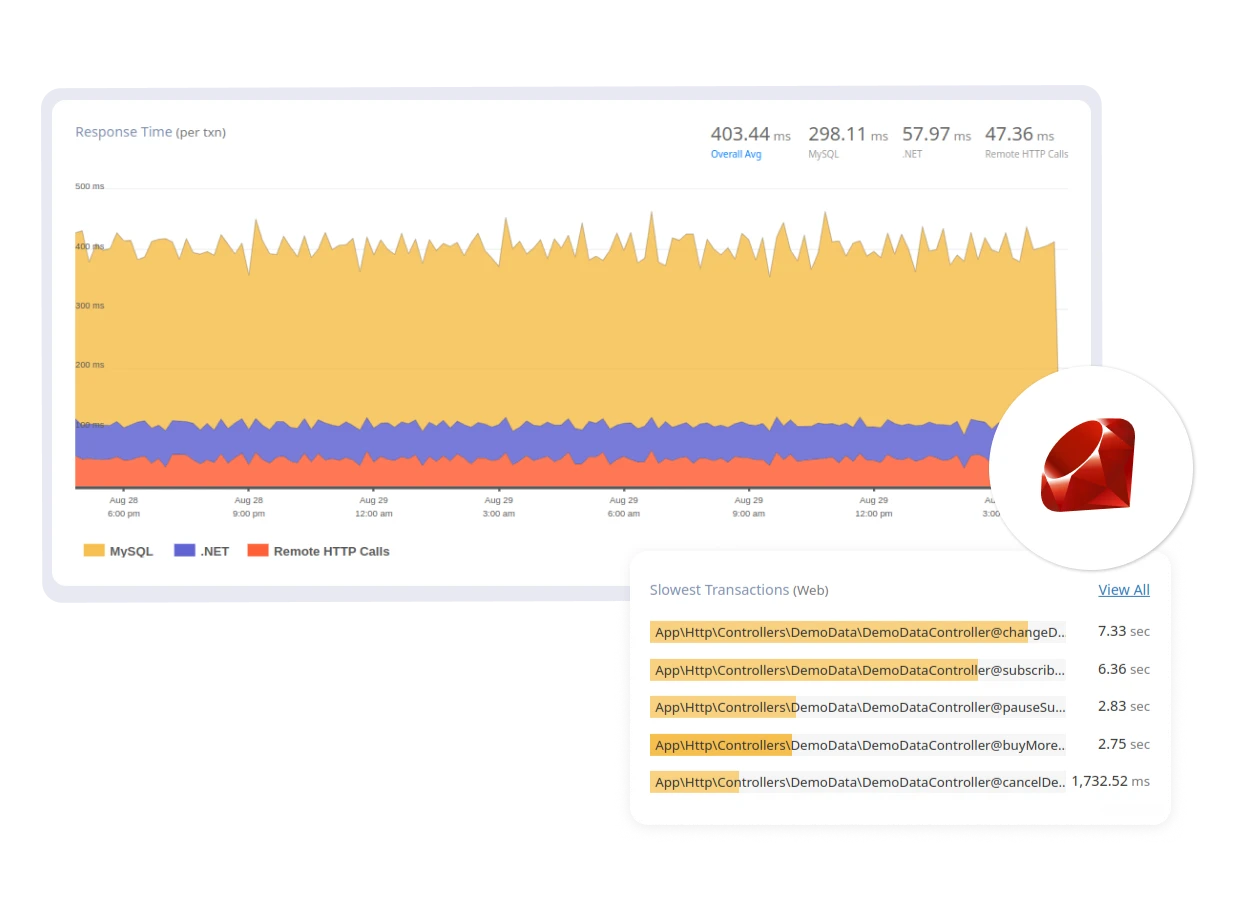
Monitor, troubleshoot, and optimize Ruby app performance with Atatus. Detect performance bottlenecks swiftly, and resolve issues with detailed insights. Fine-tune resource consumption to ensure your Ruby app operates efficiently under all conditions.

Free Sign Up. No Credit Card Required. Cancel Anytime.

Ruby Monitoring Made Simple.

Ruby application monitoring offers deep visibility into request cycles, memory usage, and background jobs, helping you proactively detect performance issues. Atatus allows you to correlate metrics and logs for quick troubleshooting, ensuring your Ruby applications stay performant even during peak traffic times.

See Everything with Clear App Insights

  • Monitor every layer of your Ruby application, from controllers to database queries, in real-time.
  • Track resource usage such as CPU, memory, and thread activity to get a complete picture of system health.
  • Visualize key metrics for individual processes, helping you spot performance issues quickly.
  • Gain real-time insights into external dependencies, such as third-party APIs and databases, to maintain seamless integrations and optimize workflows.
Ruby Insights

Spot and Fix Performance Issues Before They Escalate

  • Receive real-time alerts based on custom thresholds for resource consumption, slow queries, and error rates.
  • Automatically detect bottlenecks in Ruby performance using anomaly detection.
  • Correlate logs and metrics to quickly troubleshoot and resolve issues, minimizing downtime and improving response times.
  • Use distributed tracing to follow requests across your services, pinpointing latency and performance issues affecting the end-user experience.
Ruby Performance

Keep Apps Fast and Reliable, Even Under Pressure

  • Monitor Ruby app scalability by tracking performance during high traffic or heavy workloads.
  • Ensure smooth operation with insights into load balancing and autoscaling to prevent server overload.
  • Track critical metrics like request cycle time, garbage collection, and memory bloat to optimize resource utilization.
  • Detect and resolve background job delays and bottlenecks that could impact the performance of your Ruby application.
Ruby Metrics

Start fixing issues impacting your users right now

Try it free. No credit card required. Instant set-up.

Awesome Support

Best APM Monitoring tool

"Atatus customer service is just amazing. I had before New Relic and Stackify and I can honestly say that Atatus compared to those two is the leader! Leader in pricing and user interface and ability to drill down to the problem."

— S Herman Kiefus, DevOps Admin, Compass

We've Got Your Stack Covered!

Boost Framework Performance

Boost Framework Performance

Gain insights into your performance, enhancing transaction flow and speeding up error resolution.

Trace Every Request Instantly

Trace Every Request Instantly

Visualize end-to-end traces across your stack, ensuring that you catch every error, performance issue, or bottleneck before it affects users.

Identify Slow Queries Instantly

Identify Slow Queries Instantly

Pinpoint and resolve slow database queries and eliminate performance bottlenecks impacting your application's responsiveness, leading to faster response times

Stay Alert to Vulnerabilities

Stay Alert to Vulnerabilities

Get alerted to potential library vulnerabilities, preventing security risks before they affect your customers or compliance.

Simplify Logs, Troubleshoot Faster

Simplify Logs, Troubleshoot Faster

Centralize all your logs in one place, and quickly identify the root cause of issues using advanced filtering, pattern detection, and log pipelines.

Custom Metrics That Matter

Custom Metrics That Matter

Set up and track custom metrics that align with your app's KPIs to ensure you're monitoring exactly what matters most for your success.

Quick Request Analysis Anytime

Quick Request Analysis Anytime

Explore request-level analysis, including stdout APM logs, to understand execution times, bottlenecks, and areas that need optimization.

Align APM with Server Metrics

Align APM with Server Metrics

Correlate your app’s APM metrics with server health to get a complete picture of your application’s performance and infrastructure dependencies.

Actionable Alerts

Actionable Alerts

Receive real-time alerts for app performance degradations and critical issues. Take immediate action to prevent downtime and optimize user experiences.

FAQ on Ruby APM and Performance Monitoring

How do I improve Ruby performance?

To improve Ruby performance:

  1. Identify bottlenecks using Ruby APM tools to track request cycle times, memory leaks, or slow database queries.
  2. Optimize ActiveRecord queries and reduce N+1 queries to speed up data retrieval.
  3. Use caching mechanisms like Redis to speed up recurring operations.
  4. Continuously monitor Ruby applications to detect and resolve performance issues early.
What metrics should be monitored in Ruby performance monitoring?

Key metrics for monitoring Ruby performance include:

  1. Request cycle time: Measures the time taken to process requests, indicating performance bottlenecks.
  2. Memory usage: Tracks heap and overall memory consumption in your Ruby application.
  3. Garbage collection: Monitors the frequency and duration of garbage collection processes.
  4. Database query times: Tracks the speed of database queries to ensure optimal performance.
  5. Error rates: Detects how frequently errors occur in your application.
Can I set up alerts for performance issues in my Ruby application?

Yes, Atatus allows you to configure custom alerts for performance issues in your Ruby application. Set up alerts based on key metrics like request cycle time, memory usage, error rates, and database query times, so you're notified when performance degrades.

What are the benefits of Ruby APM?

The benefits of Ruby application performance monitoring (APM) include:

  1. Real-time insights: Immediate visibility into the health of your application.
  2. Quick issue resolution: Identify and resolve issues faster.
  3. Resource management: Track CPU and memory usage to avoid resource exhaustion.
  4. Improved user experience: Ensure your Ruby app runs smoothly, even under high loads.
Does Atatus support distributed tracing for Ruby applications?

Yes, Atatus supports distributed tracing for Ruby applications, allowing you to trace requests across microservices and external dependencies. This gives you a complete view of how requests flow through your system, making it easier to identify and resolve performance issues.