Vue.js Application monitoring
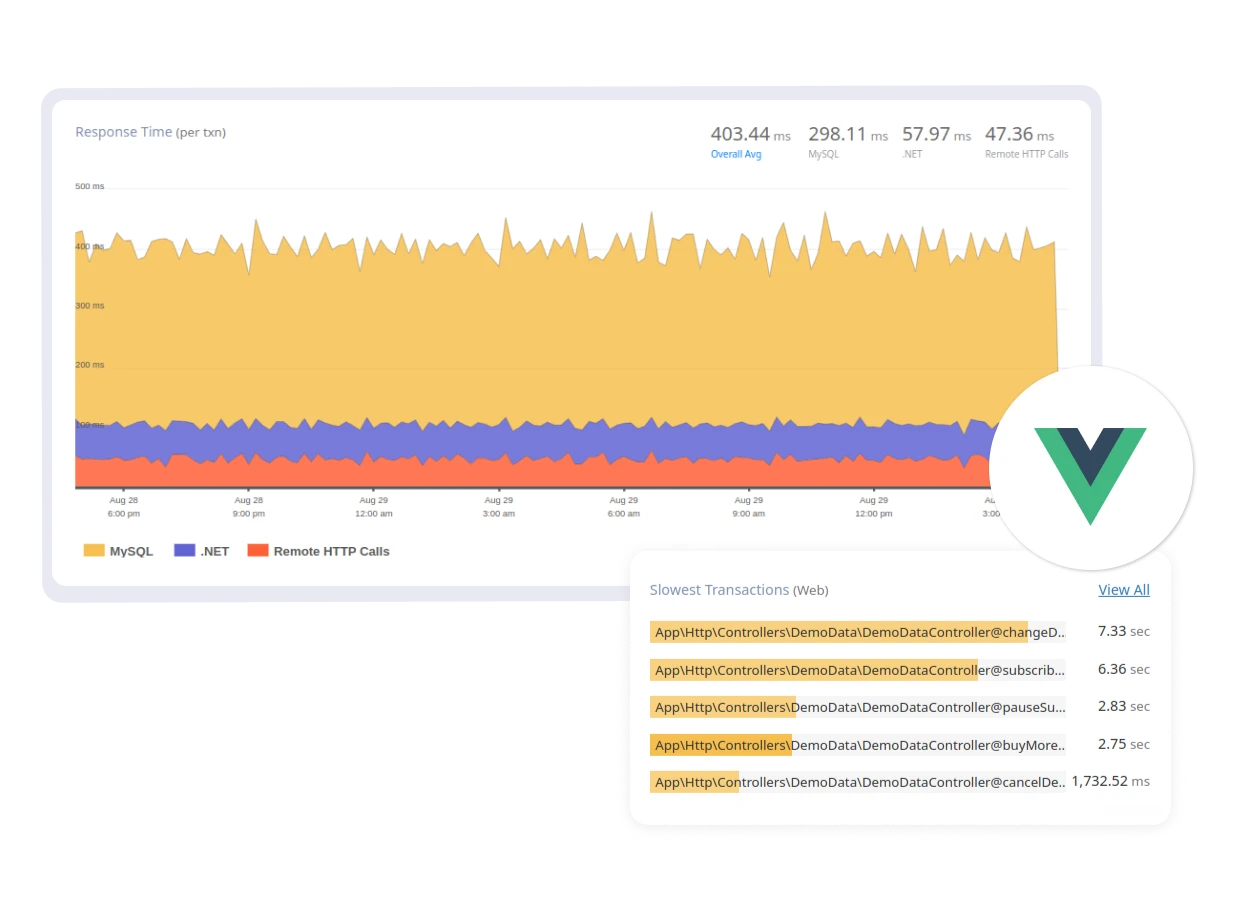
Monitor, troubleshoot, and optimize Vue.js performance with Atatus. Keep your Vue apps running smoothly by detecting and resolving bottlenecks in real-time. Get insights into component rendering, event handling, and resource usage to ensure a responsive interface.
Free Sign Up. No Credit Card Required. Cancel Anytime.
 +1-760-465-2330


