Heroku Platform Lifecycle and Runtime Execution Monitoring
Gain visibility into deployments, dyno health, dependency behavior, and routing performance.
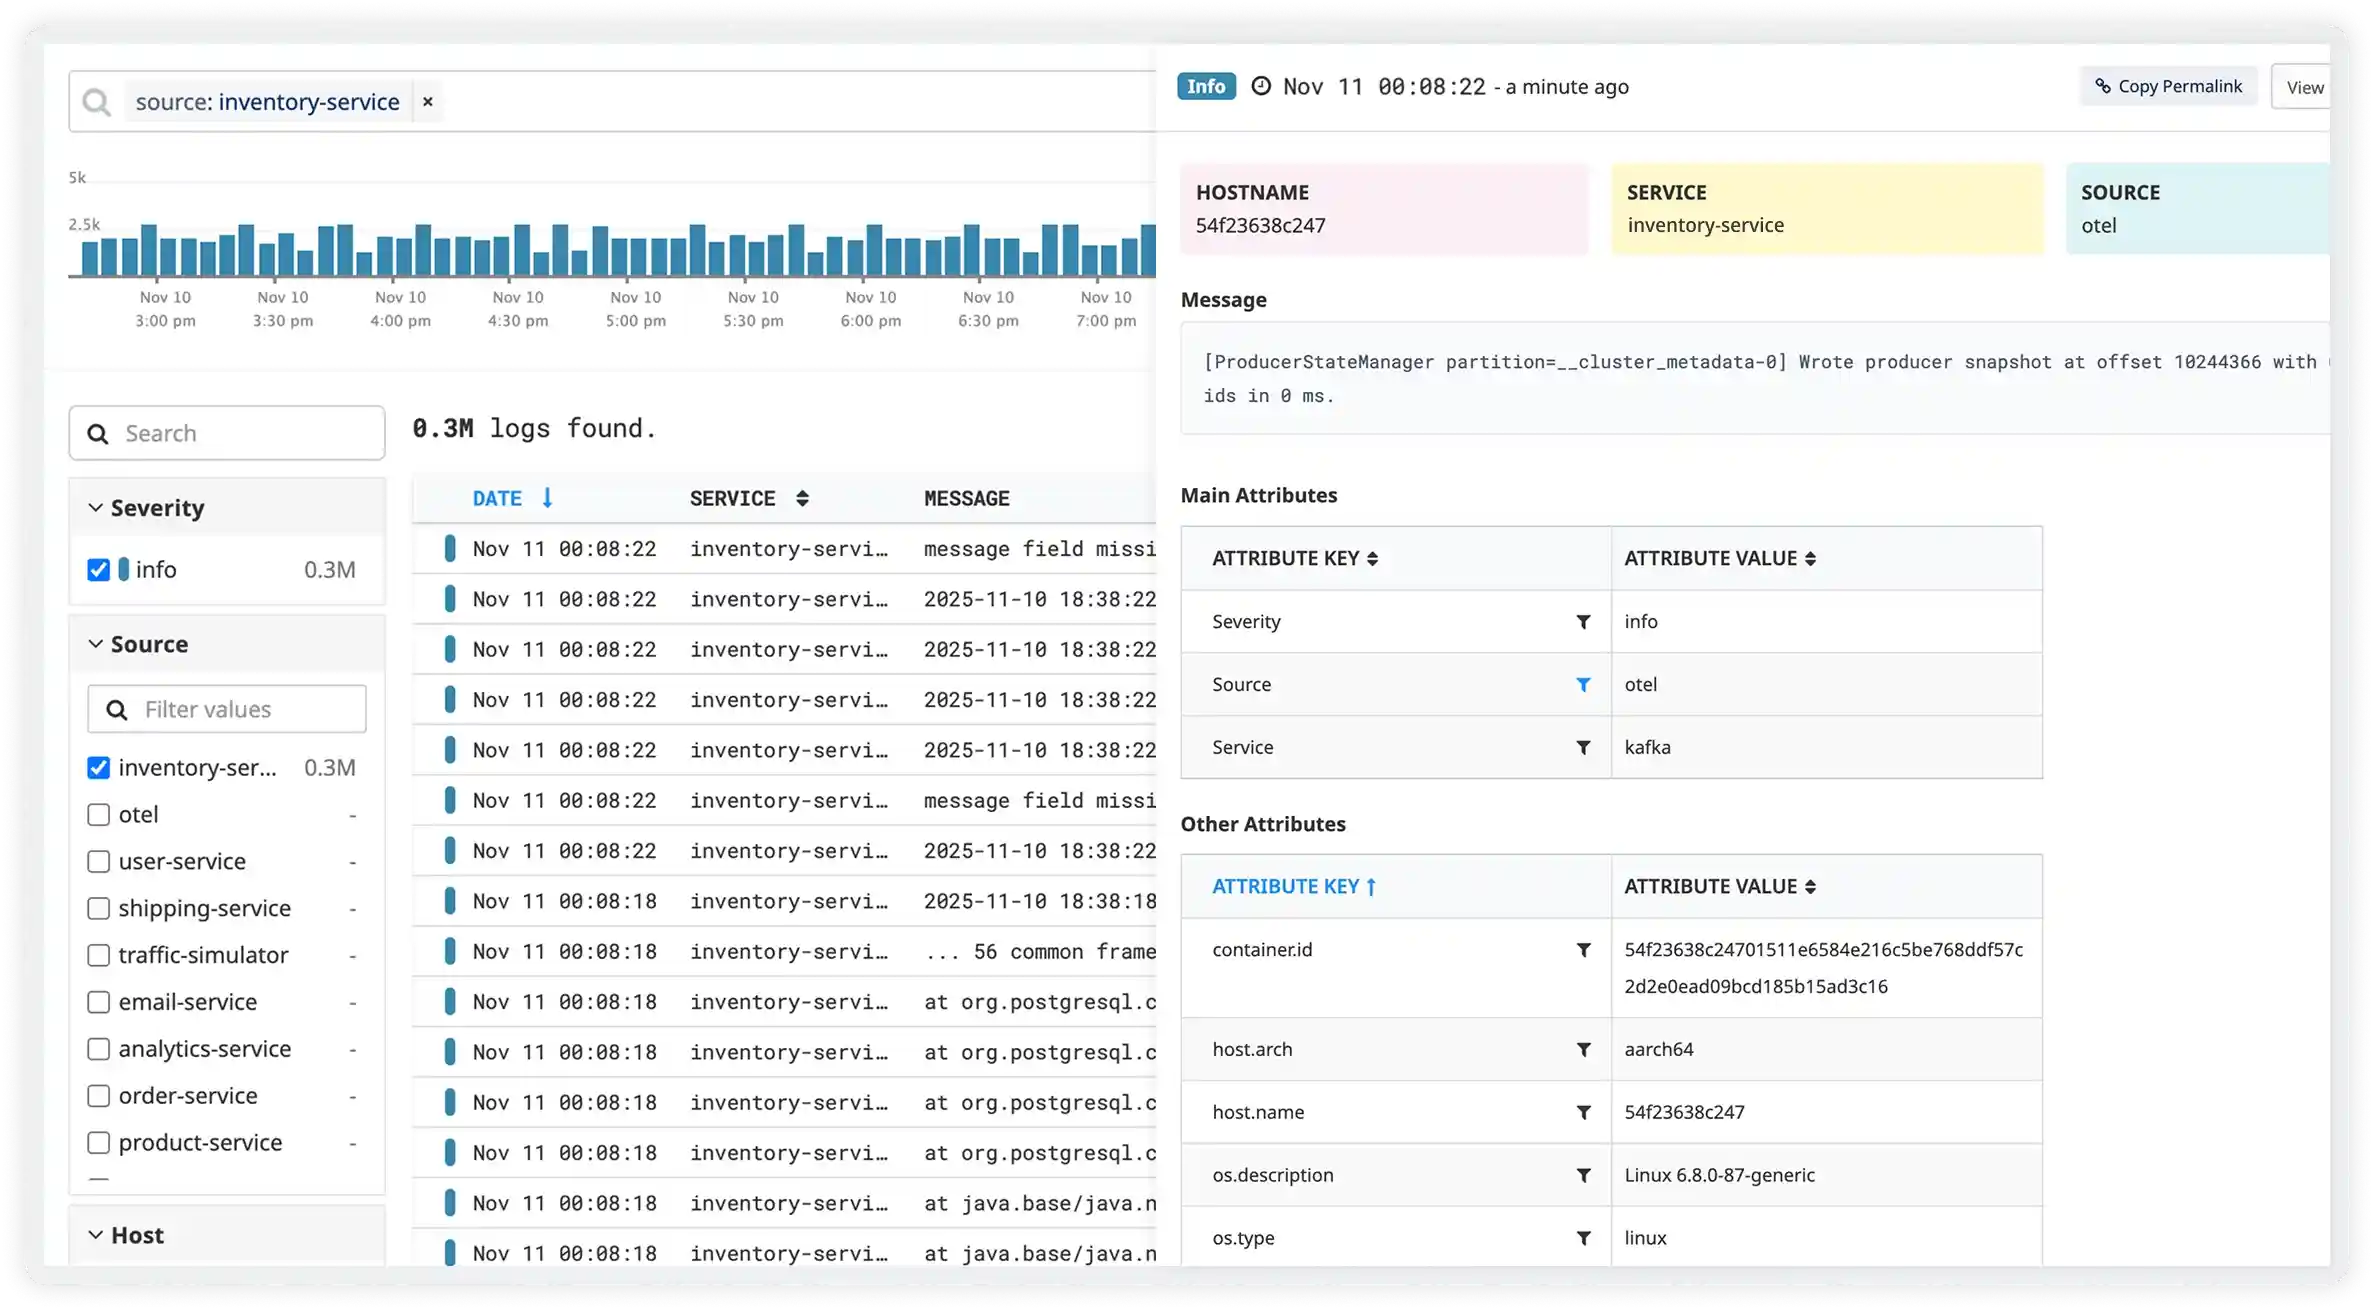
Monitor Heroku logs to troubleshoot application and platform-level issues
Analyze application log streams
Capture Heroku application logs emitted by dynos to understand runtime behavior and errors.
Track dyno lifecycle events
Monitor Heroku logs related to dyno restarts, crashes, and scaling events.
Detect routing errors
Analyze Heroku router logs to identify request timeouts, routing failures, and HTTP error responses.
Monitor platform warnings
Capture Heroku system log entries indicating memory limits, request queueing, and throttling.
Track build and release issues
Inspect Heroku build and release logs to identify failed deployments and configuration errors.
Observe add-on related errors
Monitor Heroku logs generated by add-ons to detect integration and connectivity issues.
Detect security-related events
Analyze logs for authentication failures and access-related warnings.
Correlate platform and app logs
Link Heroku platform logs with application logs for full execution context.
Release and Deployment Lifecycle
- Capture Heroku release logs showing buildpack execution, slug compilation, and configuration variable changes to trace how new versions move from build to runtime.
- Track deployment failures, rollback triggers, and release-phase script errors impacting production stability.
- Correlate release activity with application behavior changes and incident timelines.
- Detect risks in CI/CD workflows that affect deployment reliability.
Dyno Lifecycle and Process Events
- Monitor dyno state transitions such as start, stop, crash, restart, and cycling to understand process-level behavior in Heroku environments.
- Identify frequent dyno crashes, slow boot times, and memory quota breaches impacting runtime continuity.
- Correlate dyno lifecycle events with application workload changes and configuration updates.
- Detect instability patterns that reduce service uptime.
Add-on and External Service Interaction
- Capture logs generated by Heroku add-ons such as Postgres, Redis, and messaging services to observe dependency behavior.
- Identify connection failures, service throttling, and integration errors impacting application functionality.
- Correlate add-on performance with application request flow and background job execution.
- Detect reliability risks across external service dependencies.
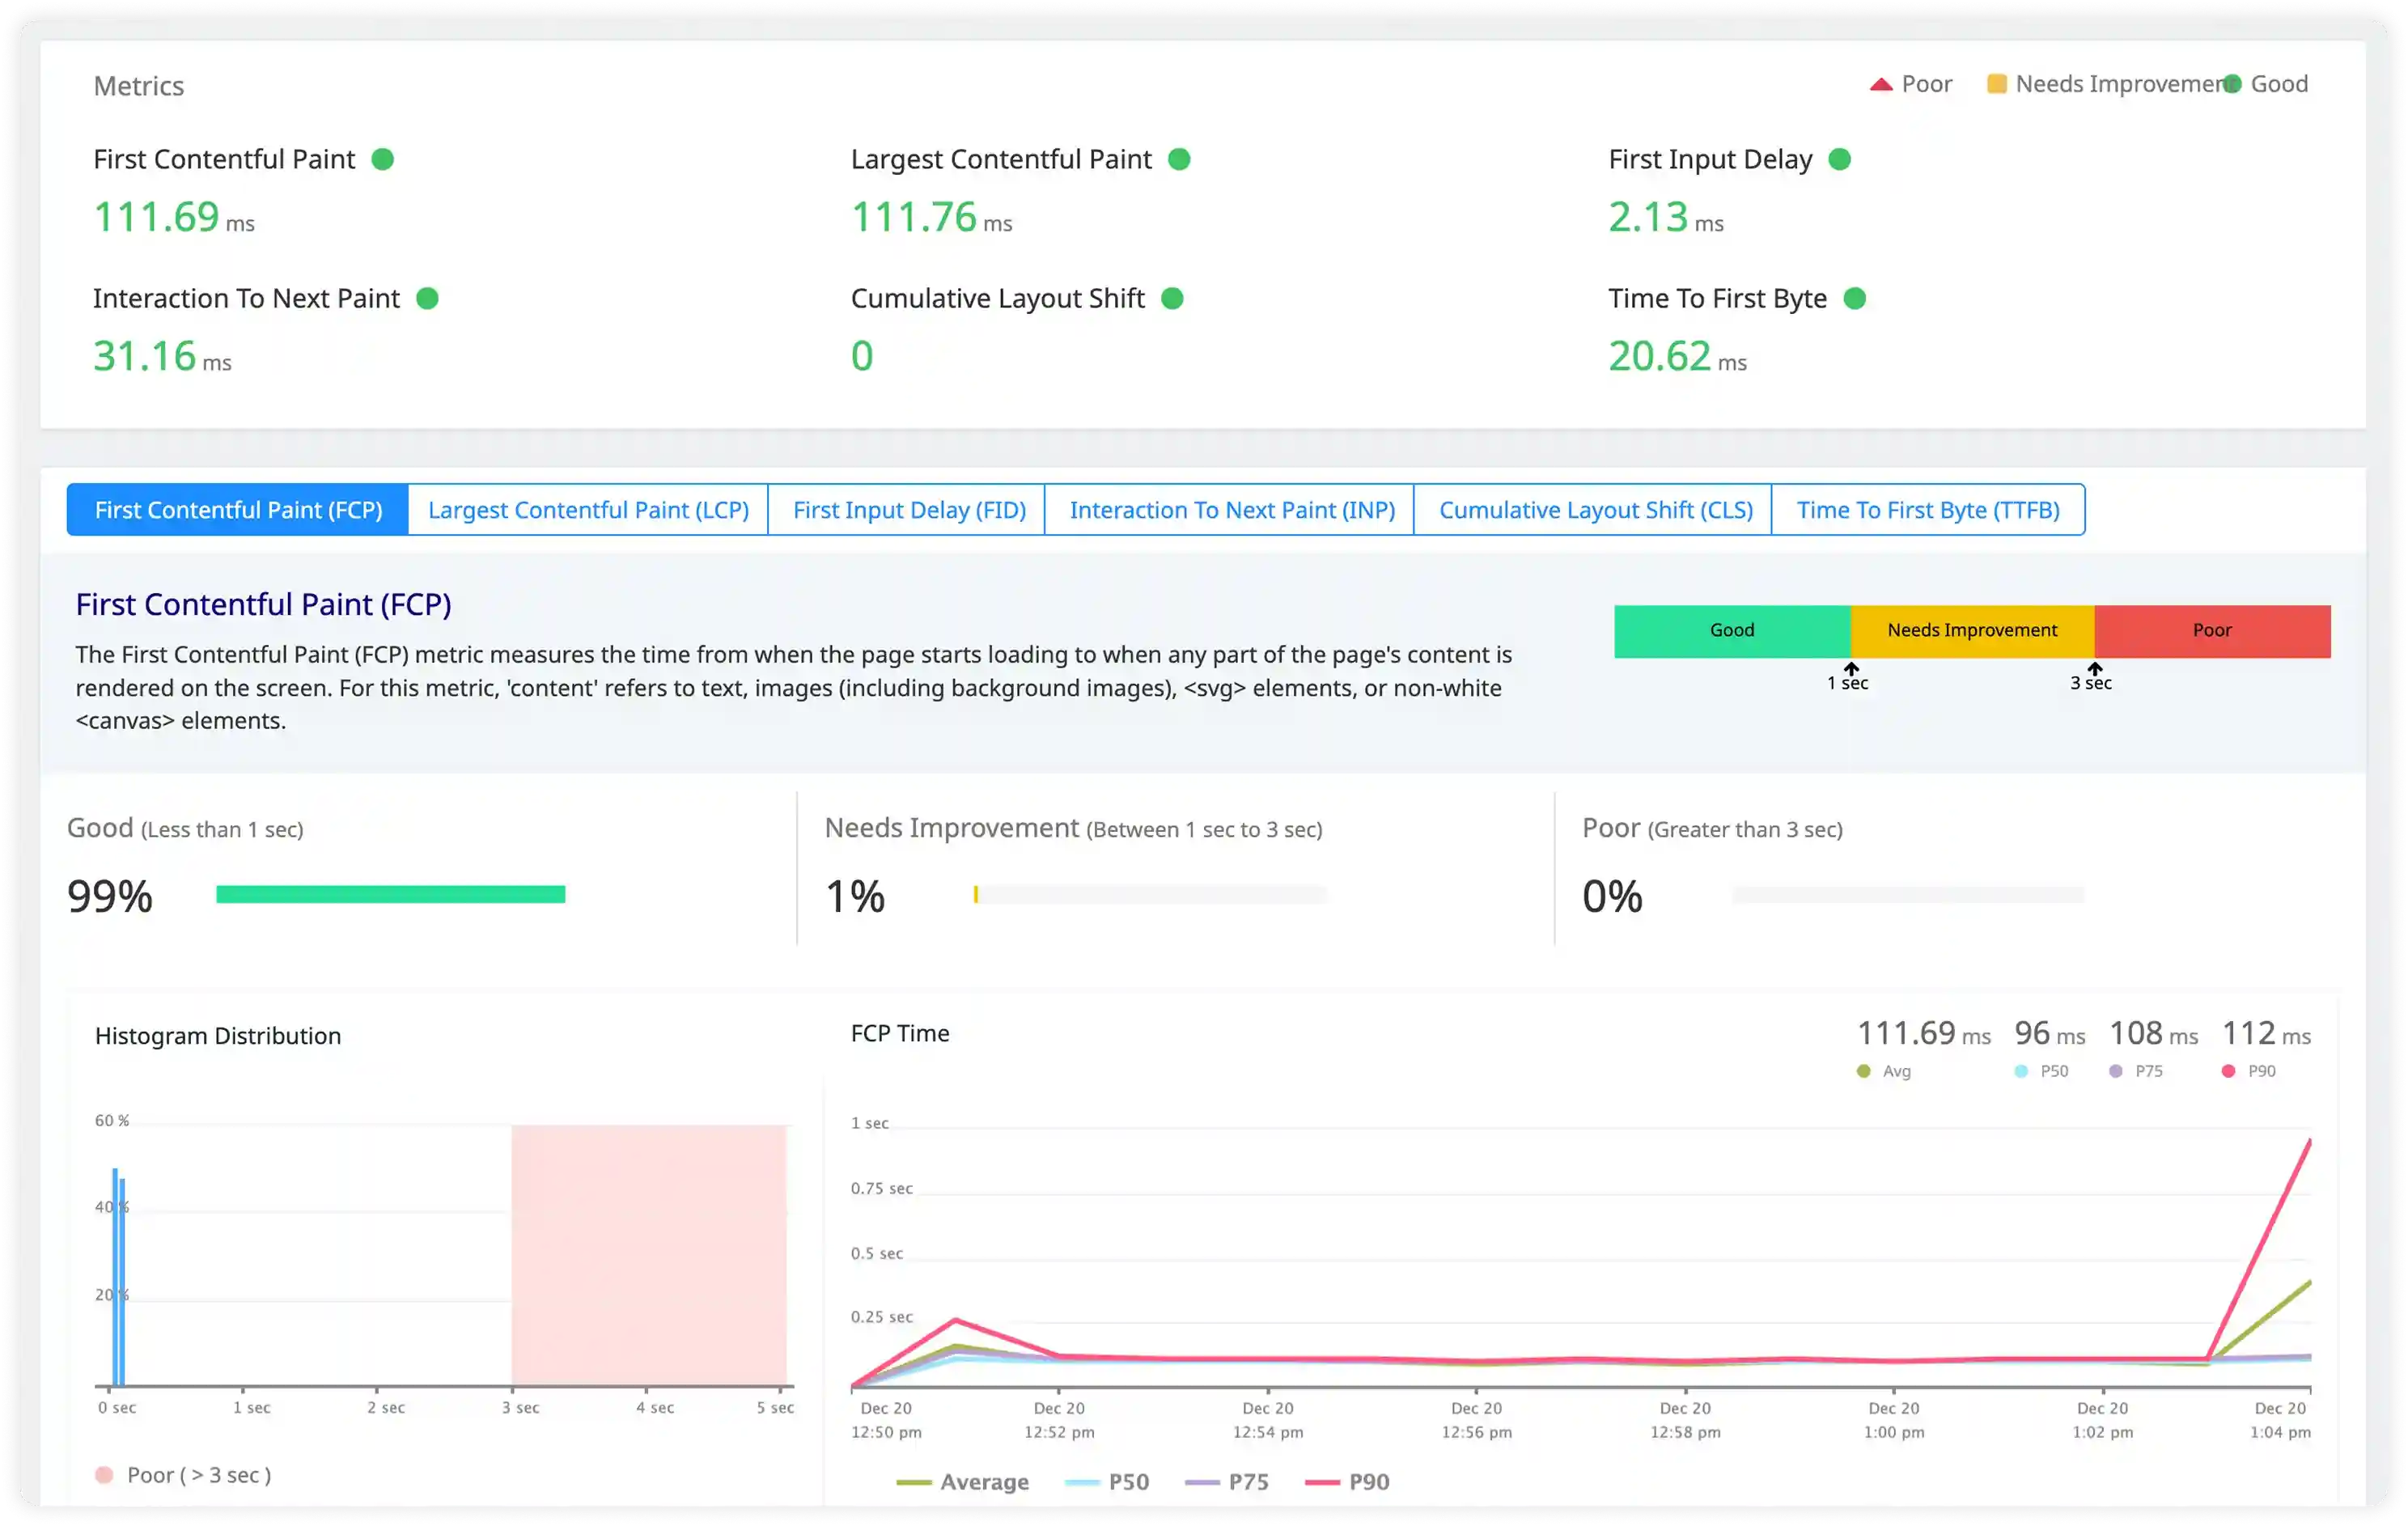
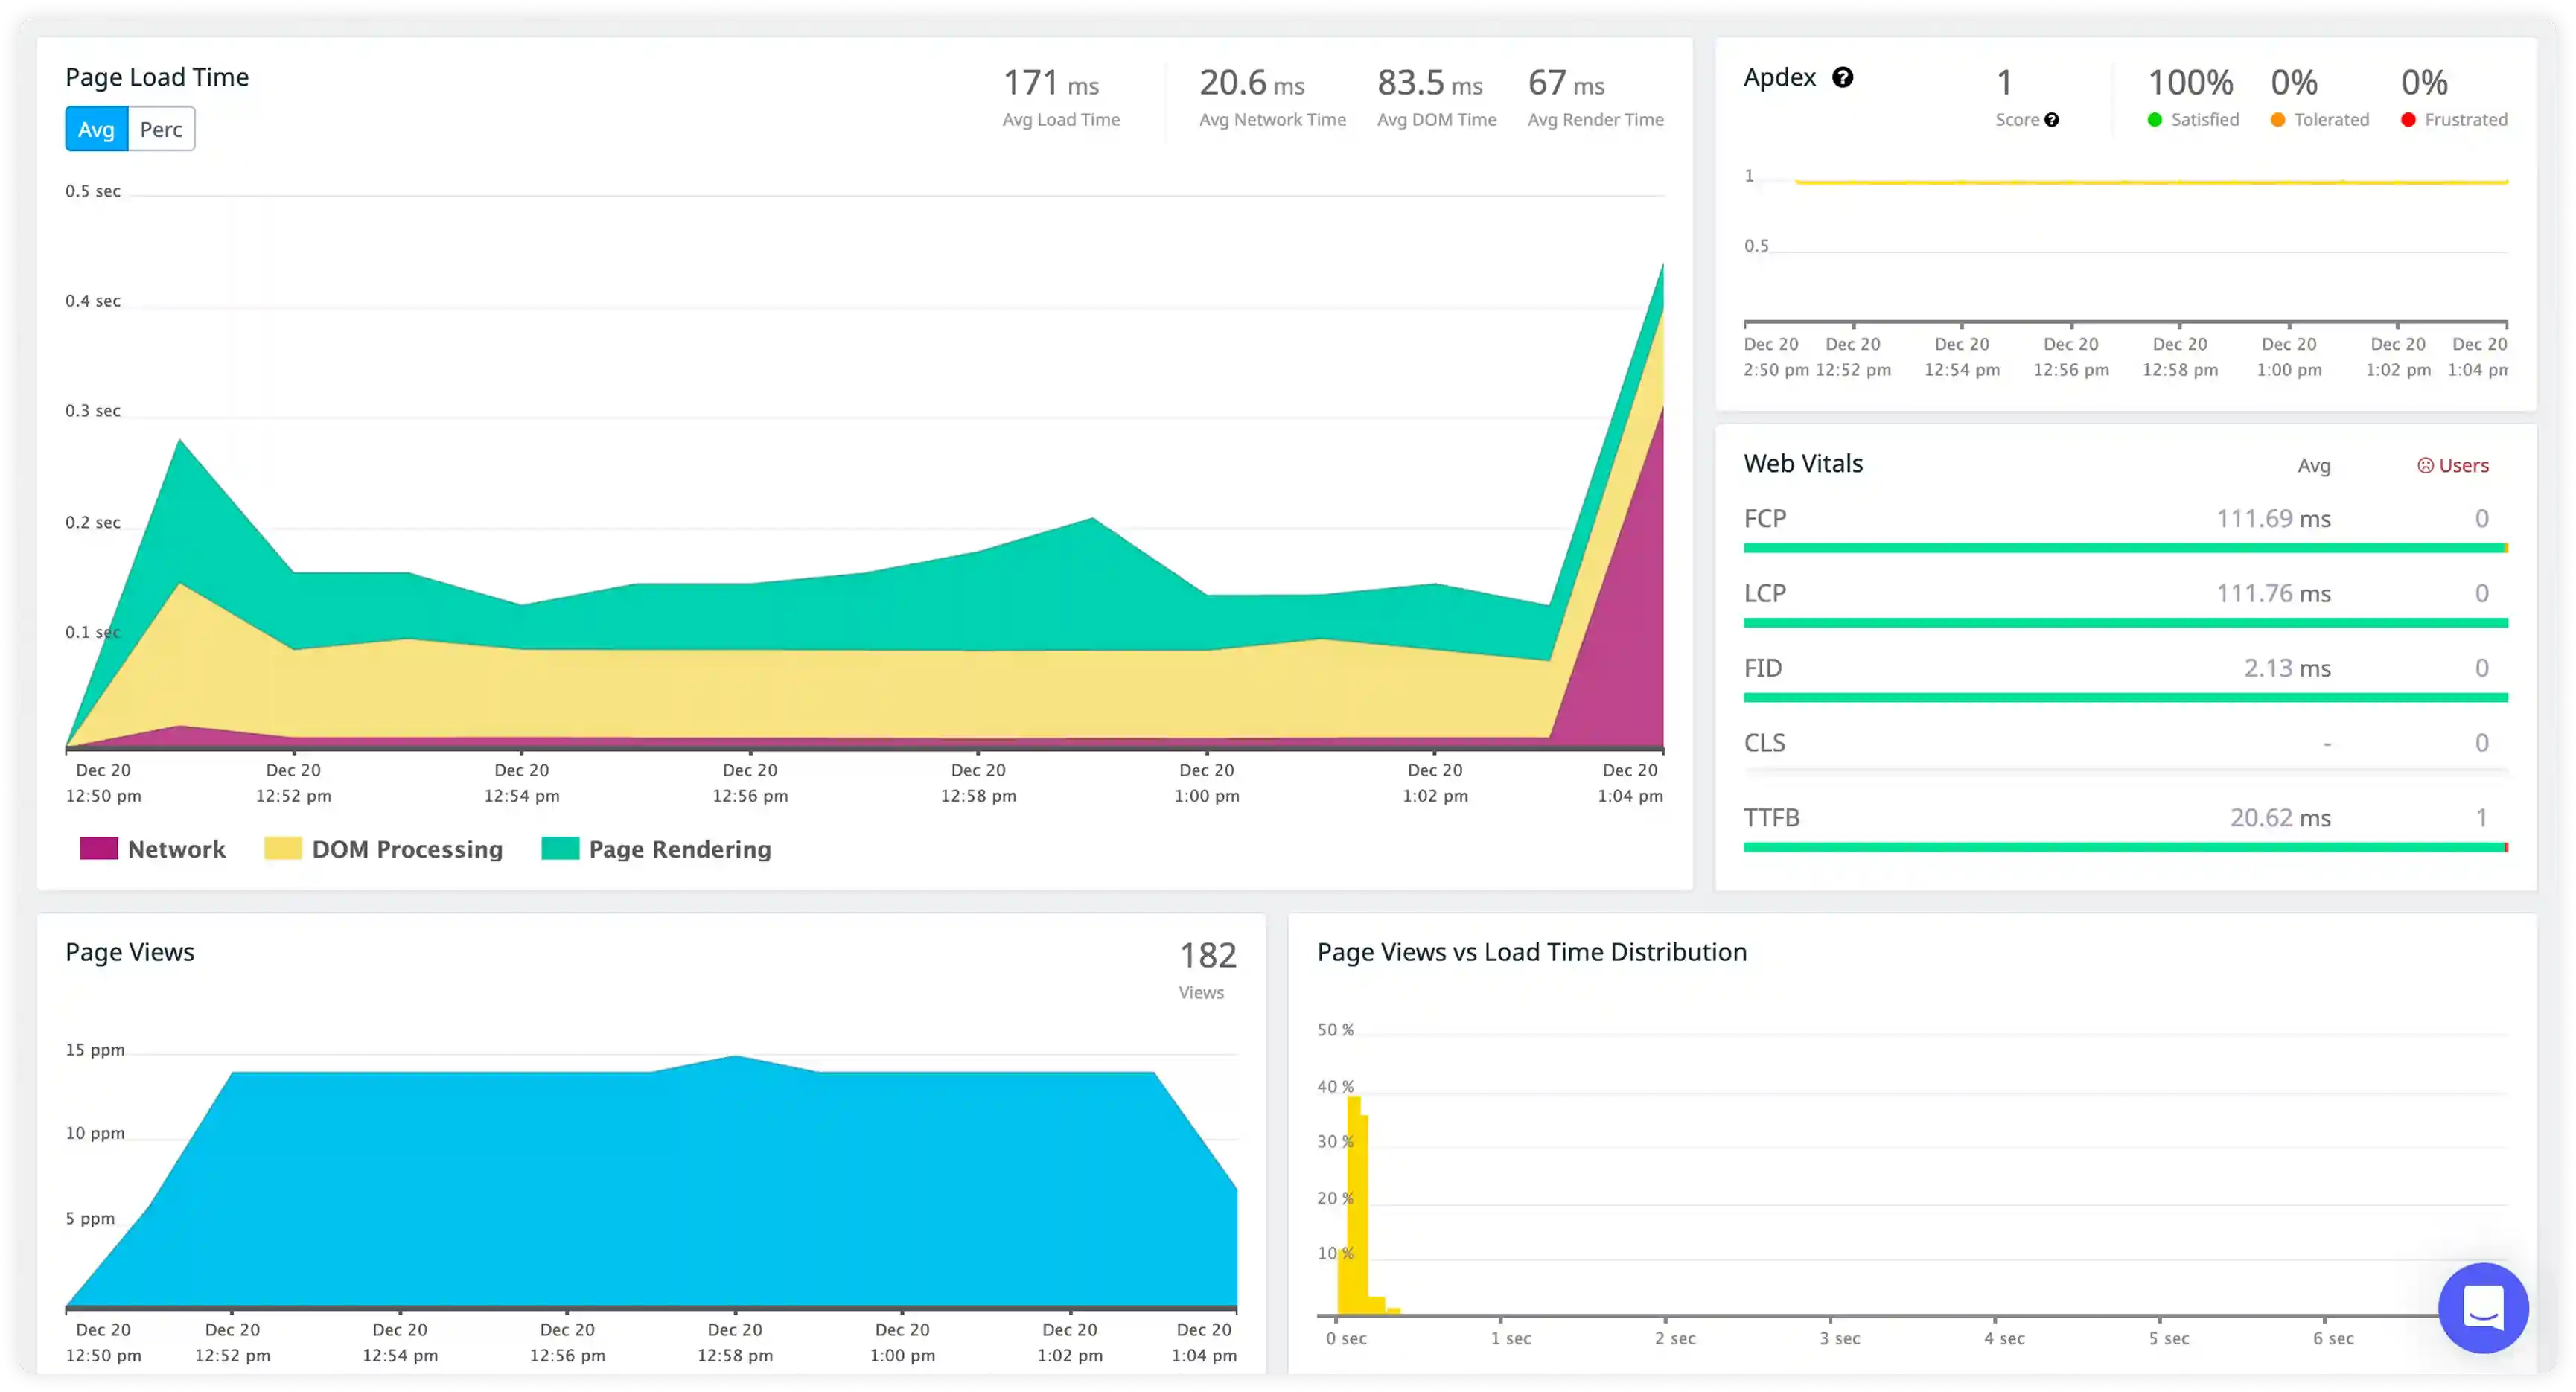
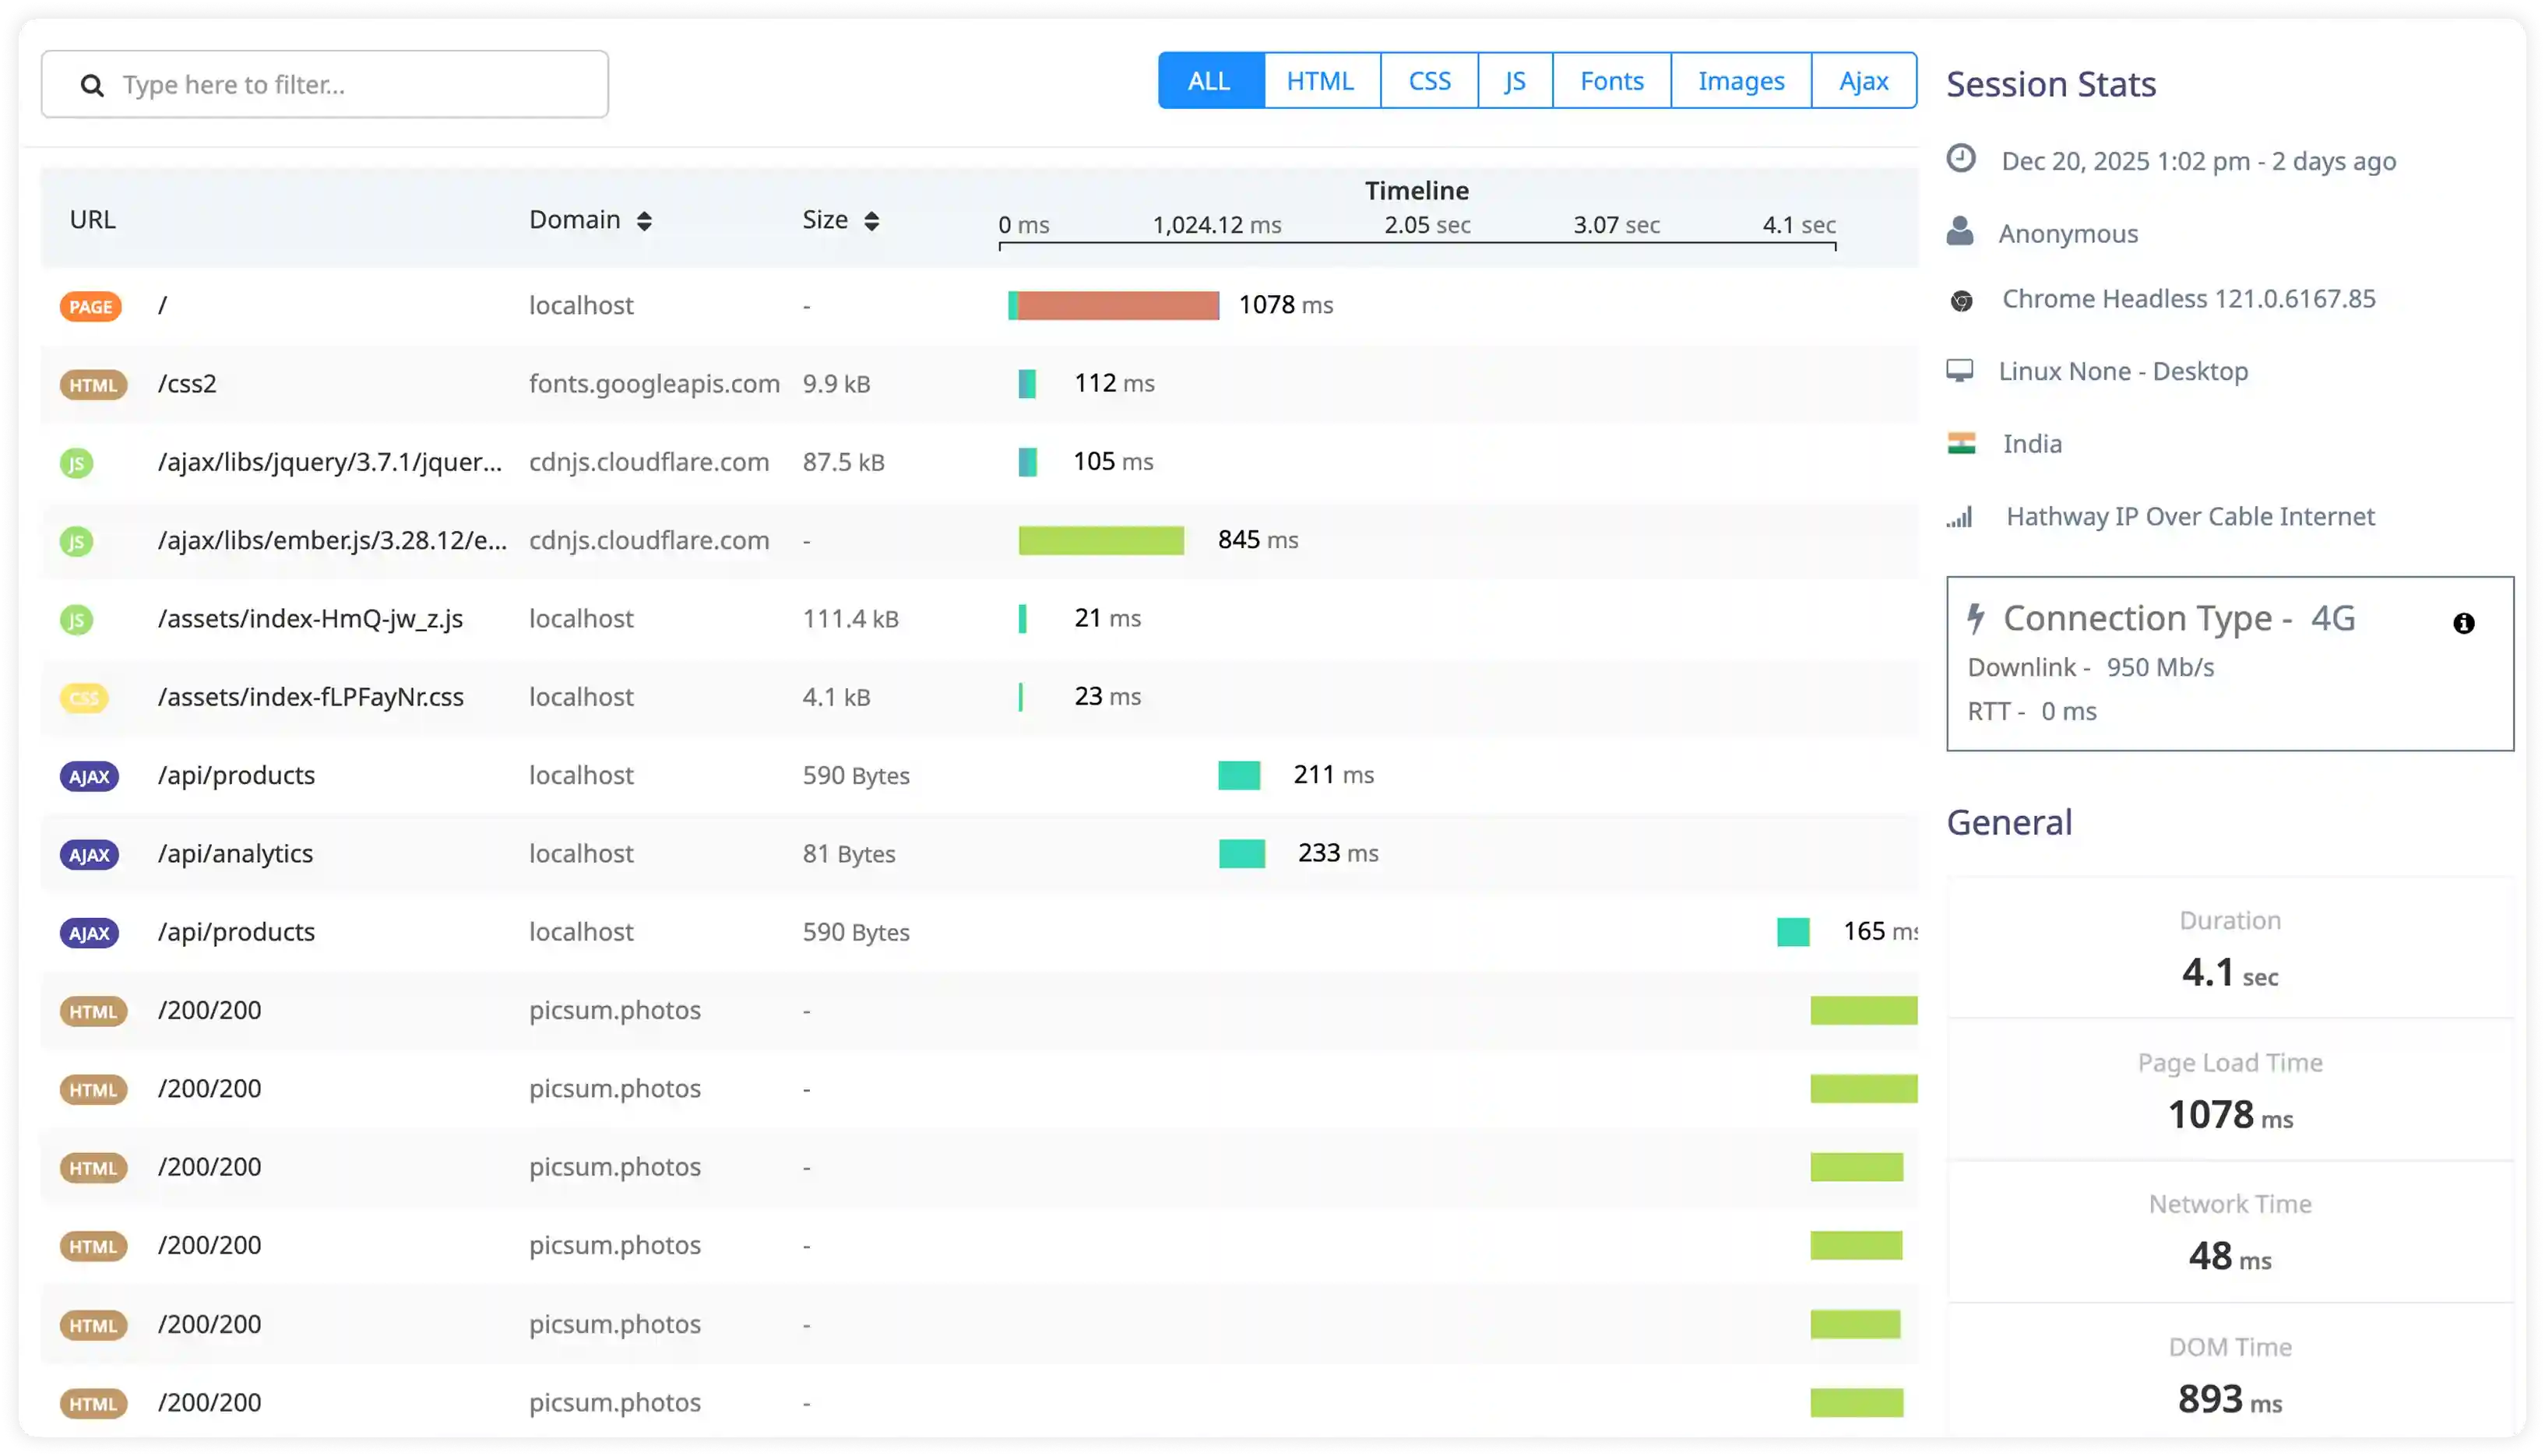
Router and Request-Level Signals
- Analyze Heroku router logs capturing request queue time, service time, and routing status for incoming traffic.
- Identify H10–H99 router errors, request drops, and timeout conditions impacting user-facing endpoints.
- Correlate routing behavior with dyno availability and backend processing delays.
- Detect traffic handling issues affecting response consistency and platform-level request management.
Why teams choose Atatus for Heroku logs monitoring
Native Heroku integration
Atatus connects directly to Heroku log streams without requiring additional agents.
Unified platform visibility
Atatus combines application, router, and system logs for full execution context.
Dyno issue detection
Atatus identifies dyno crashes, restarts, and memory-related problems quickly.
Real-time alerting
Atatus triggers alerts on critical Heroku log events affecting availability and performance.
Cross-service correlation
Atatus links Heroku logs with downstream services for end-to-end visibility.
Long-term retention
Atatus securely stores Heroku logs to analyze recurring operational patterns.
Unified Observability for Every Engineering Team
Atatus adapts to how engineering teams work across development, operations, and reliability.
Developers
Trace requests, debug errors, and identify performance issues at the code level with clear context.
DevOps
Track deployments, monitor infrastructure impact, and understand how releases affect application stability.
Release Engineer
Measure service health, latency, and error rates to maintain reliability and reduce production risk.