Press Room
Stay informed with the latest updates, product innovations, and industry insights from Atatus, your trusted partner in full-stack observability. Explore our press resources, including company information, logos, and expert insights, to cover Atatus with ease.
About Atatus
Atatus empowers businesses with end-to-end performance monitoring, ensuring seamless digital experiences. We simplify error tracking and performance optimization by automating the complex and time-consuming tasks, so you can focus on building great applications. Supporting PHP, Java, Ruby, Python, Go, .NET, Node.js, Vue, Angular, React, and more, Atatus provides deep visibility into your app's health.
With real-time insights into errors, latency, and user interactions, Atatus transforms raw data into actionable intelligence, enabling swift issue resolution and seamless user experiences. Instant alerts flag errors and bottlenecks before they escalate, because every millisecond shapes performance.
Logo
Right-click on the image and choose 'Save Image As' to download it.
Why Choose Atatus?
Full-Stack Clarity, Zero Blind Spots: Unlock deep, actionable insights across your entire infrastructure, applications, logs, and security, so nothing goes unnoticed.
Fix Before It Fails: Stay ahead of downtime with AI-powered anomaly detection and real-time alerts that help you resolve issues before they impact users.
Effortless Scalability, Peak Performance: Whether you're a startup or an enterprise, Atatus adapts seamlessly to your data needs, ensuring reliability at any scale.
More Value, Less Cost: Transparent, usage-based pricing that delivers enterprise-grade observability without the premium price tag.
Overview
In today's fast-paced digital landscape, developers face the challenge of frequent build and deploy cycles, where errors and performance issues often go undetected until they impact users. Atatus offers a comprehensive, context-aware platform that not only identifies these issues but provides the insights needed for quick resolution, enabling businesses to stay ahead. Whether a startup or enterprise, Atatus helps improve app performance and resolve issues before they affect end-users.
Atatus offers several plans for different sized customers.
Screenshots
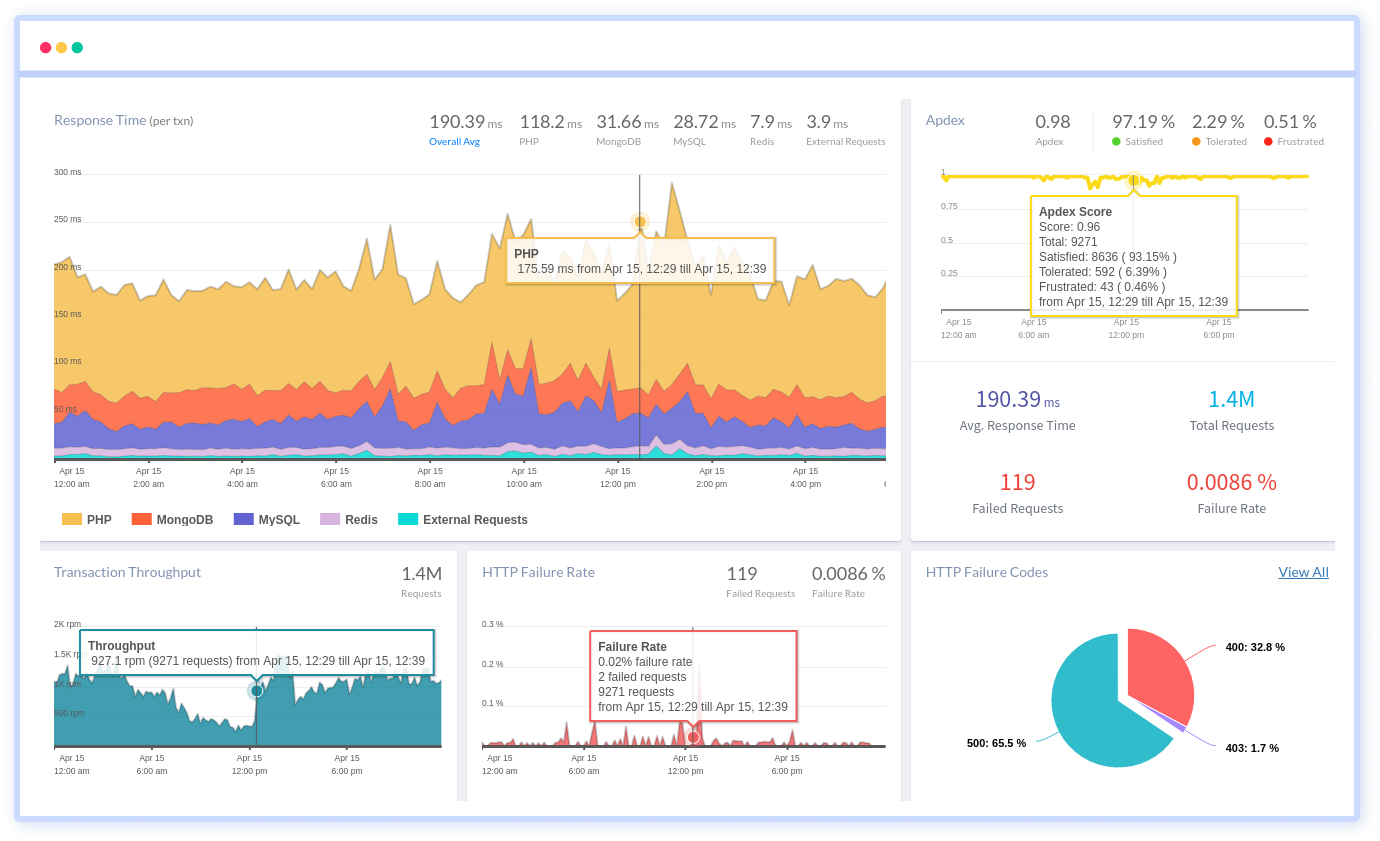
Application Performance Monitoring
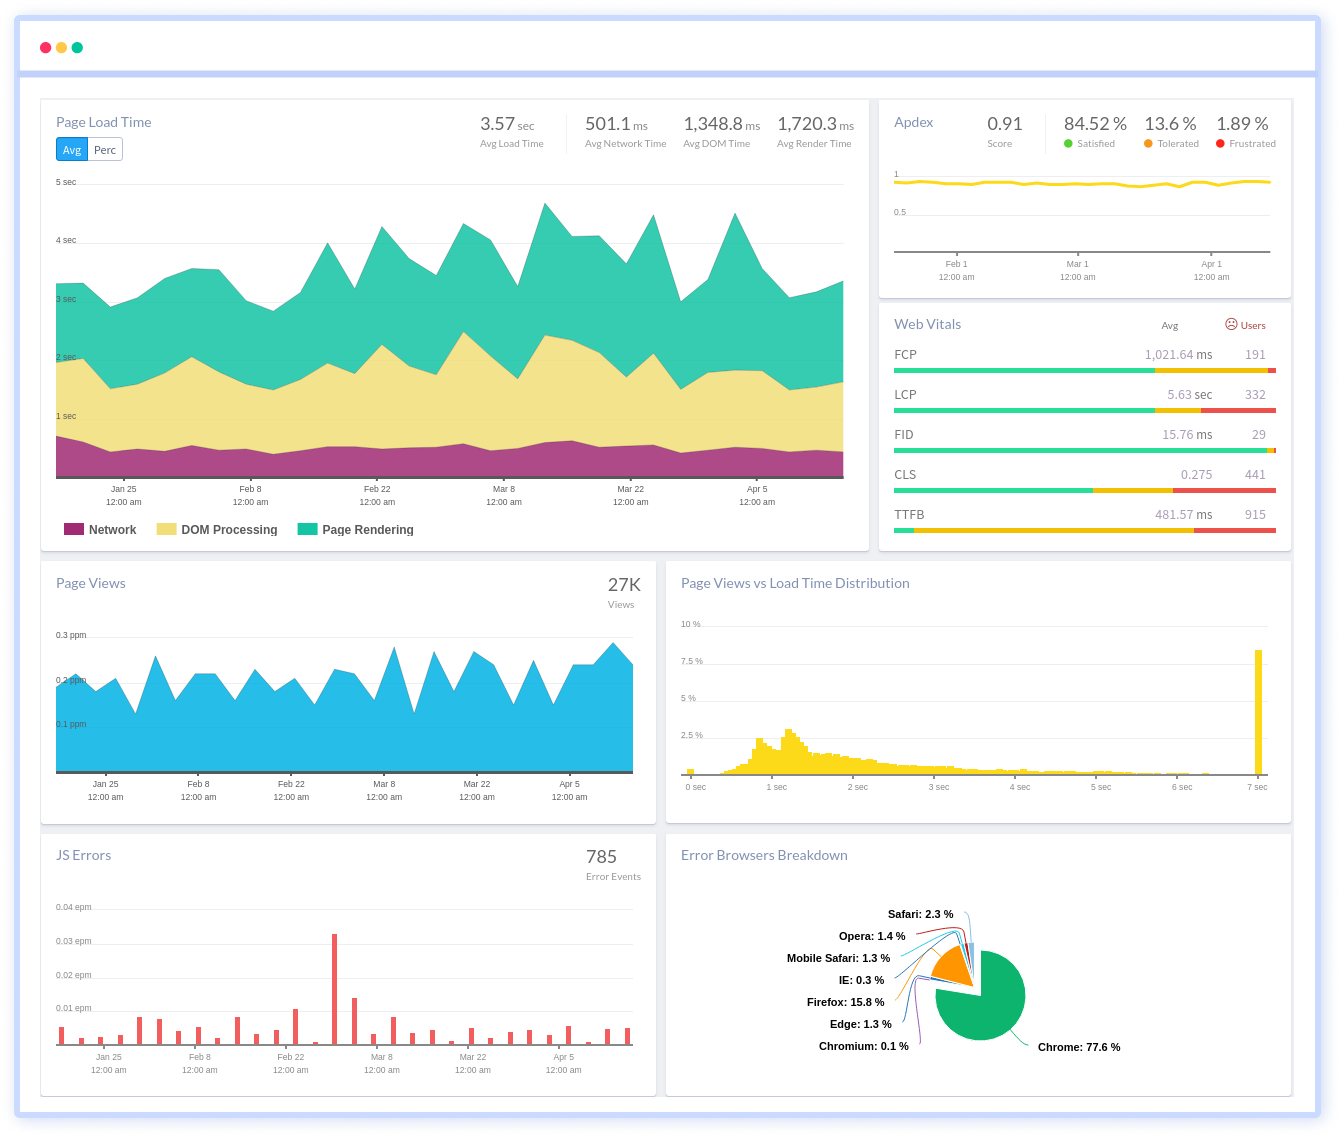
Real User Monitoring
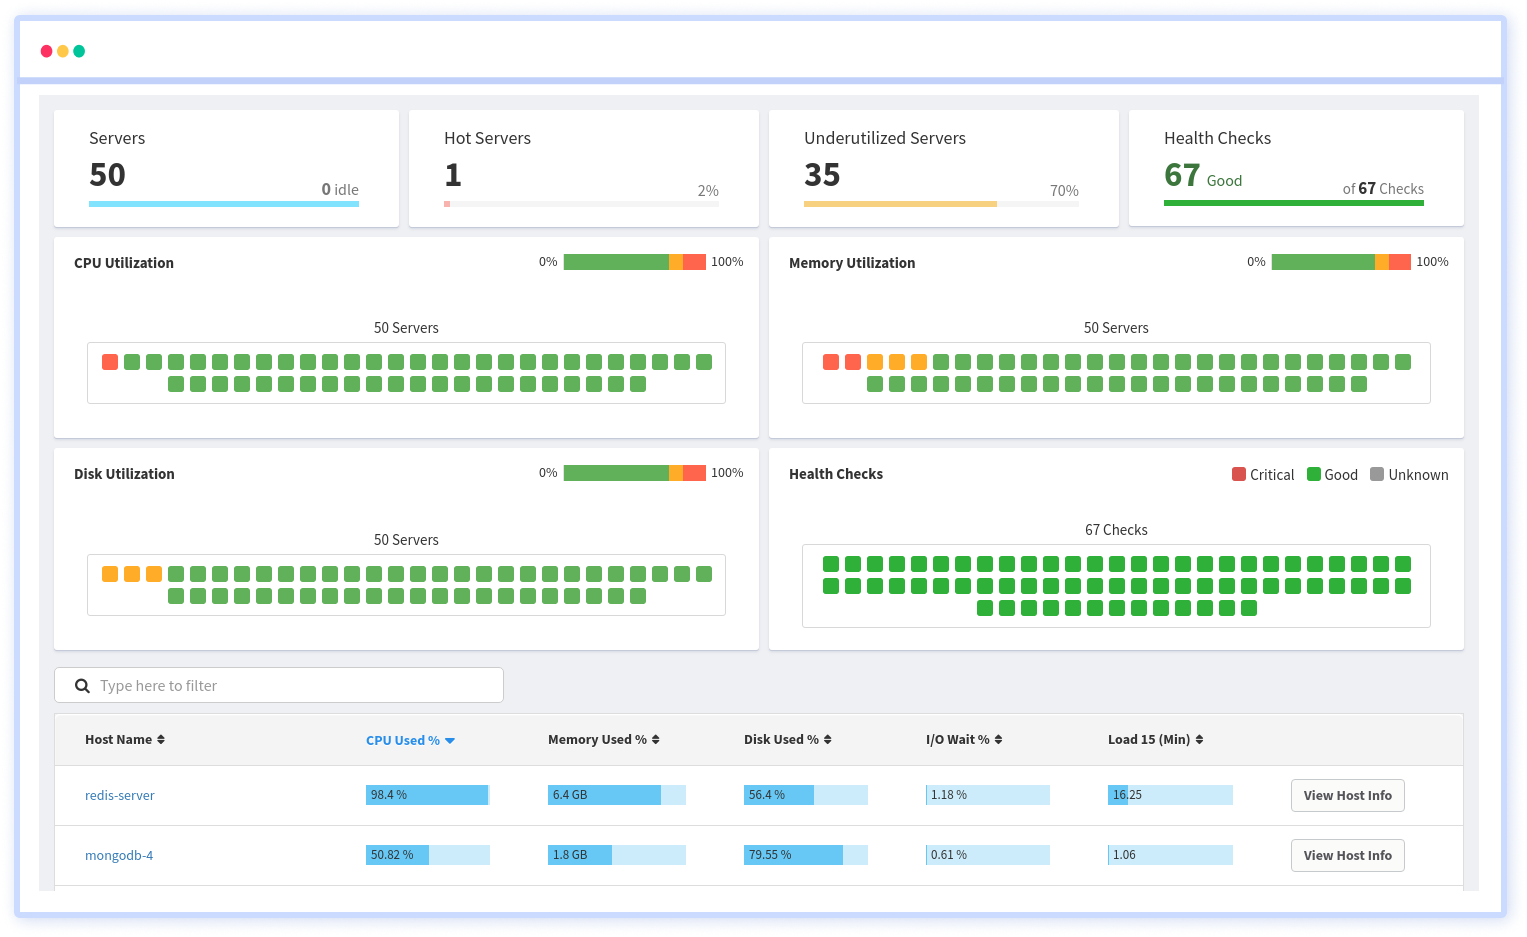
Infrastructure Monitoring
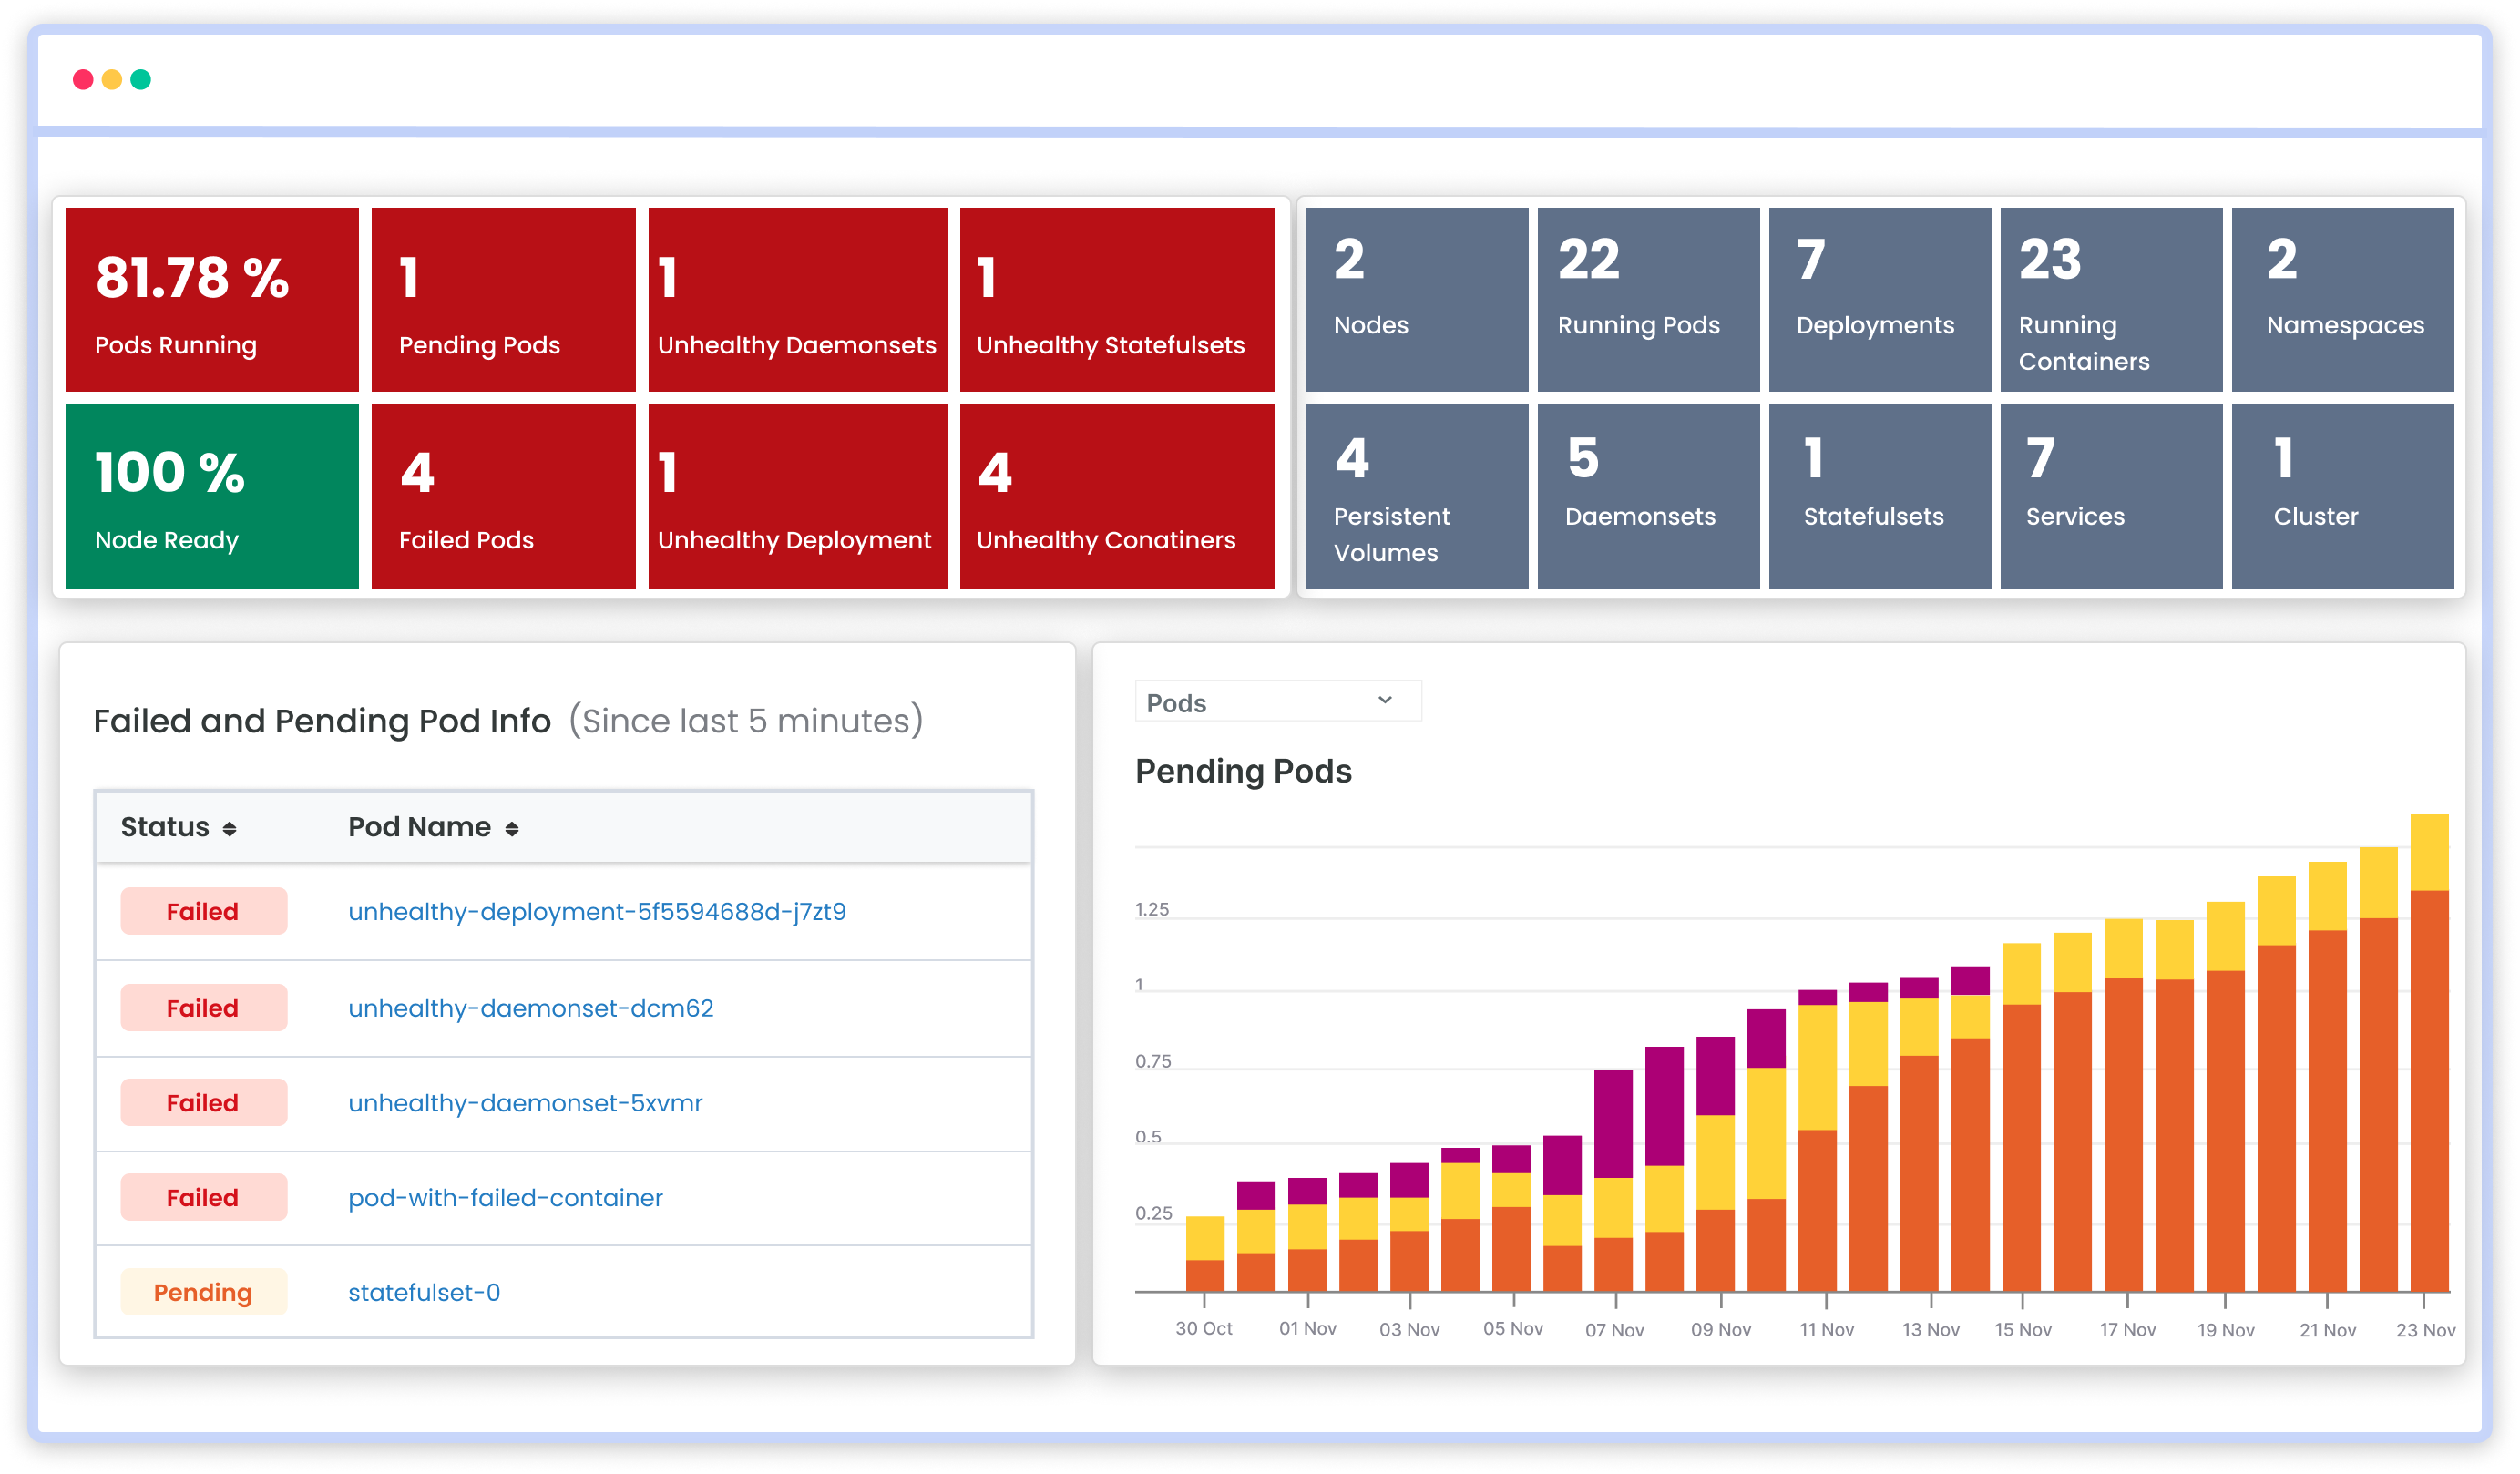
Kubernetes Monitoring
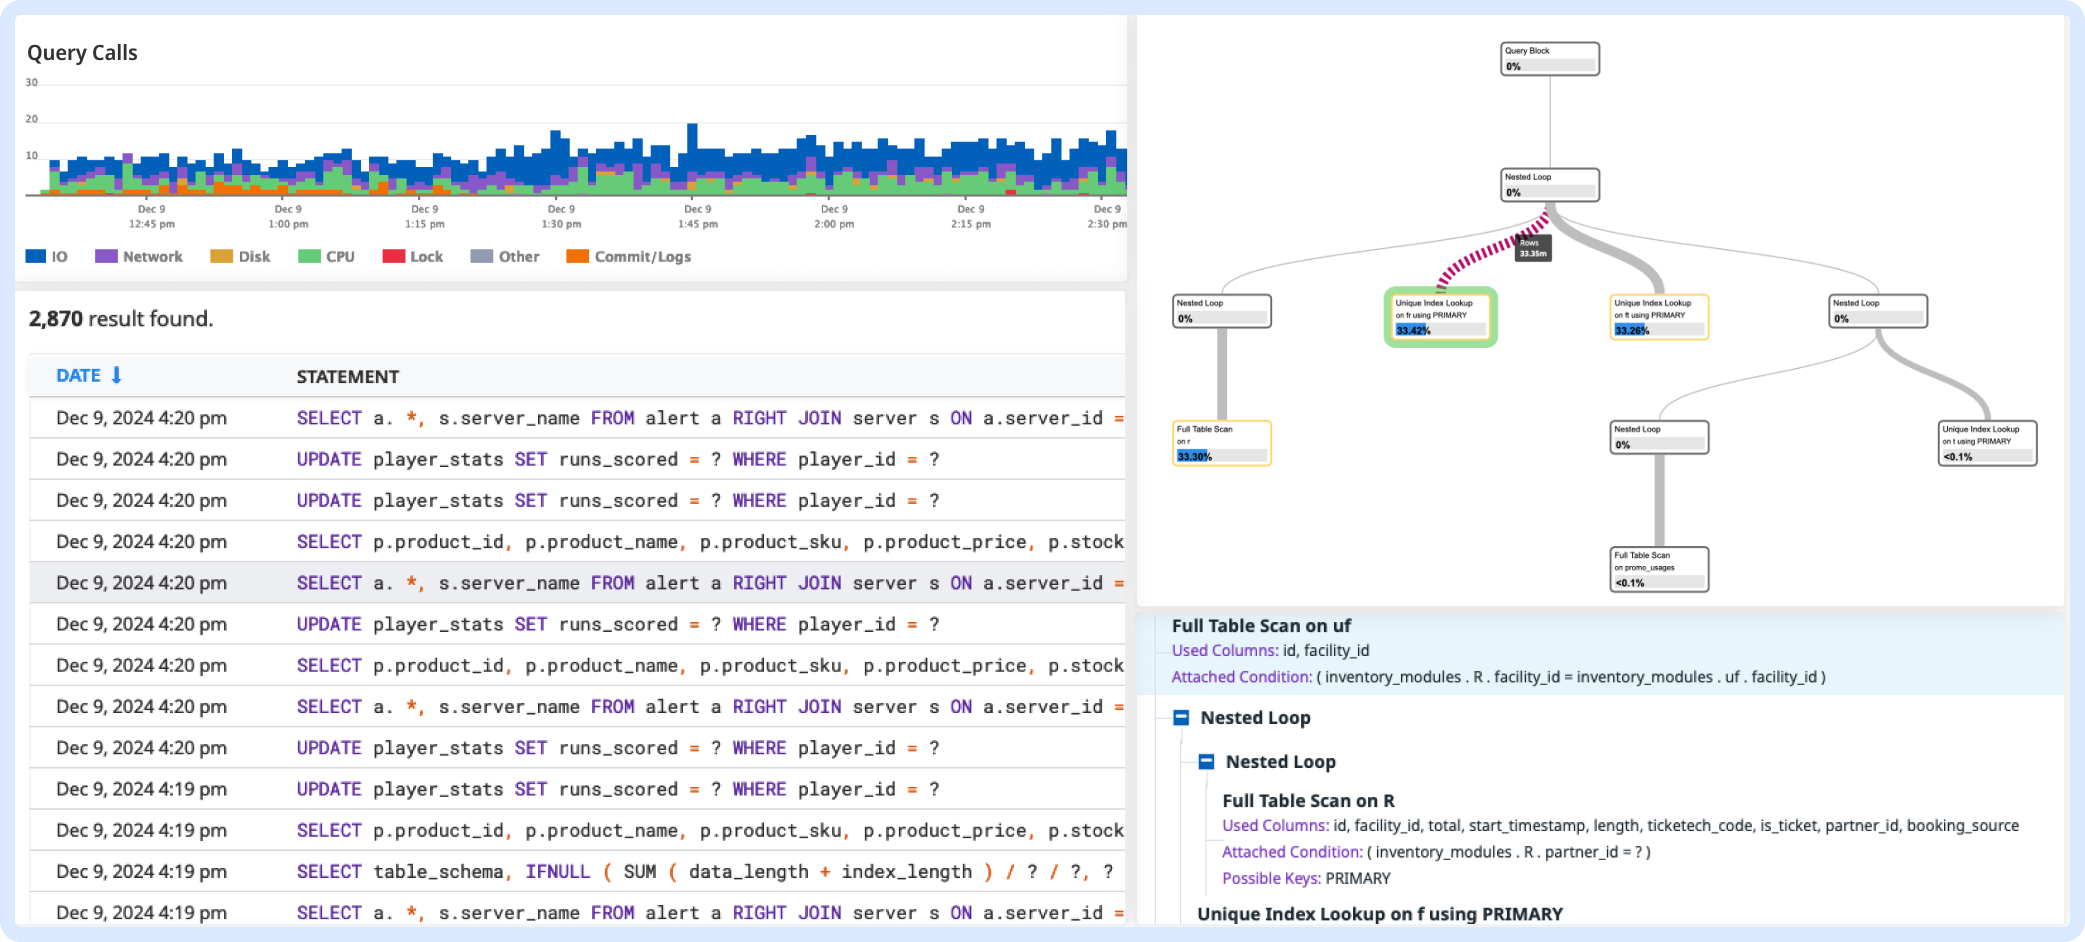
Database Monitoring
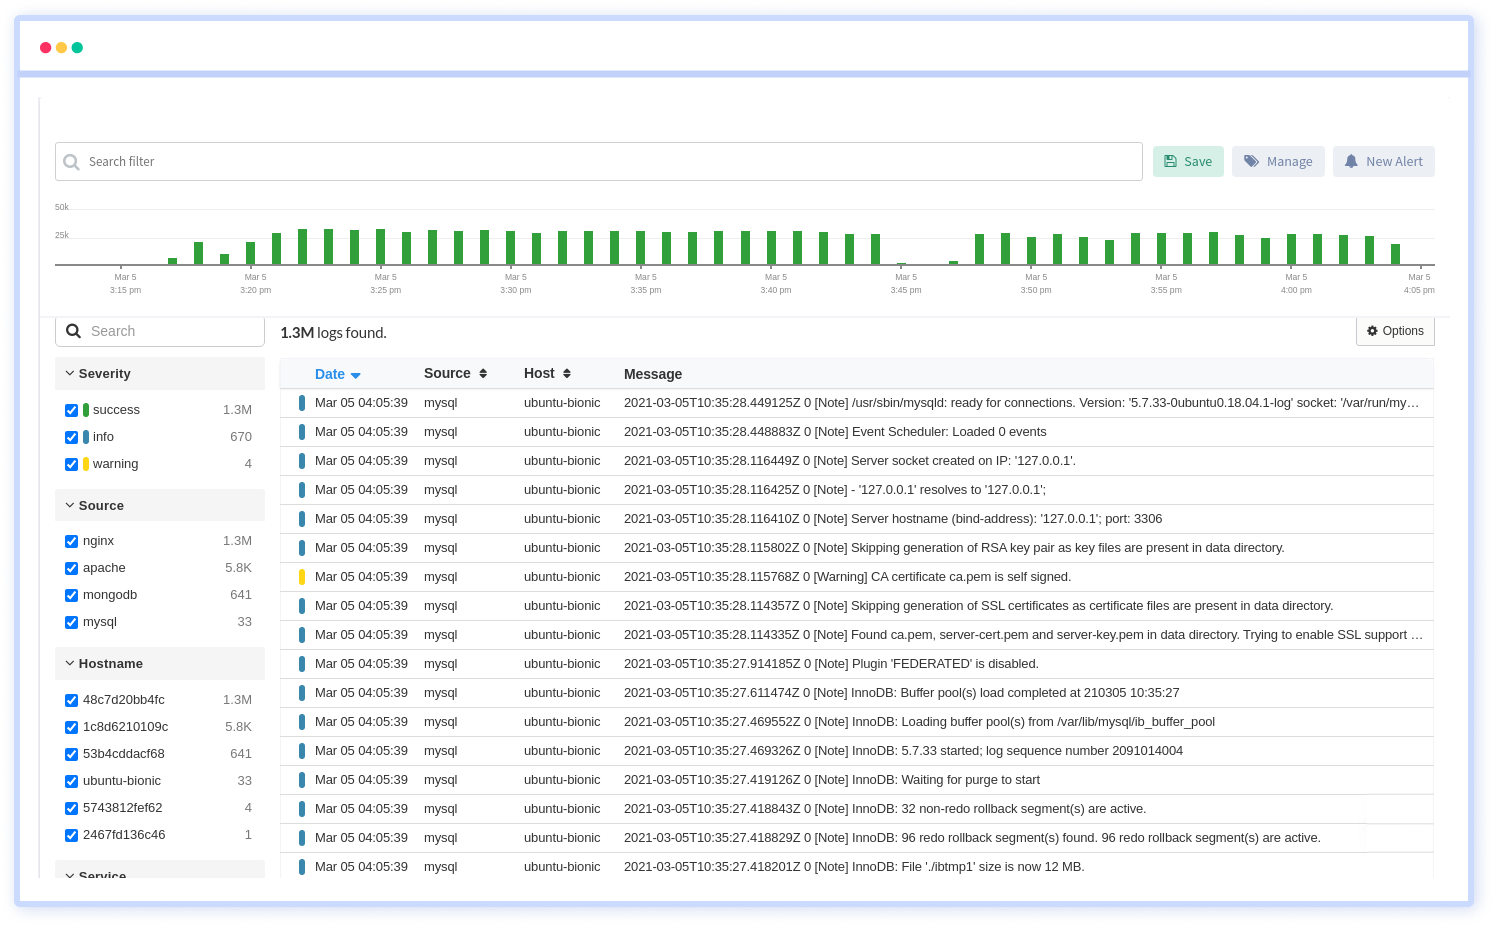
Logs Monitoring
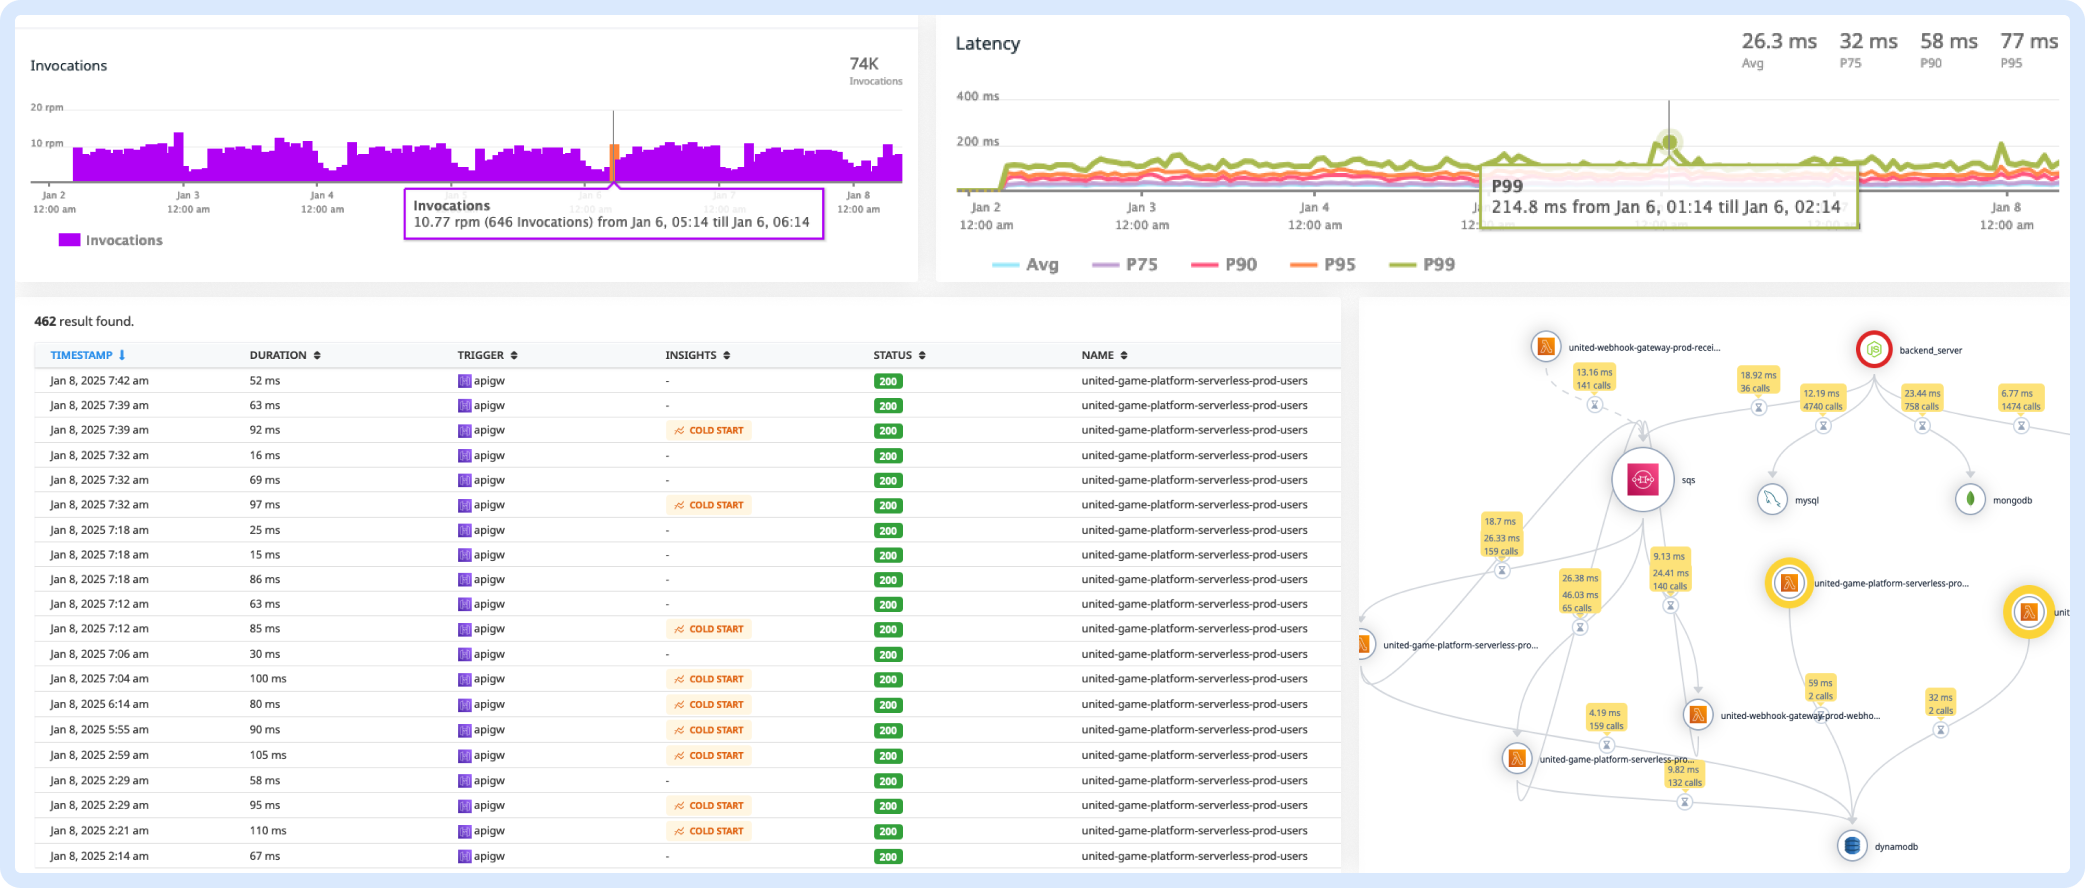
Serverless Monitoring
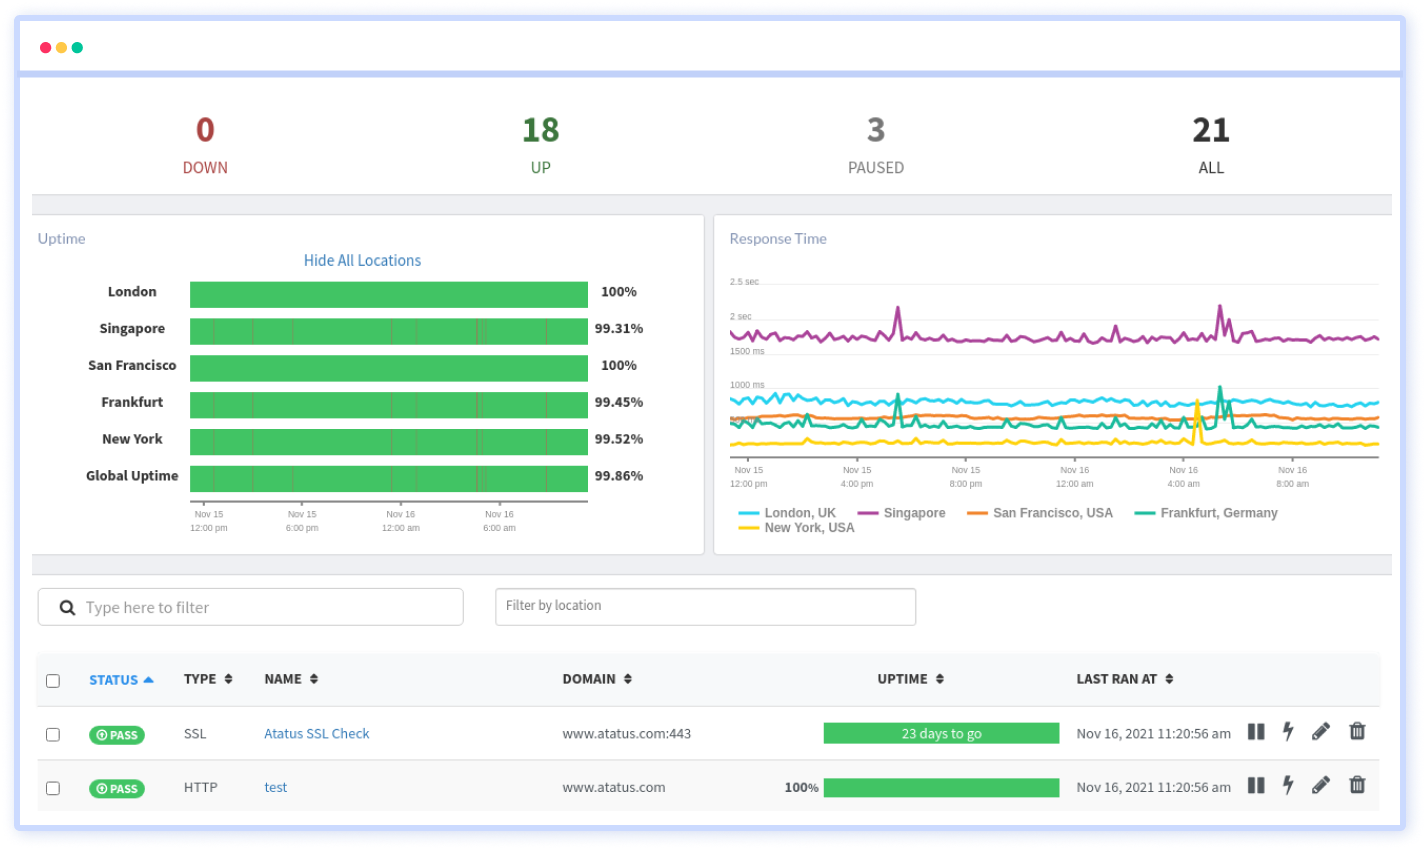
Synthetic Monitoring
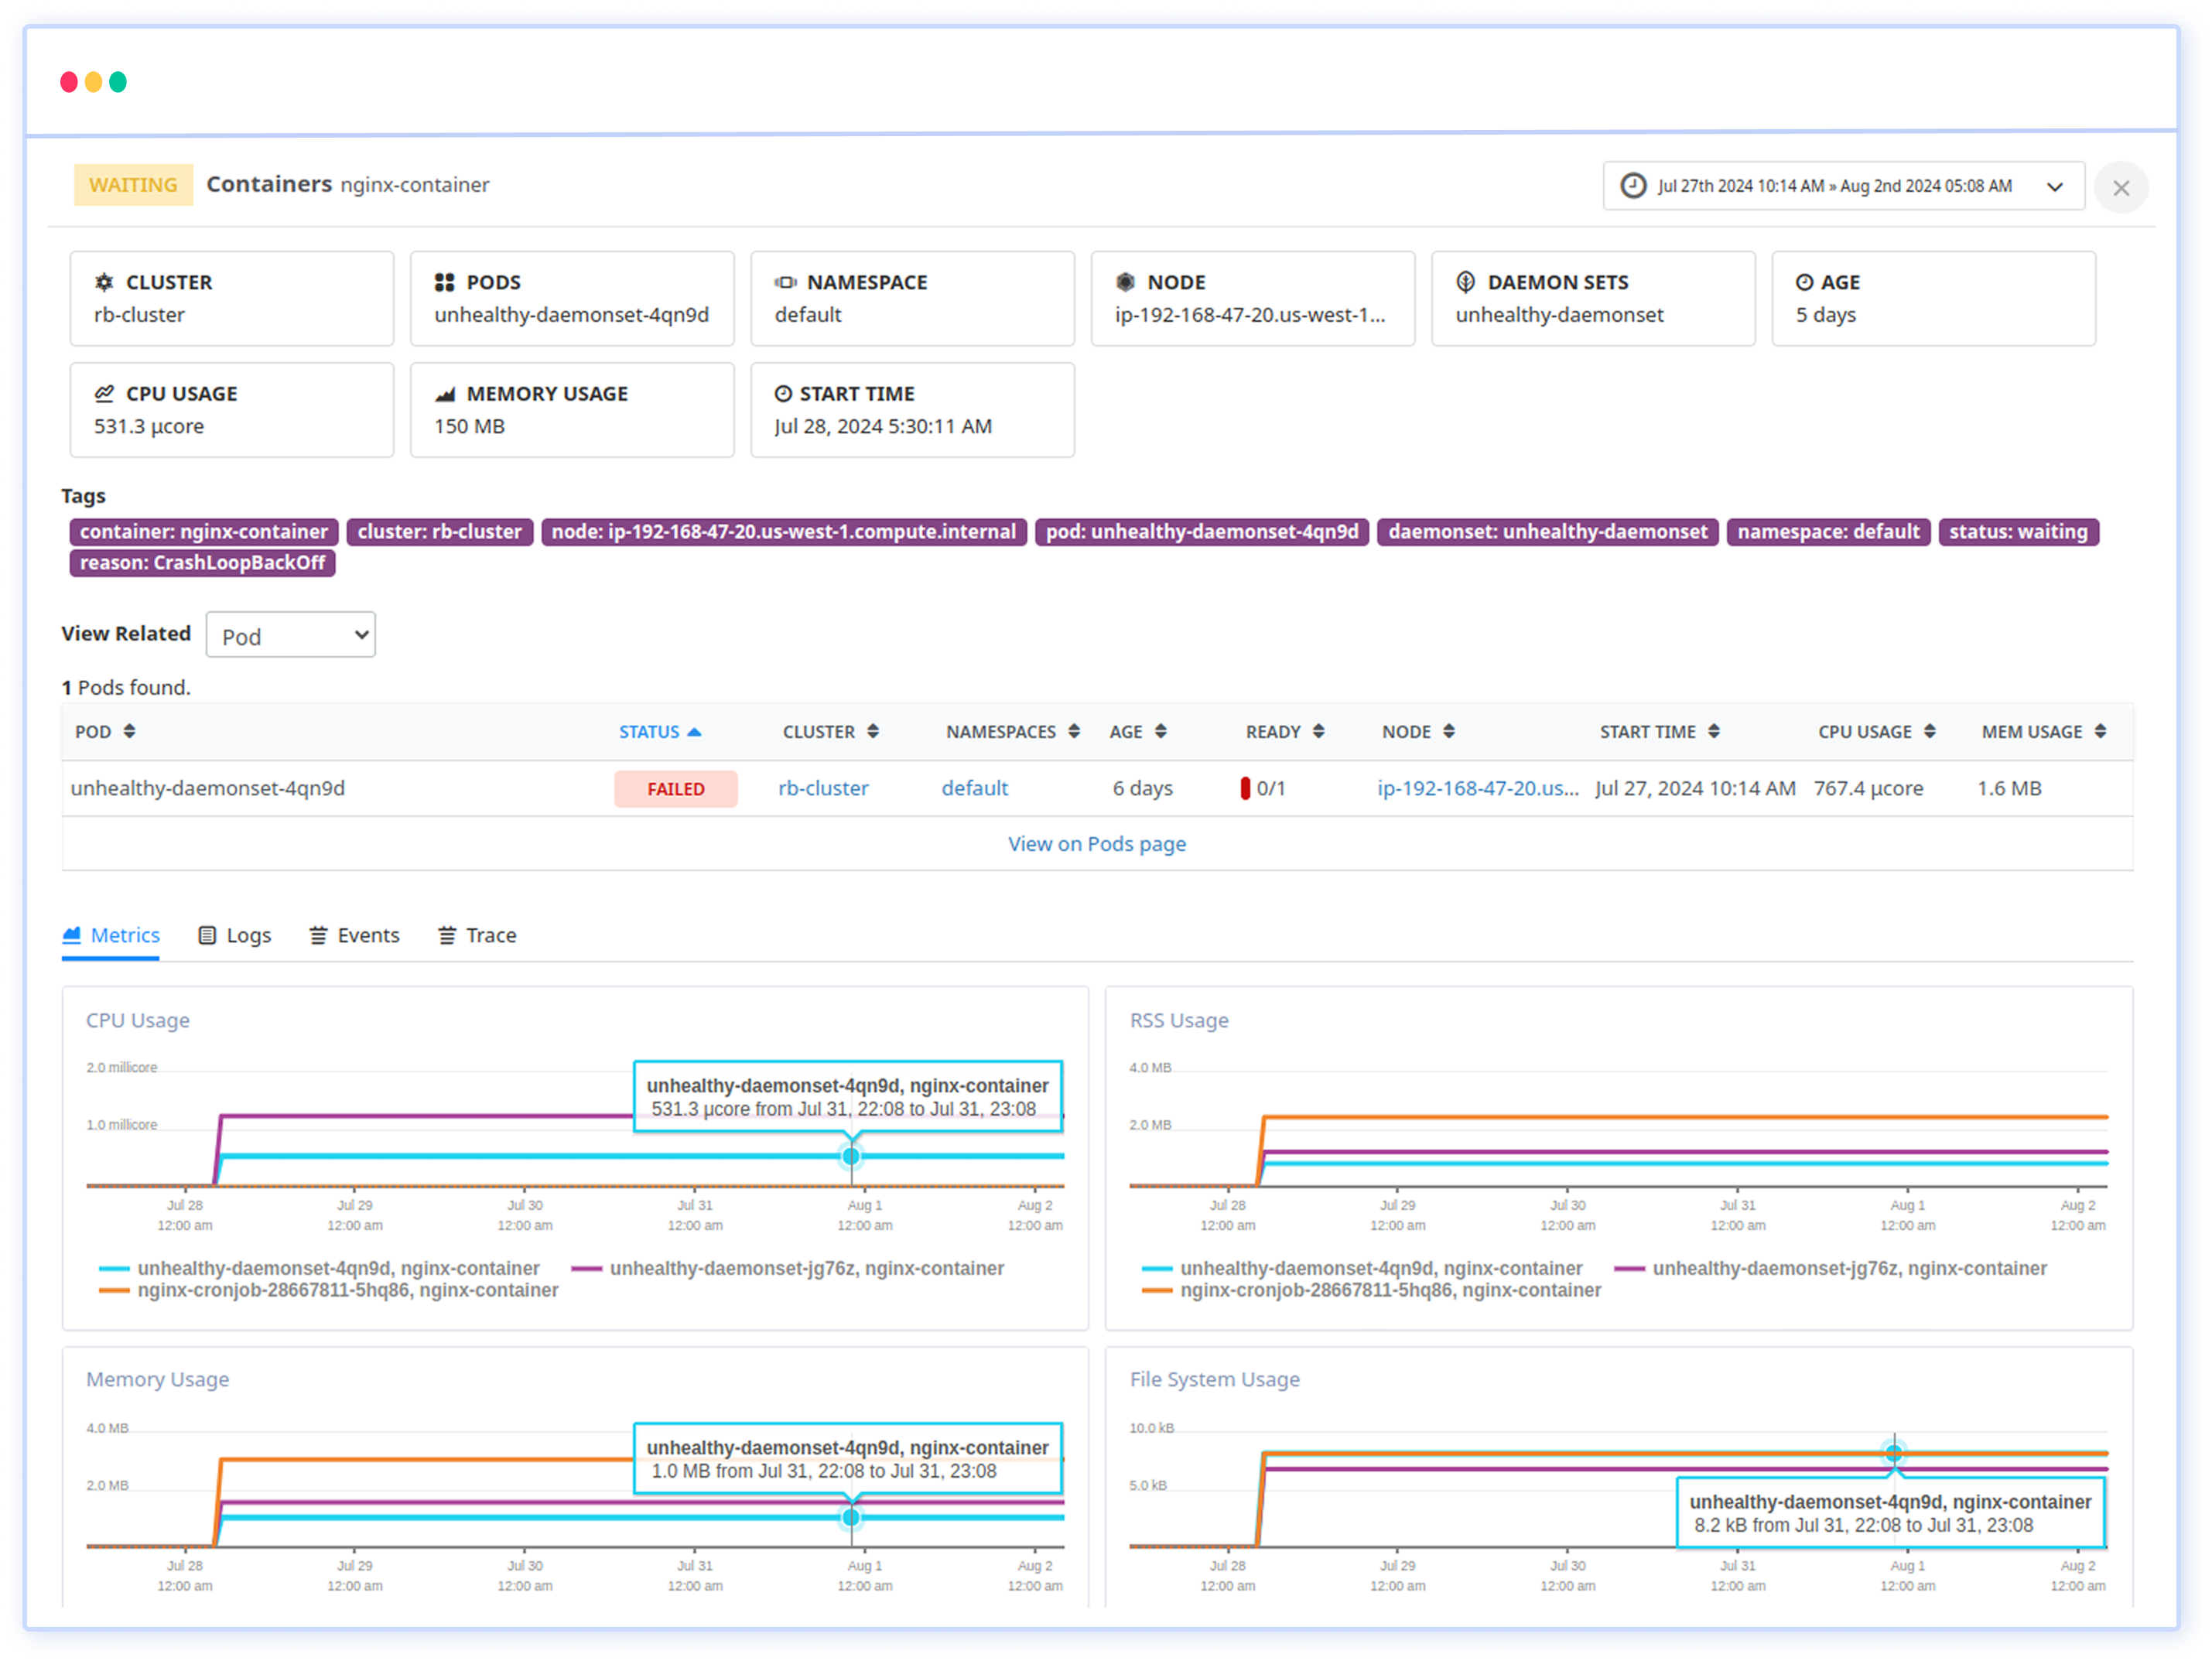
Container Monitoring
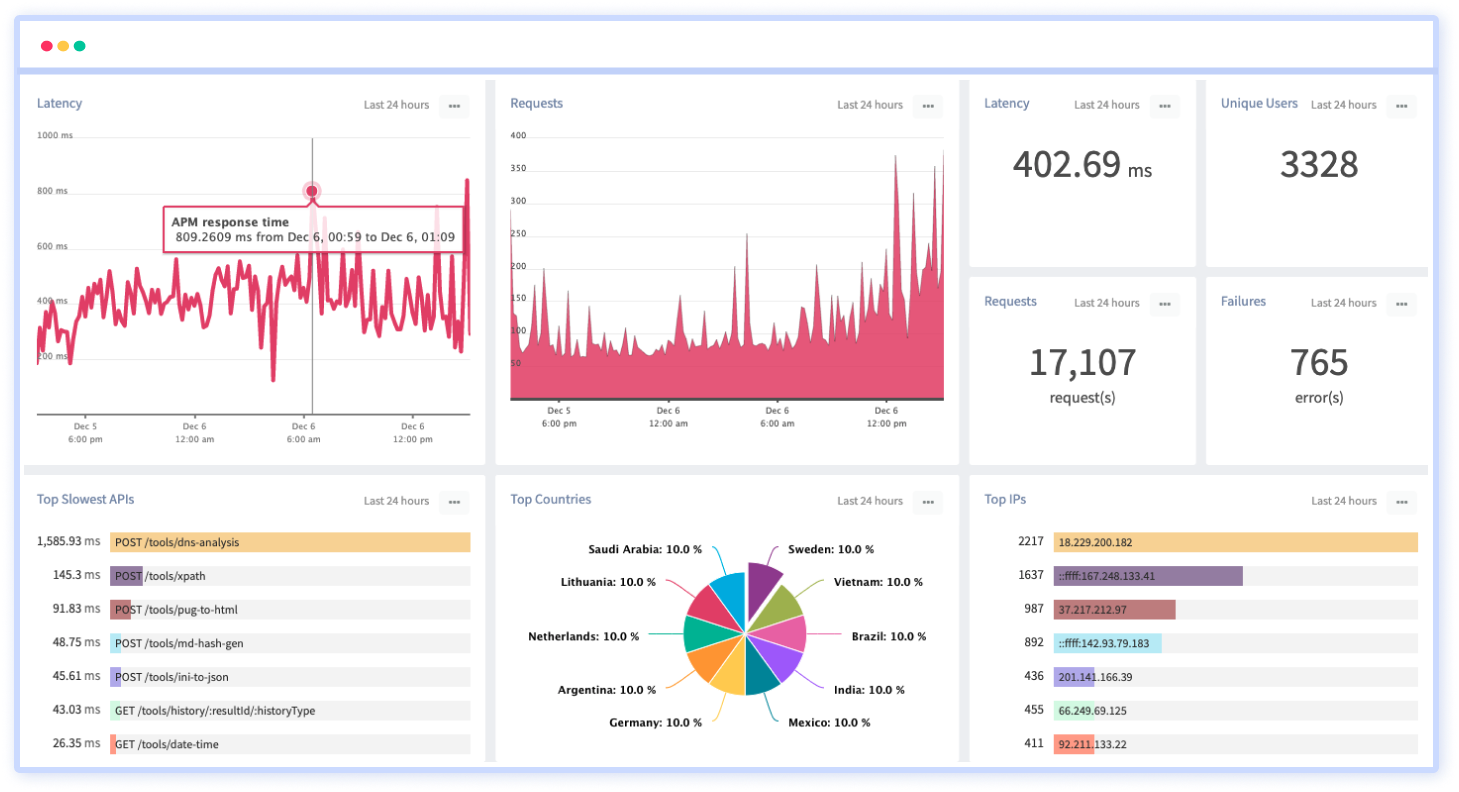
API Analytics
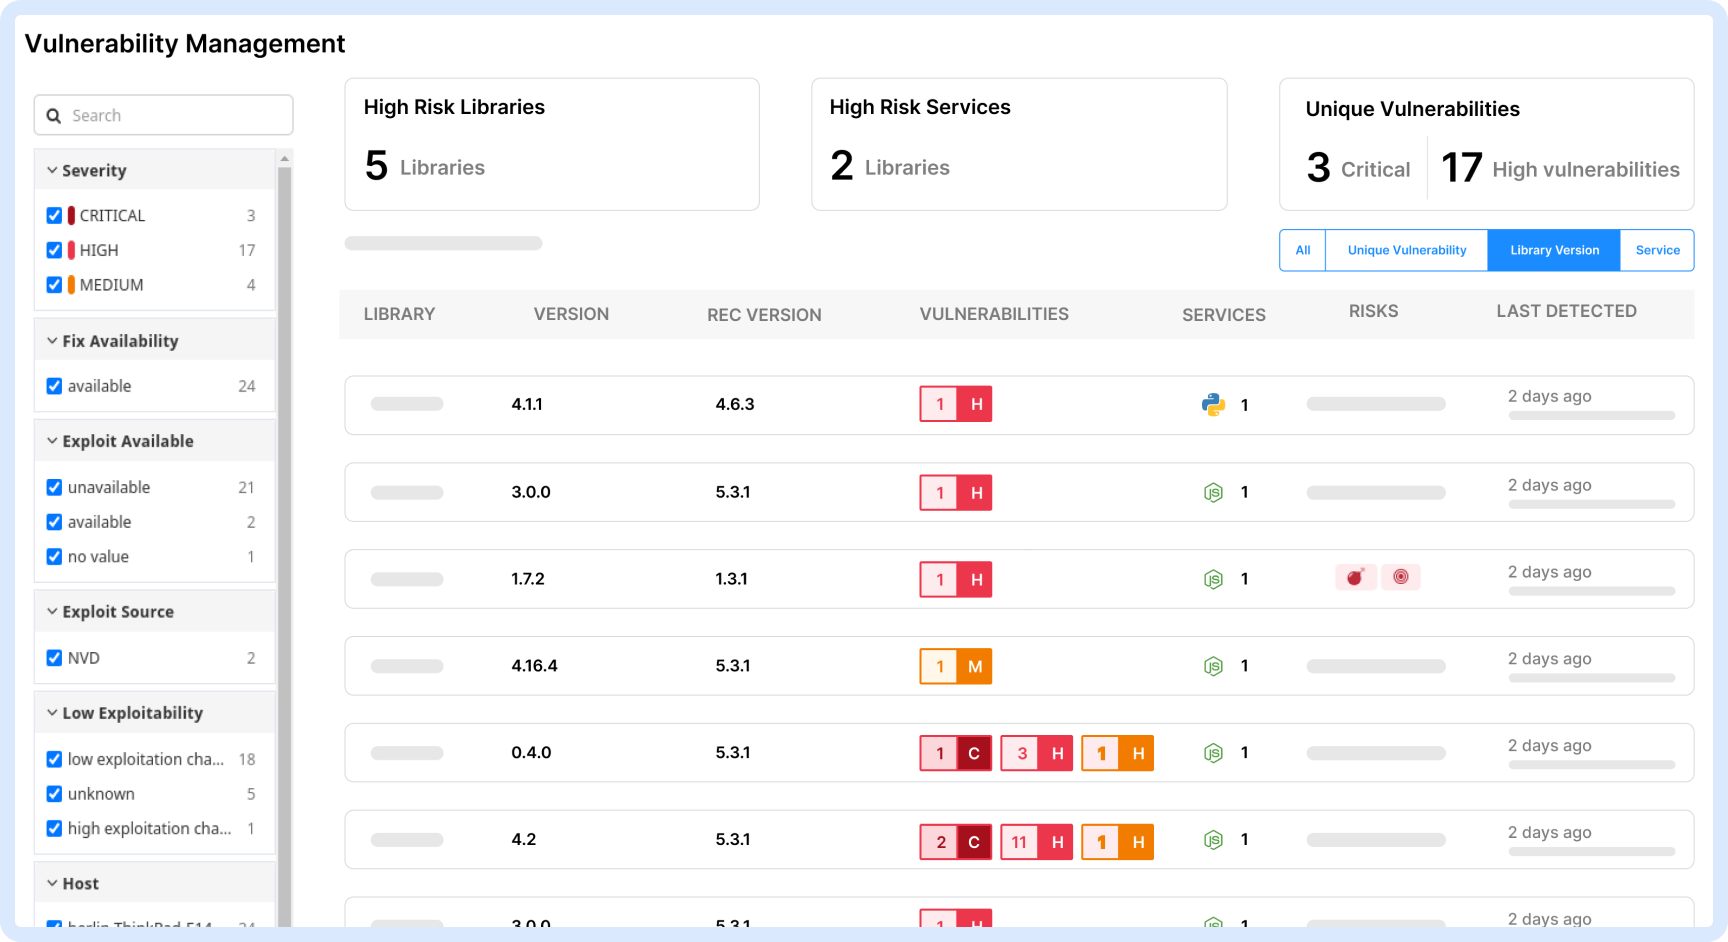
Vulnerability Management
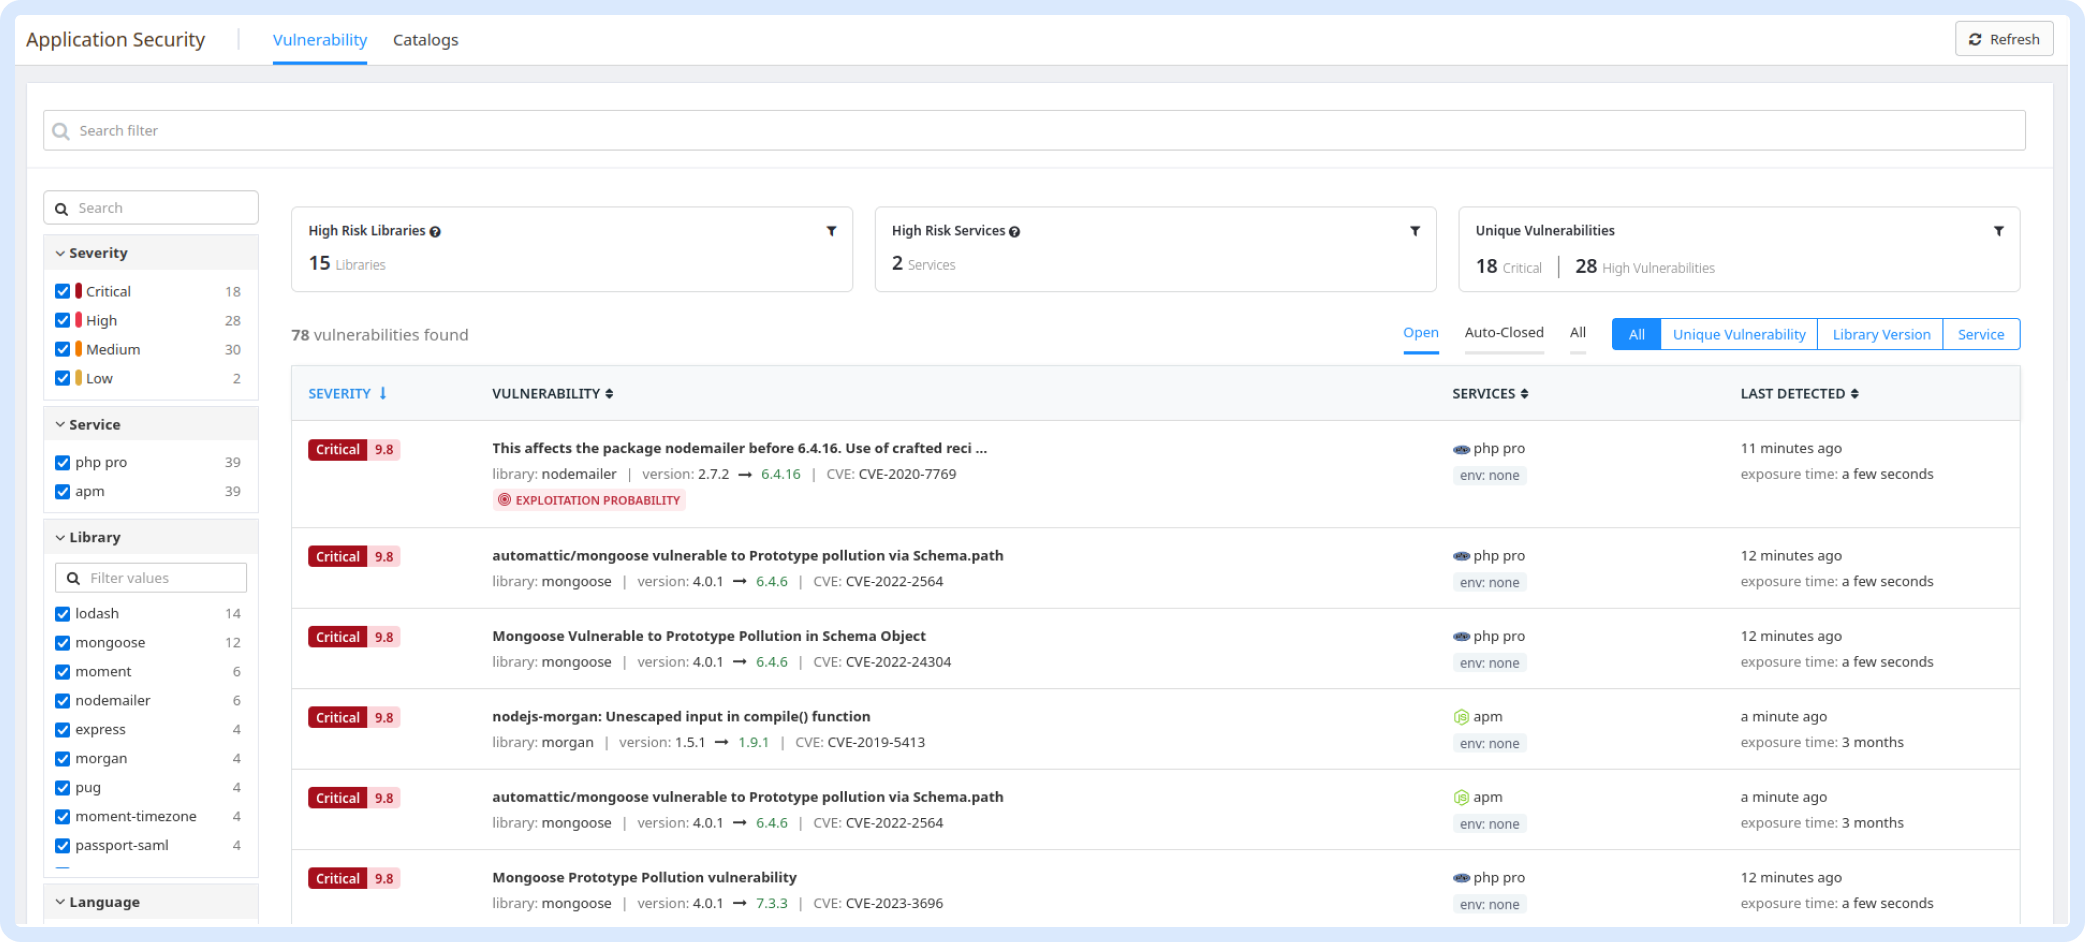
Application Security
 +1-760-465-2330


