Query Execution Analysis
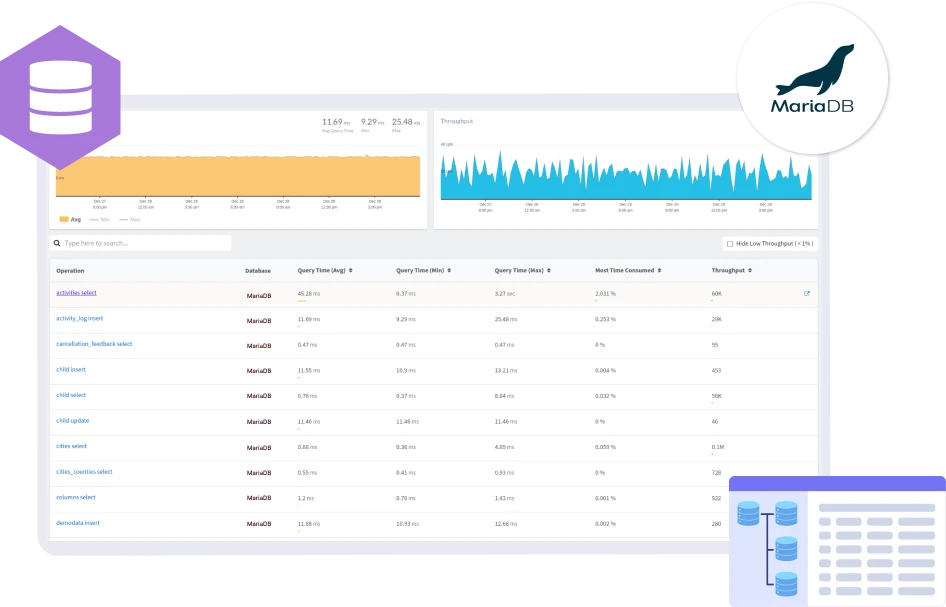
Analyzes slow queries and execution behavior specific to MariaDB query optimizer.
Boost MariaDB efficiency by fine-tuning queries, ensuring optimal performance without compromising your database's health.
Analyzes slow queries and execution behavior specific to MariaDB query optimizer.
Monitors thread pool activity affecting concurrent query processing.
Measures replication lag in MariaDB primary-replica configurations.
Tracks InnoDB and Aria engine behavior under transactional workloads.
Detects row and table locks impacting write throughput.
Monitors read/write latency and fsync operations.
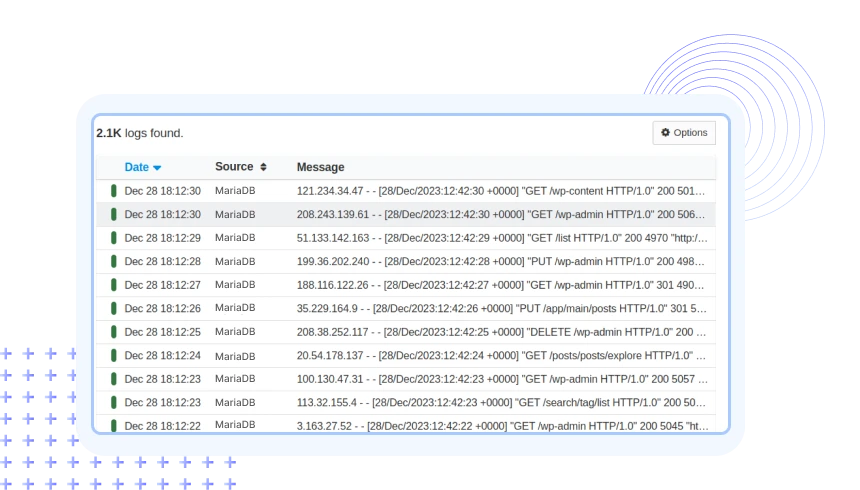
Surfaces MariaDB errors related to crashes and replication.
Tracks CPU and memory usage across MariaDB processes.
Expose costly operations, workload surges, and consistency risks early.
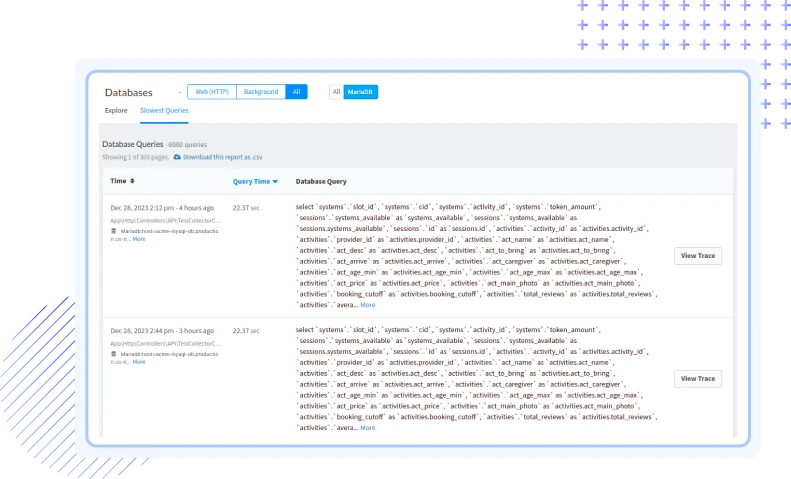
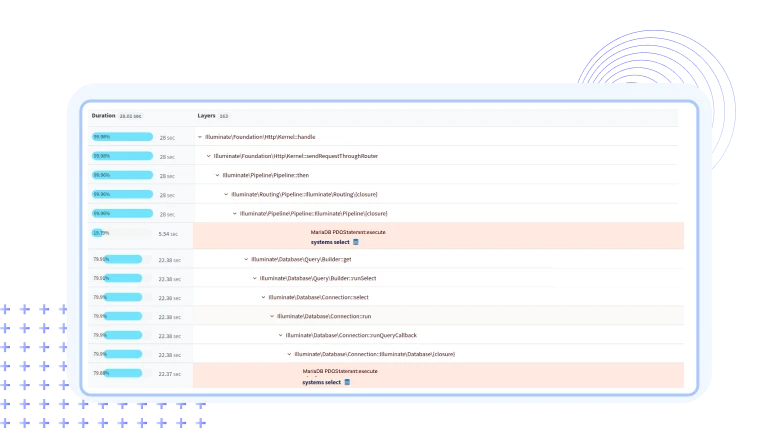
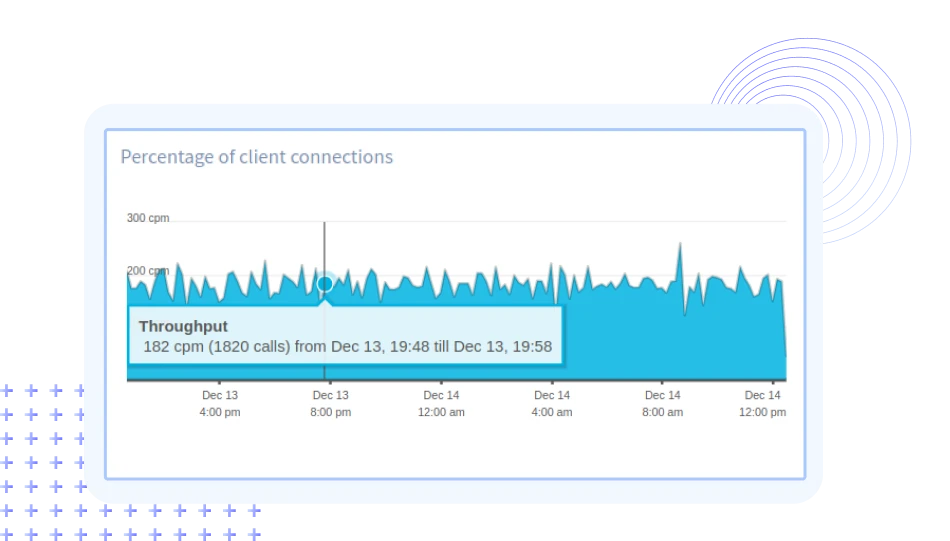
Atatus helps you identify inefficient SQL and optimizer decisions to reduce query latency.
Atatus provides visibility into thread pool behavior to maintain performance under heavy load.
Atatus monitors replica lag and sync issues to prevent data inconsistency.
Atatus tracks engine behavior to keep transactional workloads running smoothly.
Atatus detects lock contention early to avoid production slowdowns.
Atatus correlates database activity with system resources to plan scaling confidently.
Atatus adapts to how engineering teams work across development, operations, and reliability.
Debug errors and slow paths with the full context of what happened.
Atatus for developersTrack deployments and see how each release affects stability.
Atatus for DevOpsWatch latency and error rates to ship with less production risk.
Atatus for release engineersPricing, deployment, data and the agent. If something is missing, a person will answer it on a demo call.
MariaDB monitoring in Atatus refers to the process of using Atatus monitoring and observability tools to track and analyze the performance of MariaDB databases. It allows users to gain insights into database health, query performance, and other critical metrics to ensure optimal operation.
Atatus MariaDB Monitoring allows you to monitor various MariaDB metrics, including query execution time, database connections, cache hits and misses, replication lag, and server resource utilization. These metrics provide insights into database performance, helping you identify and address potential issues.
Atatus supports a wide range of popular databases, including but not limited to MySQL, MS SQL, PostgreSQL, MongoDB, Redis, Memcached, SQLite, and Aerospike. The platform provides integrations and pre-built dashboards tailored to each supported database, allowing users to monitor and analyze their database performance effectively. Whether your application relies on MySQL or a combination of different databases, Atatus provides a unified platform for effective monitoring and optimization.
Absolutely. Atatus provides detailed insights into MariaDB query performance, allowing you to identify slow queries along with the complete stack trace, analyze execution plans, and optimize database performance.
Yes, Atatus supports the monitoring of multiple MariaDB instances. You can install the Atatus agent on each server running MariaDB, and the Atatus platform will aggregate and display data for all monitored instances in a centralized dashboard.
To set up MariaDB monitoring in Atatus, you need to install the Atatus Agent on your MariaDB server and configure the MariaDB integration. Atatus provides detailed documentation and step-by-step guides to assist you in the setup process.
Yes, Atatus allows you to set up custom alerts based on specific conditions or thresholds for MariaDB metrics. This ensures that you are notified promptly when there are issues or performance deviations in your MariaDB database.
Data retention for MariaDB monitoring is set to 7 days by default. This can be changed in your billing settings to 60 or 90 days. Contact our Customer Success Representative if you require a longer retention period.


