Command Execution Latency
Measures execution latency of Redis commands to detect blocking operations and long-running scripts.
Take control of your Redis environment, optimize performance, and ensure the reliability of your critical applications

Measures execution latency of Redis commands to detect blocking operations and long-running scripts.
Tracks memory usage patterns and fragmentation ratios affecting Redis performance under high load.
Monitors key eviction frequency and TTL expiry behavior driven by Redis maxmemory policies.
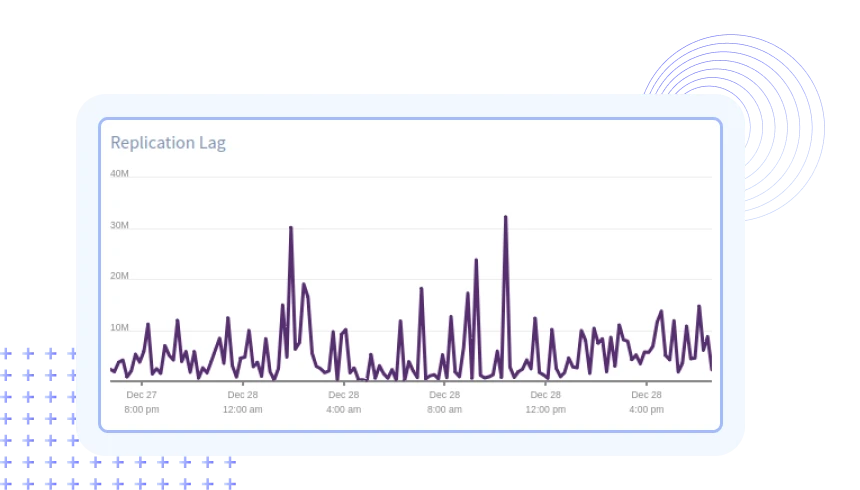
Observes master-replica synchronization status and partial resync behavior.
Tracks RDB snapshot duration and AOF rewrite activity impacting write throughput.
Monitors connected clients, blocked clients, and output buffer usage.
Surfaces Redis logs related to persistence failures, memory exhaustion, and replication issues.
Tracks Redis CPU utilization under single-threaded, high-throughput workloads.
Track throughput, latency, key growth, and replication behavior at scale.
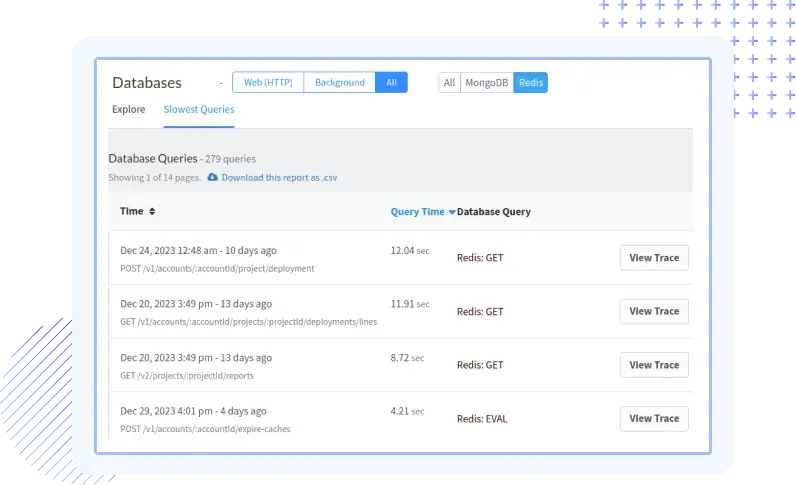
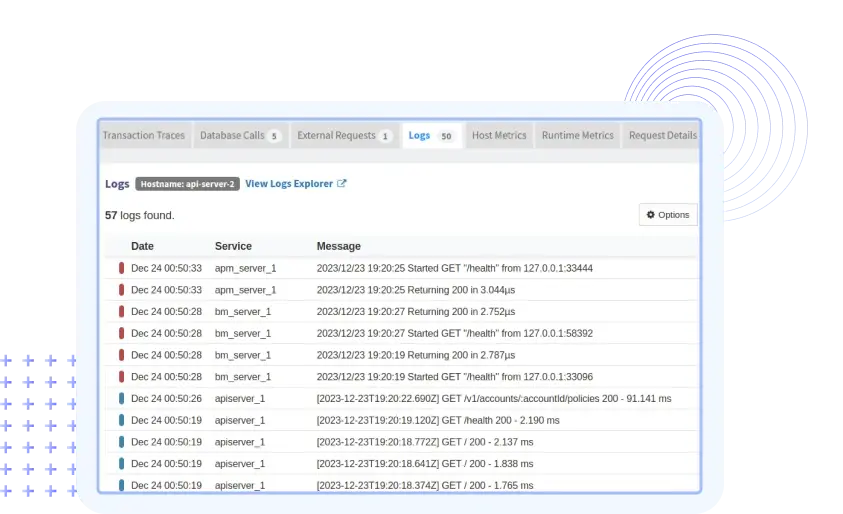
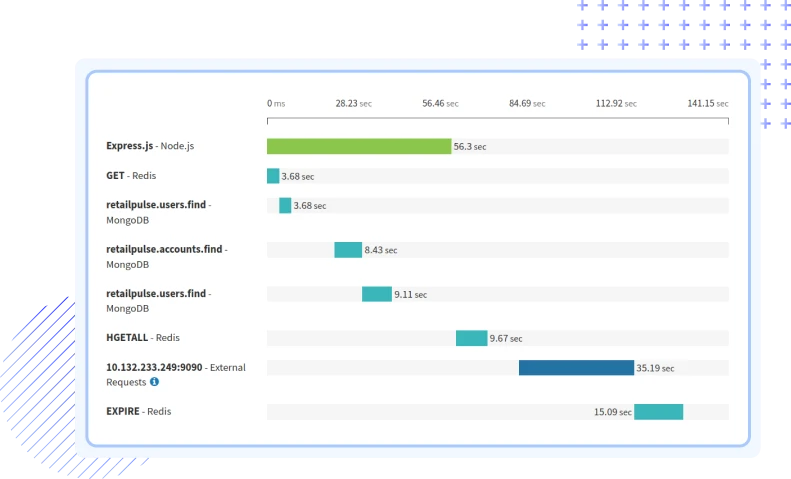
Track command latency, memory allocation behavior, evictions, and persistence operations for accurate visibility.
Monitor CPU usage and event loop saturation to uncover command-level bottlenecks.
Observe master-replica sync progress and replication offset drift to maintain consistency.
Track fragmentation ratios, RSS growth, and eviction frequency to prevent cache instability.
Correlate RDB snapshots and AOF rewrites with IO spikes and performance drops.
Analyze connected and blocked clients to understand traffic patterns and access issues.
Atatus adapts to how engineering teams work across development, operations, and reliability.
Debug errors and slow paths with the full context of what happened.
Atatus for developersTrack deployments and see how each release affects stability.
Atatus for DevOpsWatch latency and error rates to ship with less production risk.
Atatus for release engineersPricing, deployment, data and the agent. If something is missing, a person will answer it on a demo call.
Redis monitoring involves the continuous observation and analysis of the performance metrics and key indicators of a Redis database. It includes tracking factors such as memory usage, CPU utilization, latency, and other relevant metrics to ensure the efficient and reliable operation of Redis.
Atatus offers real-time insights into the performance of your Redis infrastructure, helping you identify issues, optimize resource usage, and ensure the overall health of your Redis clusters. It provides metrics, traces, and logs for comprehensive monitoring.
Key metrics to monitor in Redis include:
Atatus supports a wide range of popular databases, including but not limited to MySQL, MS SQL, PostgreSQL, MongoDB, MariaDB, Memcached, SQLite, and Aerospike. The platform provides integrations and pre-built dashboards tailored to each supported database, allowing users to monitor and analyze their database performance effectively. Whether your application relies on MySQL or a combination of different databases, Atatus provides a unified platform for effective monitoring and optimization.
The frequency of checking Redis metrics depends on the specific requirements of your application and the criticality of your Redis deployment. However, regular monitoring, especially during peak usage periods, is recommended to catch potential issues early.
Yes, Atatus supports distributed tracing for Redis. This allows you to trace requests across different components of your system, providing a holistic view of performance and identifying bottlenecks.
Atatus provides log management capabilities, allowing you to collect, aggregate, and analyze Redis logs through its Logs Monitoring tool. You can set up log-based metrics and alerts to gain deeper insights into the behavior of your Redis instances.
Yes, Atatus allows you to set up alerts based on Redis metrics. You can define thresholds and conditions for alerting, and Atatus will notify you when these thresholds are breached. This helps in proactively addressing potential issues.
Data retention for Redis monitoring is set to 7 days by default. This can be changed in your billing settings to 60 or 90 days. Contact our Customer Success Representative if you require a longer retention period.


