Cache Hit & Miss Analysis
Tracks cache hit ratio, miss rates, and key lookups to identify ineffective caching patterns and unnecessary backend load.
Take control of your Memcached environment, optimize performance, and ensure the reliability of your critical applications

Tracks cache hit ratio, miss rates, and key lookups to identify ineffective caching patterns and unnecessary backend load.
Monitors memory usage, slab allocation, and eviction rates to detect memory pressure and suboptimal cache sizing.
Analyzes item TTLs, expired keys, and premature evictions to understand cache churn and data freshness issues.
Tracks active connections, request throughput, and command rates to identify traffic spikes and concurrency stress.
Measures get/set operation latency to detect network delays, overloaded nodes, or degraded cache performance.
Examines slab class distribution and memory fragmentation to uncover inefficient memory allocation patterns.
Surfaces failed commands, connection errors, and node unavailability events affecting cache reliability.
Tracks per-node memory, traffic distribution, and uptime metrics to support scaling decisions and capacity planning.
From real-time throughput and memory behavior to cache effectiveness and connection health, everything you need to optimize caching performance at scale.
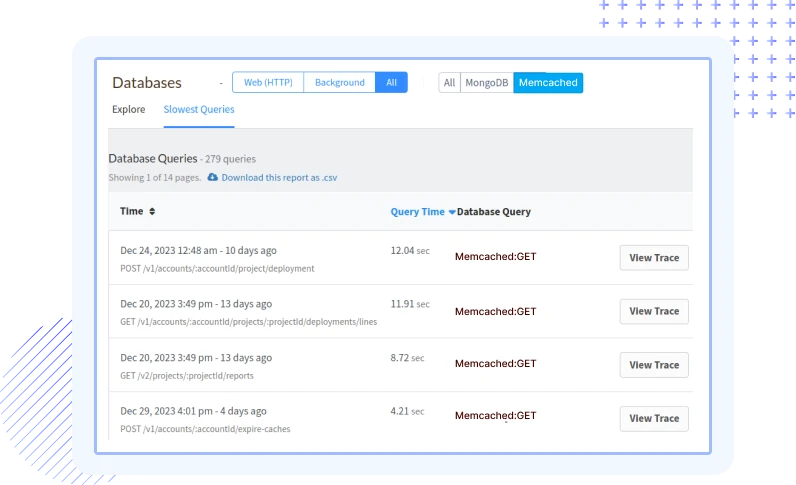
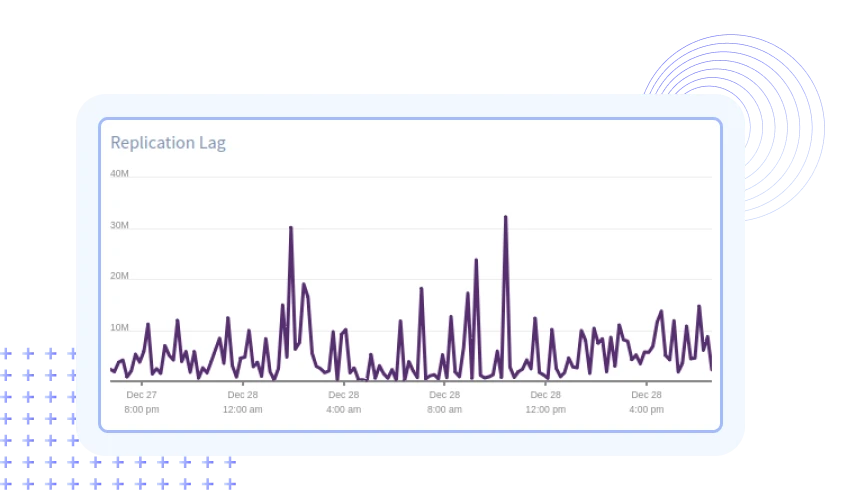
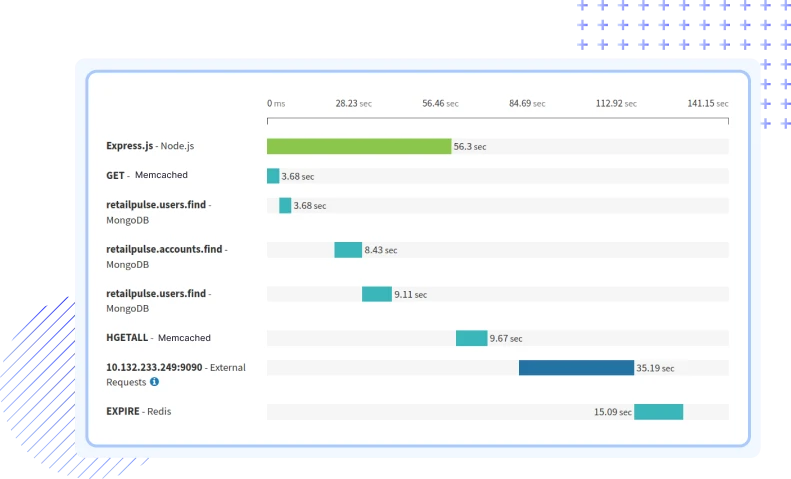
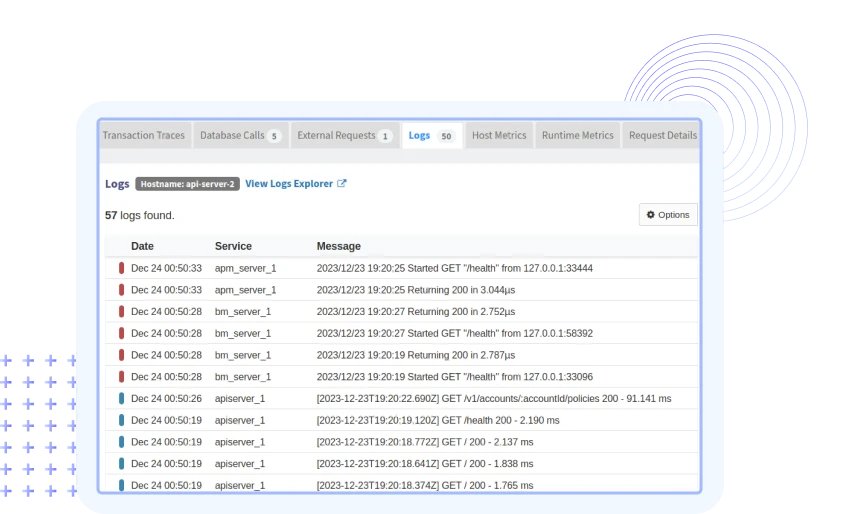
Track cache hit ratios, evictions, slab usage, connections, and command rates to reflect real production behavior.
Surface cache misses, poor key access patterns, and high eviction rates to improve caching strategy.
Monitor slab allocation, fragmentation, and memory pressure to prevent wasted capacity.
Measure get/set latency and throughput to detect overloaded nodes and slow responses.
Connect cache activity with CPU, memory, and network metrics to isolate root causes.
Collect performance data without adding overhead or affecting high-throughput workloads.
Atatus adapts to how engineering teams work across development, operations, and reliability.
Debug errors and slow paths with the full context of what happened.
Atatus for developersTrack deployments and see how each release affects stability.
Atatus for DevOpsWatch latency and error rates to ship with less production risk.
Atatus for release engineersPricing, deployment, data and the agent. If something is missing, a person will answer it on a demo call.
Memcached is an open-source, high-performance distributed memory caching system used to speed up dynamic web applications by alleviating database load. It stores key-value pairs in memory, making data retrieval faster compared to traditional database queries.
Atatus provides comprehensive monitoring solutions, allowing you to track key performance metrics, troubleshoot issues, and optimize the performance of your Memcached infrastructure. It offers real-time insights and alerts to ensure the availability and reliability of your caching layer.
To set up Memcached monitoring with Atatus, you typically need to install the Atatus Agent on your Memcached servers. The agent collects relevant metrics and sends them to the Atatus platform, where you can visualize and analyze the data. Detailed setup instructions can be found in Atatus's documentation.
Important metrics to monitor in Memcached include:
Atatus supports a wide range of popular databases, including but not limited to MySQL, MS SQL, PostgreSQL, MongoDB, Redis, MariaDB, SQLite, and Aerospike. The platform provides integrations and pre-built dashboards tailored to each supported database, allowing users to monitor and analyze their database performance effectively. Whether your application relies on MySQL or a combination of different databases, Atatus provides a unified platform for effective monitoring and optimization.
Yes, Atatus supports distributed tracing, enabling you to trace requests across your entire infrastructure. This helps in identifying bottlenecks and understanding the flow of requests through the Memcached caching layer.
Atatus provides log management capabilities, allowing you to aggregate, search, and analyze logs from Memcached or other sources through its Logs Monitoring tool. You can use the Atatus Agent to collect logs and gain deeper insights into your infrastructure.
Yes, Atatus allows you to set up custom alerts based on specific thresholds and conditions. You can receive notifications via email, Slack, PagerDuty, or other integrations when critical metrics go beyond acceptable limits.
Data retention for Memcached monitoring is set to 7 days by default. This can be changed in your billing settings to 60 or 90 days. Contact our Customer Success Representative if you require a longer retention period.


