Query Planner Insights
Analyzes MongoDB query execution stages, index usage, and collection scans to identify inefficient document access patterns.
Make data-driven decisions, optimize MongoDB performance, and ensure the security and resilience of your MongoDB environment.
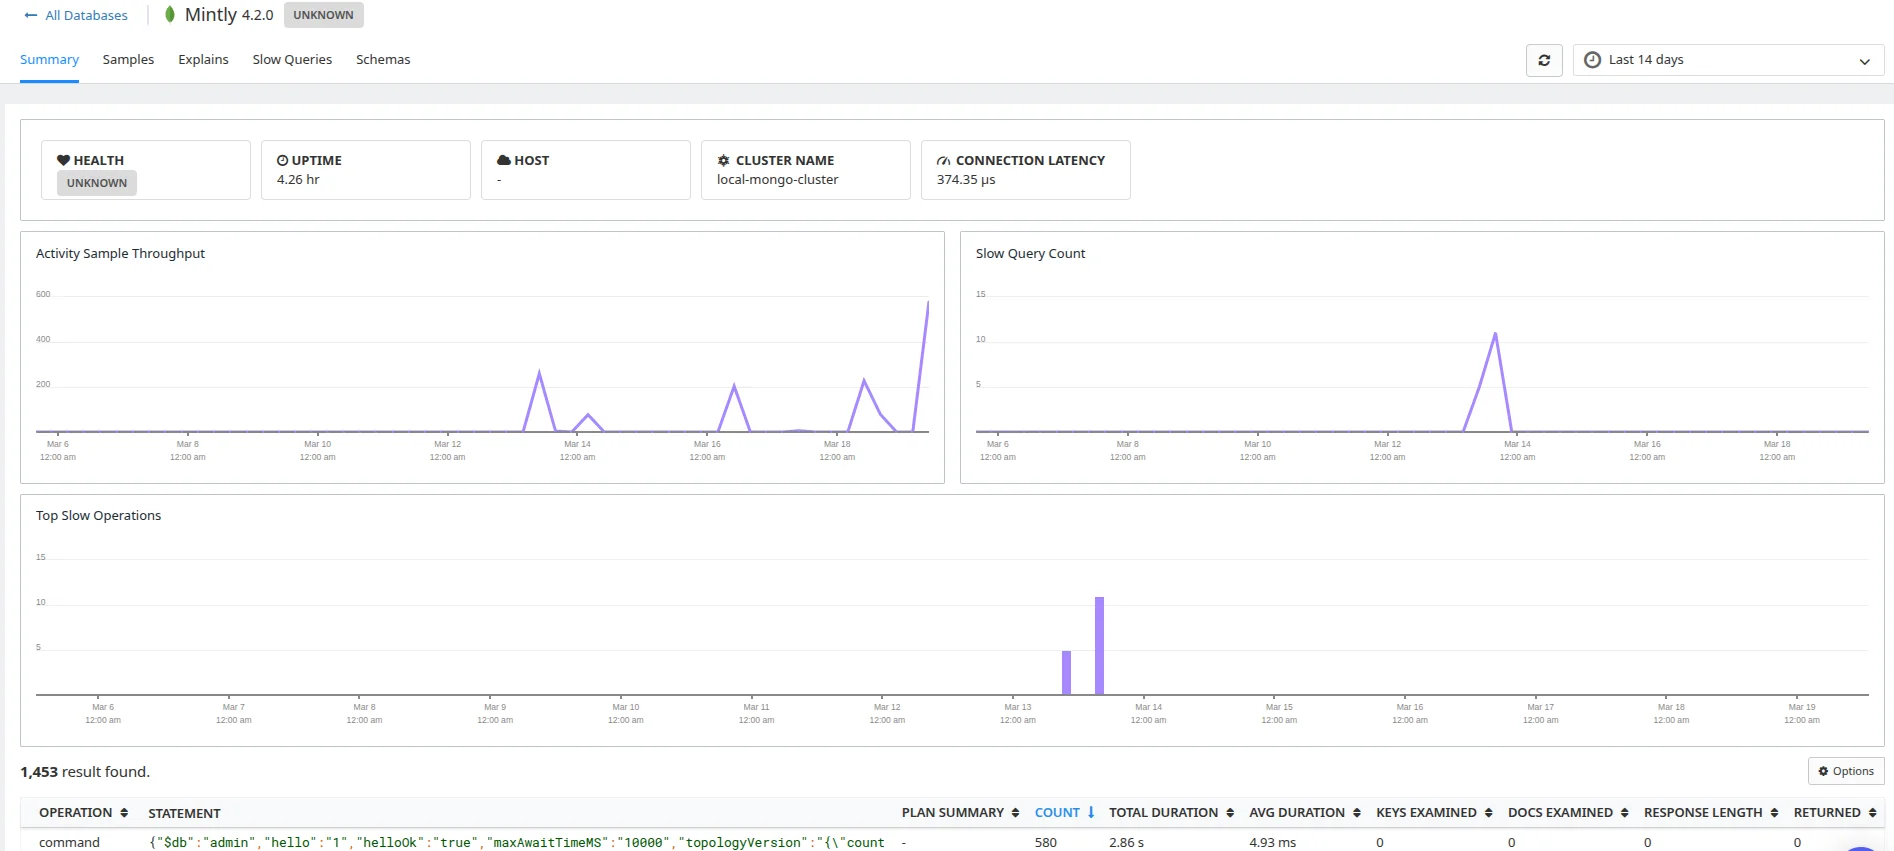
Analyzes MongoDB query execution stages, index usage, and collection scans to identify inefficient document access patterns.
Monitors client connections, cursor usage, and socket limits to detect connection saturation across MongoDB nodes.
Tracks primary elections, replication lag, and oplog window size to identify replica set health risks.
Observes global, database, and collection-level locks that impact concurrent read and write operations.
Measures working set size and cache residency to detect memory pressure affecting read performance.
Monitors WiredTiger disk usage, checkpoint frequency, and compaction impact on write latency.
Captures MongoDB logs related to replication failures, rollbacks, and storage engine errors.
Tracks read and write operation rates to understand workload distribution and peak usage periods.
Measures the number of operations (reads, writes, updates, and deletes) processed per second. Sudden drops or spikes may indicate workload imbalances or performance bottlenecks within your MongoDB cluster.
Tracks the time taken to execute database queries, focusing on slow queries. High execution times often point to inefficient query structures or missing indexes that impact application performance.
Monitors the delay between the primary and secondary nodes in a MongoDB replica set. Significant lag can compromise data consistency and affect failover mechanisms in distributed systems.
Measures the amount of memory actively used by MongoDB processes. High memory consumption may lead to increased disk I/O and degraded performance if not optimized properly.
Tracks the number of active client connections to the MongoDB instance. Exceeding connection limits can cause service interruptions and affect database accessibility during peak loads.
Monitors the size and frequency of logs generated by a container. Sudden spikes in log volume can signal errors or abnormal behavior in the application.
Optimize document access patterns while keeping replication fast and reliable.
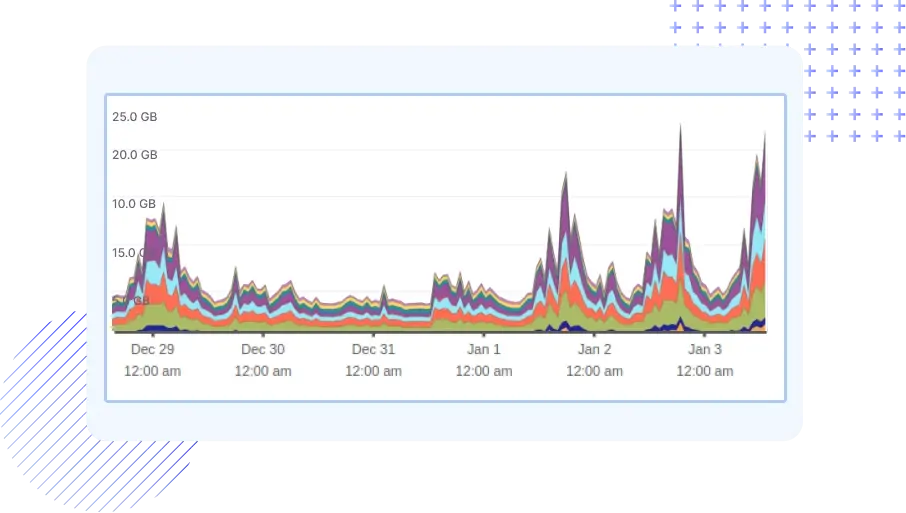
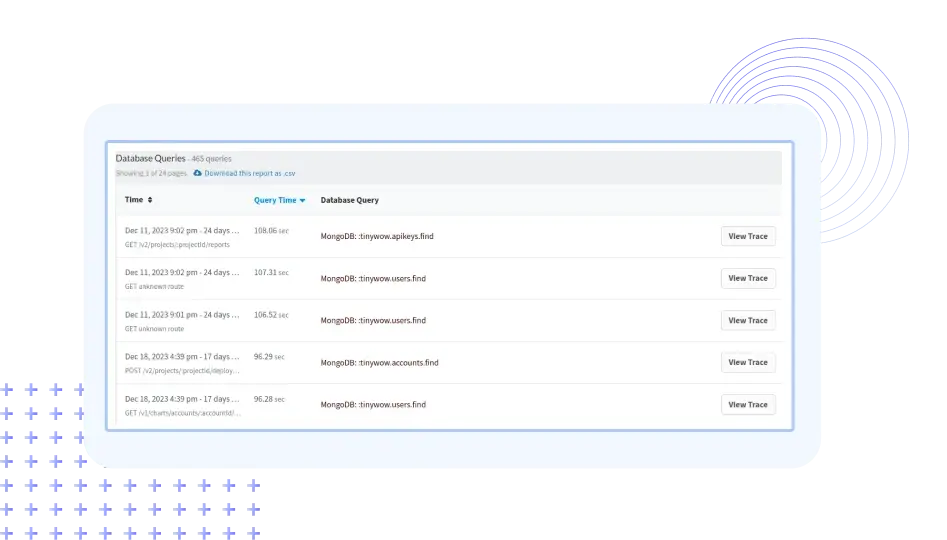
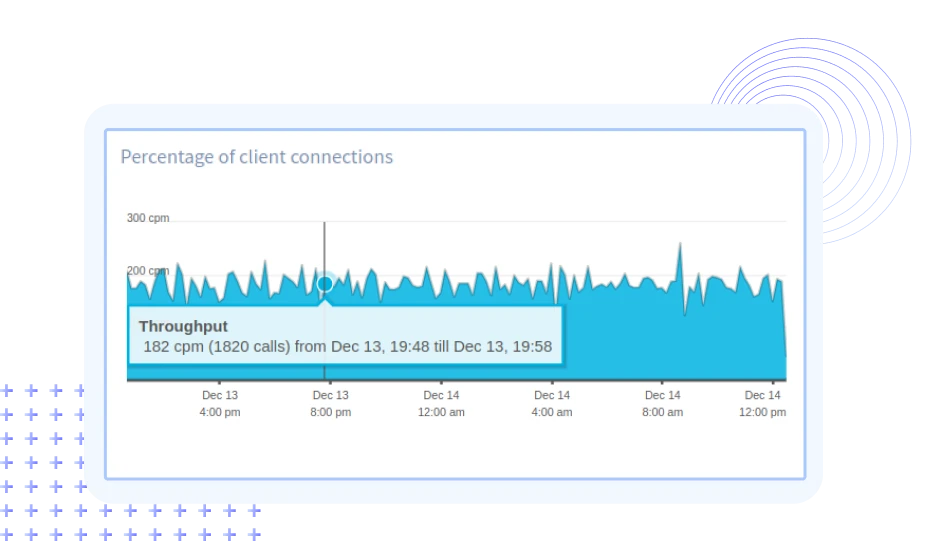
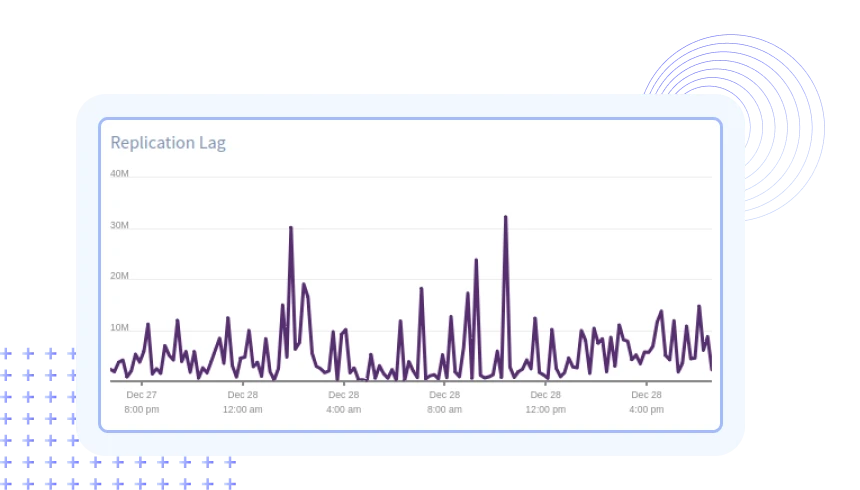
Track collection scans, index usage, cursor behavior, and query execution stages for accurate performance tuning.
Monitor primary elections, oplog lag, and node state changes to ensure high availability.
Surface global, database, and collection-level locks to uncover write bottlenecks.
Analyze working set size and cache residency to prevent slow reads.
Observe WiredTiger activity, checkpointing, compaction, and disk usage continuously.
Track read and write operation rates to understand traffic patterns and scaling needs.
Atatus adapts to how engineering teams work across development, operations, and reliability.
Debug errors and slow paths with the full context of what happened.
Atatus for developersTrack deployments and see how each release affects stability.
Atatus for DevOpsWatch latency and error rates to ship with less production risk.
Atatus for release engineersPricing, deployment, data and the agent. If something is missing, a person will answer it on a demo call.
MongoDB monitoring refers to the process of observing and collecting data on the performance, health, and activities of MongoDB databases. It is essential for identifying issues, optimizing performance, and ensuring the overall stability of MongoDB deployments.
Key MongoDB metrics to monitor in Atatus include:
Atatus supports a wide range of popular databases, including but not limited to MySQL, MS SQL, PostgreSQL, MariaDB, Memcached, Redis, SQLite, and Aerospike. The platform provides integrations and pre-built dashboards tailored to each supported database, allowing users to monitor and analyze their database performance effectively. Whether your application relies on MySQL or a combination of different databases, Atatus provides a unified platform for effective monitoring and optimization.
Atatus empowers users with tracing capabilities to actively monitor MongoDB queries and performance. By seamlessly integrating with Application Performance Monitoring (APM), users can correlate data and retrieve comprehensive stack trace information. This integration enables users to actively investigate MongoDB queries, pinpoint slow queries, analyze their impact, and proactively optimize database performance.
Yes, Atatus supports monitoring MongoDB sharded clusters. It provides insights into the performance of individual shards, as well as the overall health of the sharded cluster.
Yes, Atatus supports Logs Monitoring for MongoDB. You can configure Atatus to collect and analyze MongoDB logs, enabling you to troubleshoot issues, track errors, and gain insights into the database's behavior.
Yes, Atatus allows you to set up custom alerts based on specific conditions or thresholds for MongoDB metrics. This ensures that you are notified promptly when there are issues or performance deviations in your MongoDB database.
Data retention for MongoDB monitoring is set to 7 days by default. This can be changed in your billing settings to 60 or 90 days. Contact our Customer Success Representative if you require a longer retention period.


