Statement Execution Time
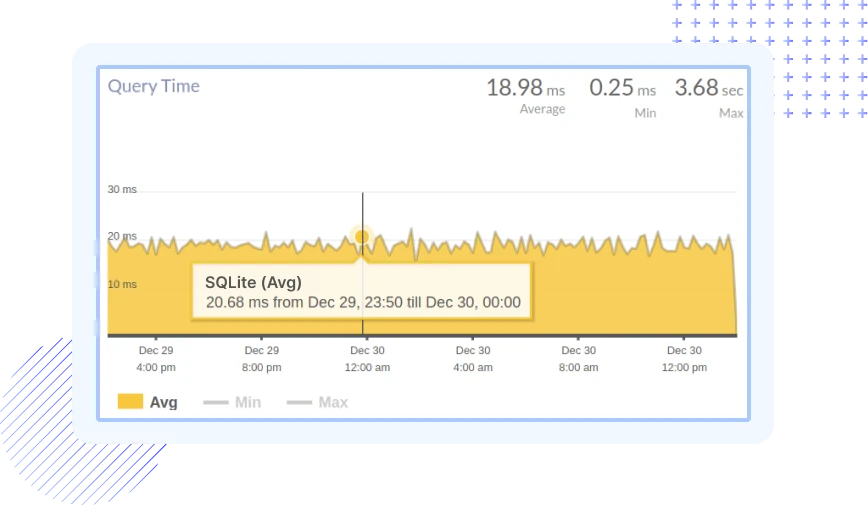
Tracks execution latency of SQL statements within embedded SQLite environments.
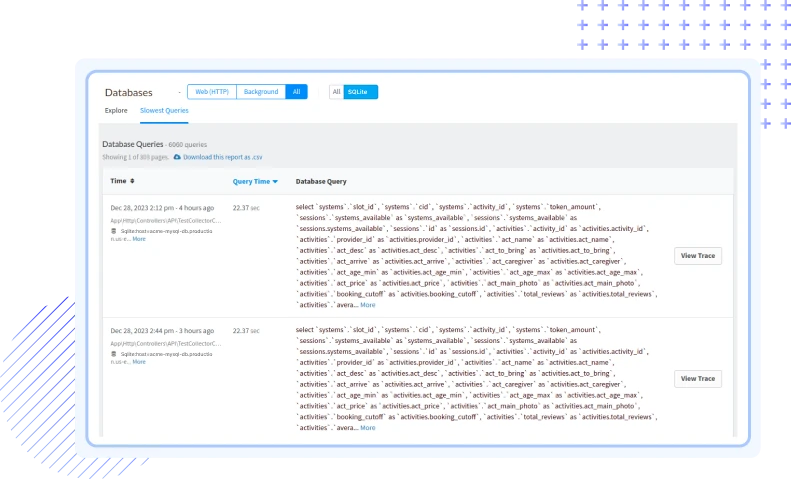
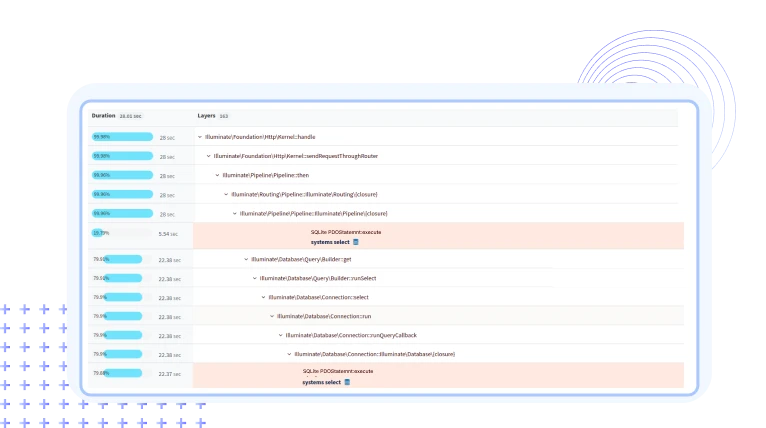
Detect and resolve sluggish SQLite queries in your requests, along with transaction traces, to gather actionable insights for optimized functionality.

Tracks execution latency of SQL statements within embedded SQLite environments.
Monitors database file locking conflicts affecting concurrent read and write access.
Analyzes journal and WAL file writes impacting disk IO performance.
Tracks file size growth caused by insert-heavy or append-only workloads.
Surfaces SQLite errors related to corruption and filesystem issues.
Monitors commit frequency affecting durability and synchronization overhead.
Analyzes page cache efficiency impacting read performance.
Tracks read and write latency originating from filesystem interactions.
Catch slow local operations, locking issues, and storage pressure as apps scale.
Atatus brings production-grade visibility into SQLite inside applications where traditional tools fall short.
Atatus exposes database file lock contention to prevent concurrency slowdowns.
Atatus tracks journal and WAL activity to reduce disk IO overhead and improve performance.
Atatus analyzes commit patterns and transaction duration to balance durability and speed.
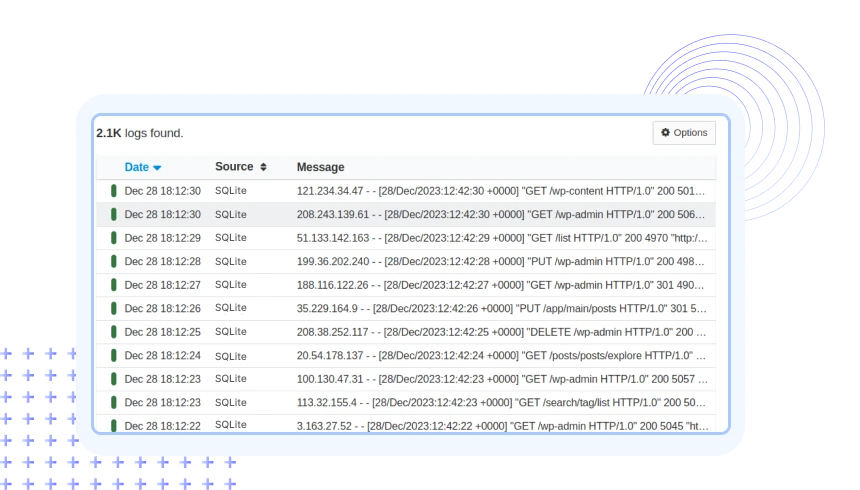
Atatus captures SQLite filesystem errors early to protect data integrity.
Atatus correlates filesystem latency with SQLite operations to pinpoint performance bottlenecks faster.
Atatus adapts to how engineering teams work across development, operations, and reliability.
Debug errors and slow paths with the full context of what happened.
Atatus for developersTrack deployments and see how each release affects stability.
Atatus for DevOpsWatch latency and error rates to ship with less production risk.
Atatus for release engineersPricing, deployment, data and the agent. If something is missing, a person will answer it on a demo call.
SQLite monitoring involves the systematic observation and analysis of various performance metrics and parameters within a SQLite database. It is crucial for ensuring the optimal performance, availability, and reliability of SQLite instances. Monitoring allows you to detect and address potential issues, optimize resource usage, and maintain the overall health of your SQLite databases, which are fundamental components of many web applications.
Monitoring SQLite with Atatus offers a comprehensive solution for gaining deep insights into the performance of your SQLite databases. Atatus provides real-time visibility, customizable dashboards, and intelligent alerting capabilities, allowing you to proactively manage and optimize SQLite instances. With Atatus, you can ensure high availability, quickly troubleshoot issues, and streamline the performance of your SQLite-powered applications.
Important SQLite metrics to monitor include:
Atatus supports a wide range of popular databases, including but not limited to MySQL, MS SQL, PostgreSQL, MongoDB, MariaDB, Redis, Memcached, SQLite, and Aerospike. The platform provides integrations and pre-built dashboards tailored to each supported database, allowing users to monitor and analyze their database performance effectively. Whether your application relies on MySQL or a combination of different databases, Atatus provides a unified platform for effective monitoring and optimization.
Atatus provides Query Performance Monitoring, allowing you to identify slow queries, view query plans, and assess overall query performance. With this information, you can optimize queries for better database efficiency.
Yes, Atatus is designed to monitor SQLite databases in both traditional and distributed environments. It supports monitoring across on-premises, cloud, and hybrid infrastructure, providing a unified view of your SQLite performance regardless of the deployment model.
Atatus supports various notification channels, including email, Slack, PagerDuty, and others. You can configure alerting policies with specific thresholds and conditions to receive timely notifications when SQLite metrics deviate from expected values.
Data retention for SQLite monitoring is set to 7 days by default. This can be changed in your billing settings to 60 or 90 days. Contact our Customer Success Representative if you require a longer retention period.


