Introducing .NET monitoring
Released on: July 2022Recently we launched .NET monitoring, where you can keep track and detect the performance bottlenecks in your entire application under a single dashboard.
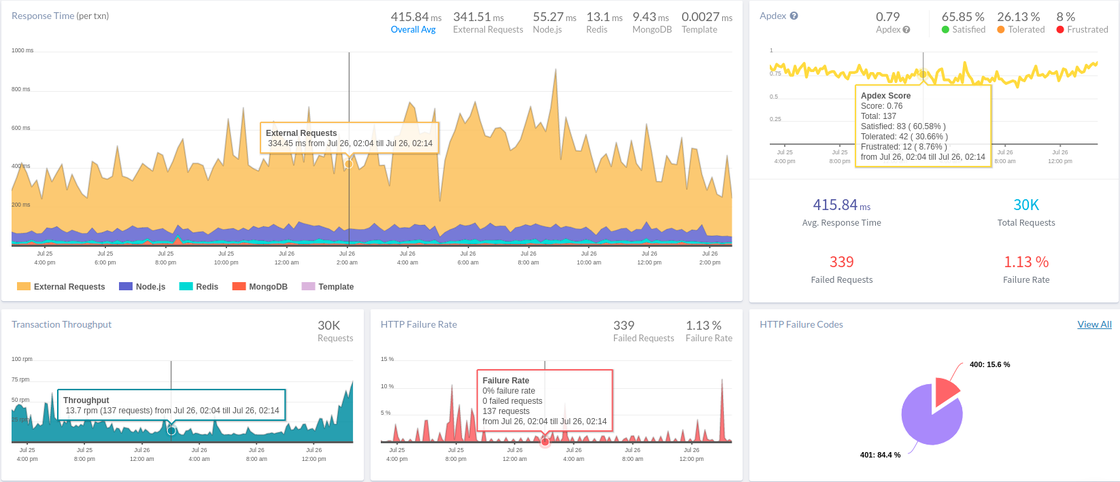
- Optimize response times - Monitor end-to-end transactions and identify which responses are slow to improve the speed of your application.
- Detect slow db queries - Proactively tune and improve database performance by monitoring key performance metrics such as most time consumed query, throughput and average, min and max query time along with the complete stack trace.
- Capture .NET errors and exceptions - Get the complete stack trace of the error and manage your exceptions efficiently with the metrics provided by Atatus.
- Monitor external API calls - Know where your .NET application is spending time by monitoring the third-party API calls.
- Identify end-point failures - Identify the root cause of the HTTP failure issue and detect the breakdown causes, along with the status code of each request.
- Smart alerting - Automatically monitor your application and get notified with the complete error information through various channels such as slack, teams, email etc… Address the .NET performance issues before they could affect your end-users and deliver the best end-user experience.
Monitor your software stack for free with Atatus.
Start your free trialOR
Request a DemoFree 14-day trial. No credit card required. Cancel anytime.