June 2022
Go Monitoring
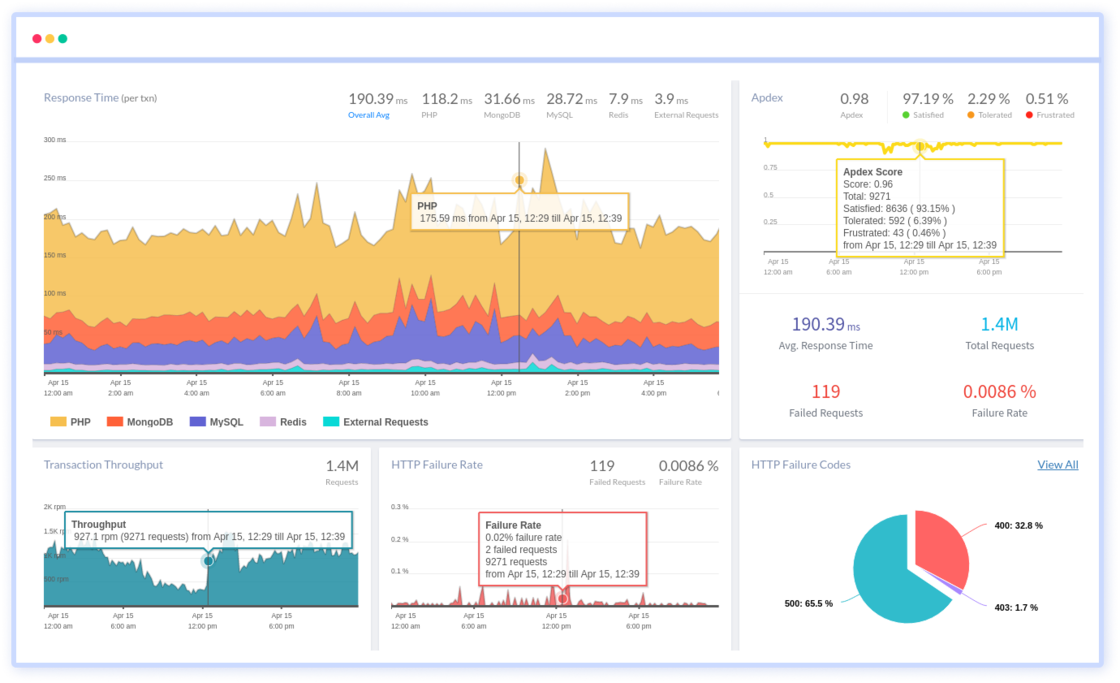
Atatus gathers data on your Go application performance and provides you with a holistic view of the performance metrics in real time. Using Go Monitoring, you can easily troubleshoot Golang errors and issues, such as slow transactions, response time, high latency, throughput, and more.

Atatus empowers you to make business-driven decisions by leveraging the insights it provides. By improving the customer experience and optimizing your application's performance, you can drive strategic actions that align with your business goals. All the data collected by Atatus are then aggregated to provide powerful alerting and reporting capabilities.
With Atatus Go Monitoring:
- Detect time-consuming and end-to-end transactions.
- Analyze the database hotspots.
- Get the complete stack trace of Go exceptions.
- Identify the HTTP failure rates.
- Also identifies non-deterministic behaviors like memory leaks, CPU usage, etc.
- Notifies you when an error arises or the app gets crashed.
Supported Frameworks:
Supported Databases:

 +1-415-800-4104


