June 18
Distributed Tracing Support - Python
A distributed trace for a Python application records the journey of a request as it moves through various services and components. It provides detailed insights into timing, errors, and resource usage at each stage. This tracing is essential for diagnosing issues, optimizing performance, and understanding the interactions within microservices architectures, helping developers pinpoint and resolve bottlenecks or failures in the system.

Atatus distributed tracing for Python captures and visualizes trace data from applications. It supports major frameworks and libraries, automatically collecting spans to help identify performance issues and trace requests across services for better visibility.
Key Features:
- Distributed Tracing: End-to-end tracing capabilities across spans, providing visibility into the flow of requests.
- Metrics Collection: Collect metrics such as response times, request rates, and error rates.
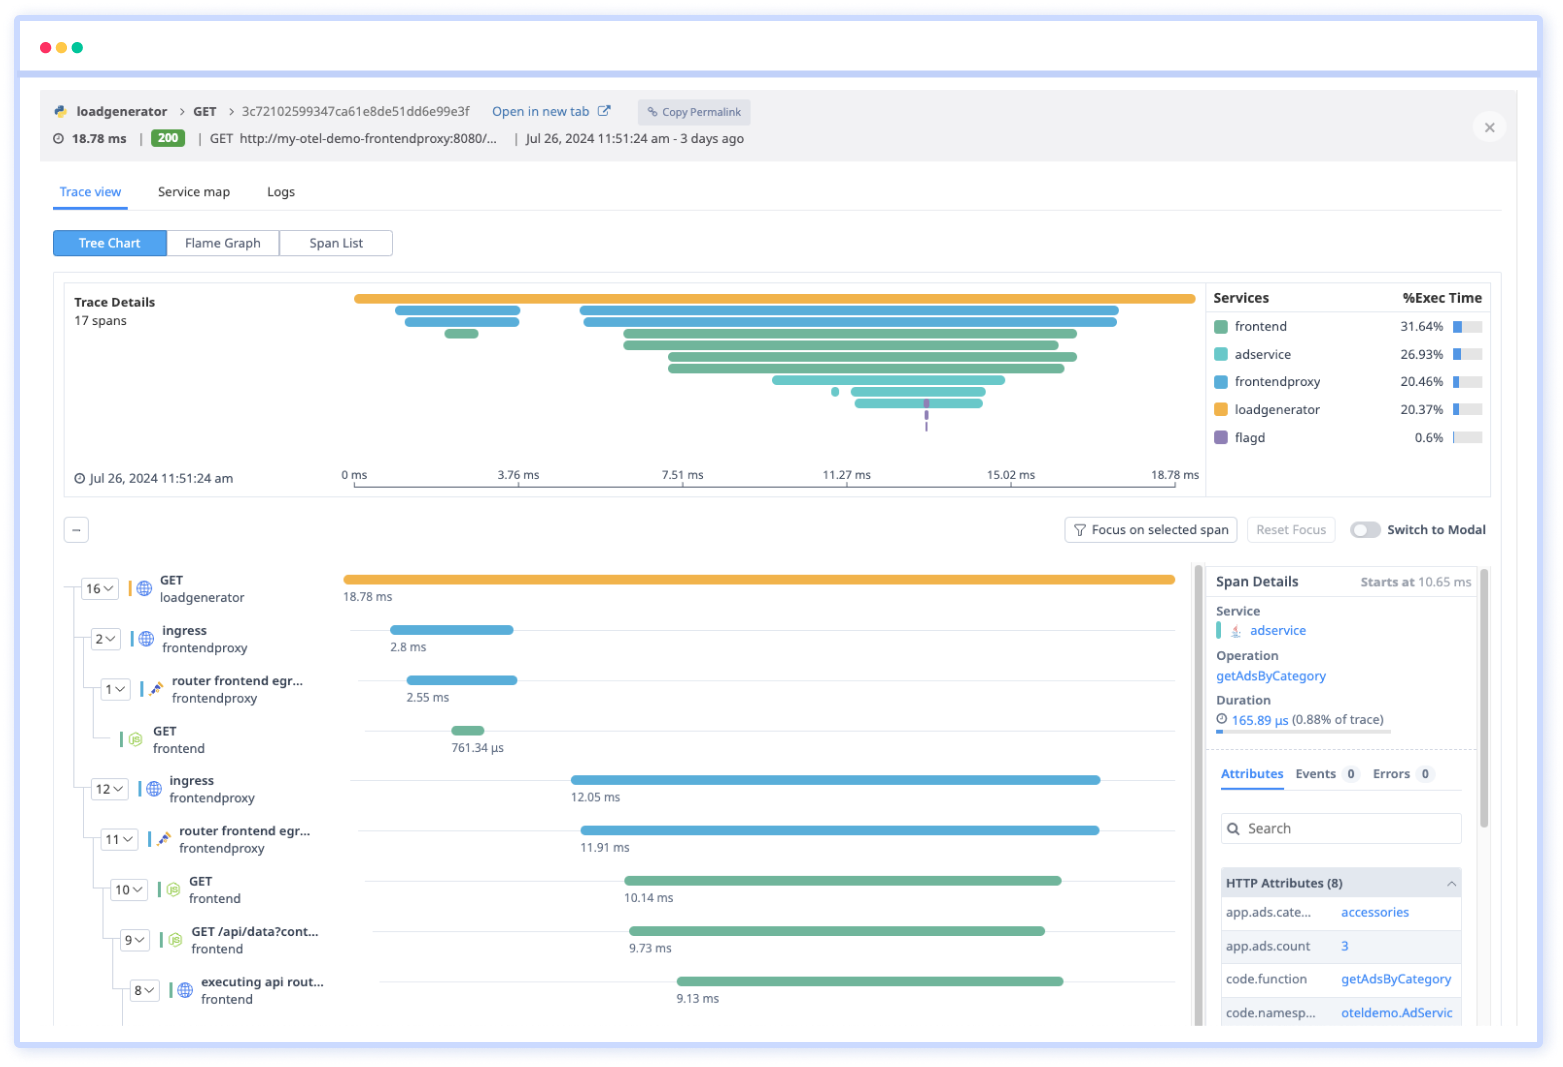
- Trace Visualization: Trace data are displayed, including tree charts, frame graphs, and span lists.
- Sampling and Rate Limiting: Configurable sampling strategies and rate limiting to manage data volume while capturing important traces.
- Error and Exception Tracking: Detailed error and exception tracking within traces, including stack traces and contextual information.
- Support for Distributed Systems: Compatibility with microservices architectures, cloud environments, containerized applications, and service meshes.
- Security and Compliance: Features for secure data transmission, encryption, and compliance with data privacy regulations.
- Filternation: Custom Tags and Annotations for analysis on traces.

 +1-415-800-4104


