Every Device. Every Metric. No Blind Spots
See the health of every network device in your infrastructure in real time — before a failing switch, saturated interface, or hardware fault turns into an outage.
500+
Device profiles for Cisco, Juniper, Arista, and more
60s
Default polling interval for device health metrics
Real-time
SNMP trap ingestion — no waiting for next poll
No agents
Agentless — nothing installed on network hardware
Everything your network team needs, in one place
Complete visibility into your physical network
Atatus polls your routers, switches, and firewalls using SNMPv2c and SNMPv3, and listens for real-time SNMP traps — collecting device health, interface throughput, and topology data from every piece of hardware in your infrastructure. No agents on the devices required.
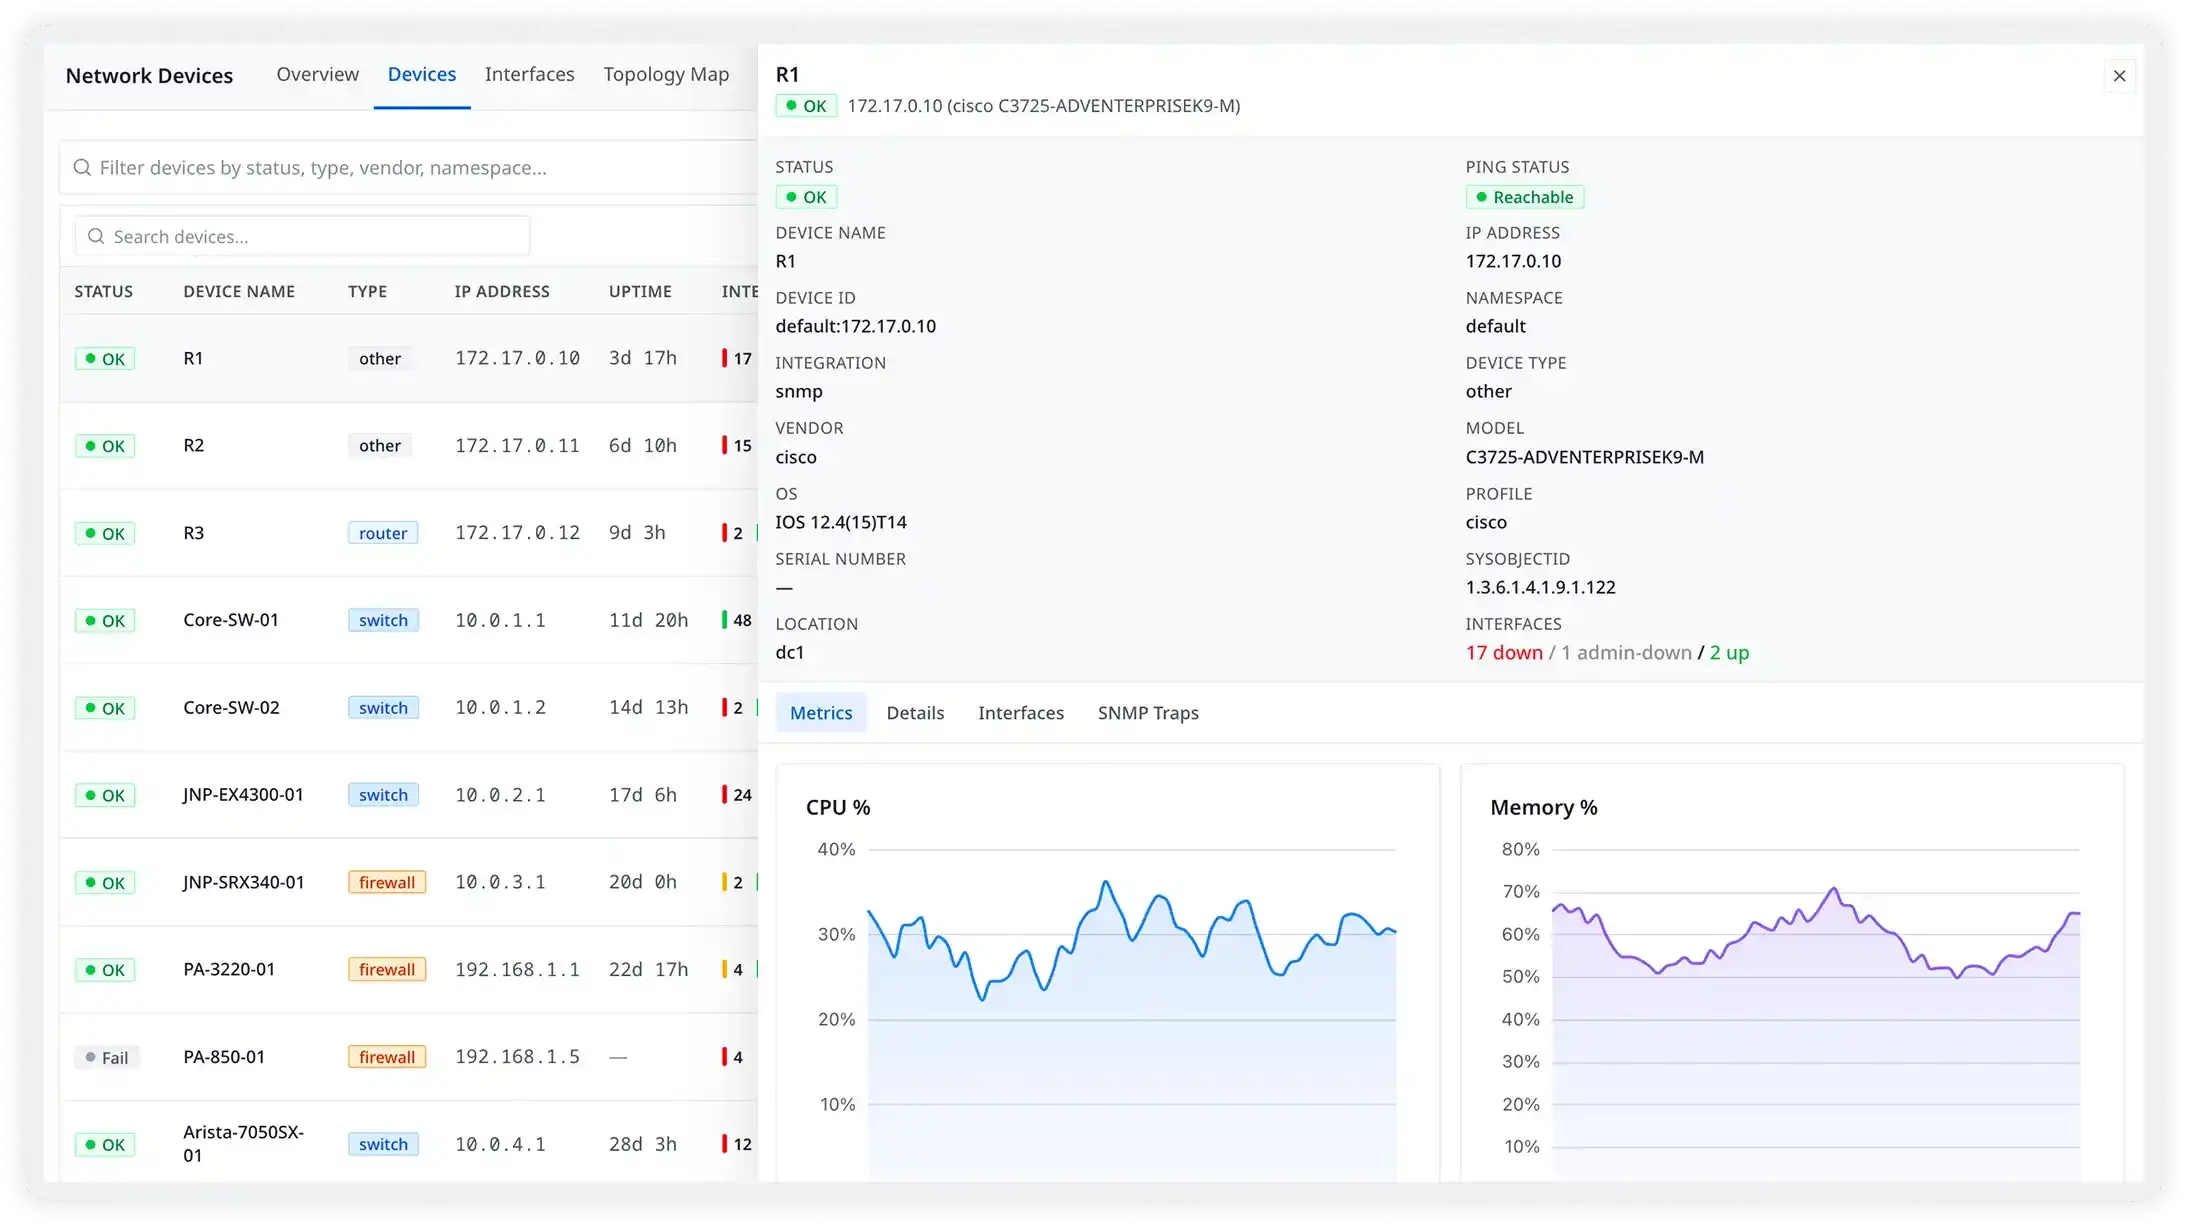
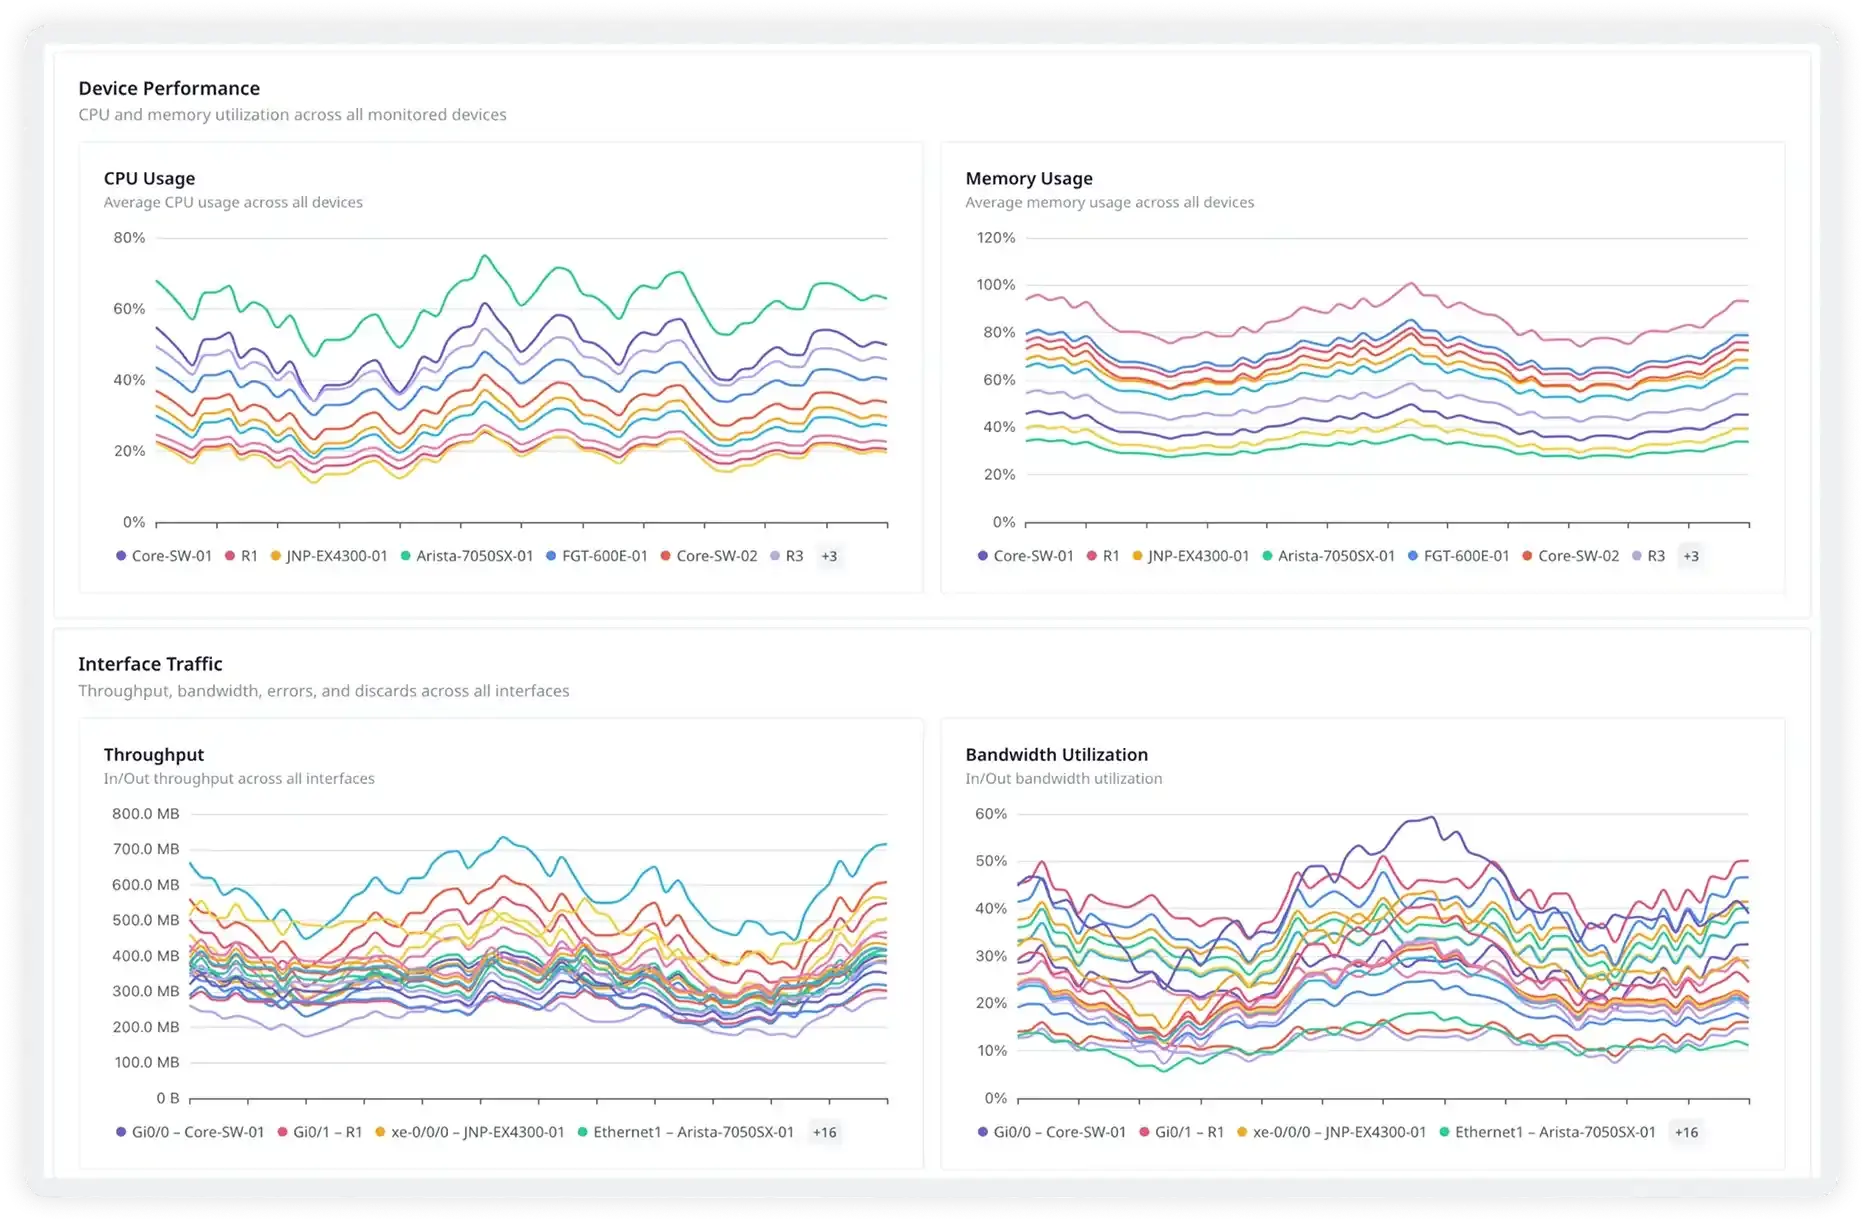
Monitor every device's health, continuously
Atatus polls CPU utilization, memory usage, temperature sensors, fan RPM, and PSU state from every device at configurable intervals. Hardware degradation — an overheating linecard, a failing power supply — shows up as a metric trend long before the device crashes or throws an alert.
- CPU and memory utilization tracked as time-series per device
- Temperature, fan speed, and PSU state via vendor-specific OIDs
- Alerts when any health metric crosses your defined threshold
- Device uptime tracking and reboot event detection via SNMP traps
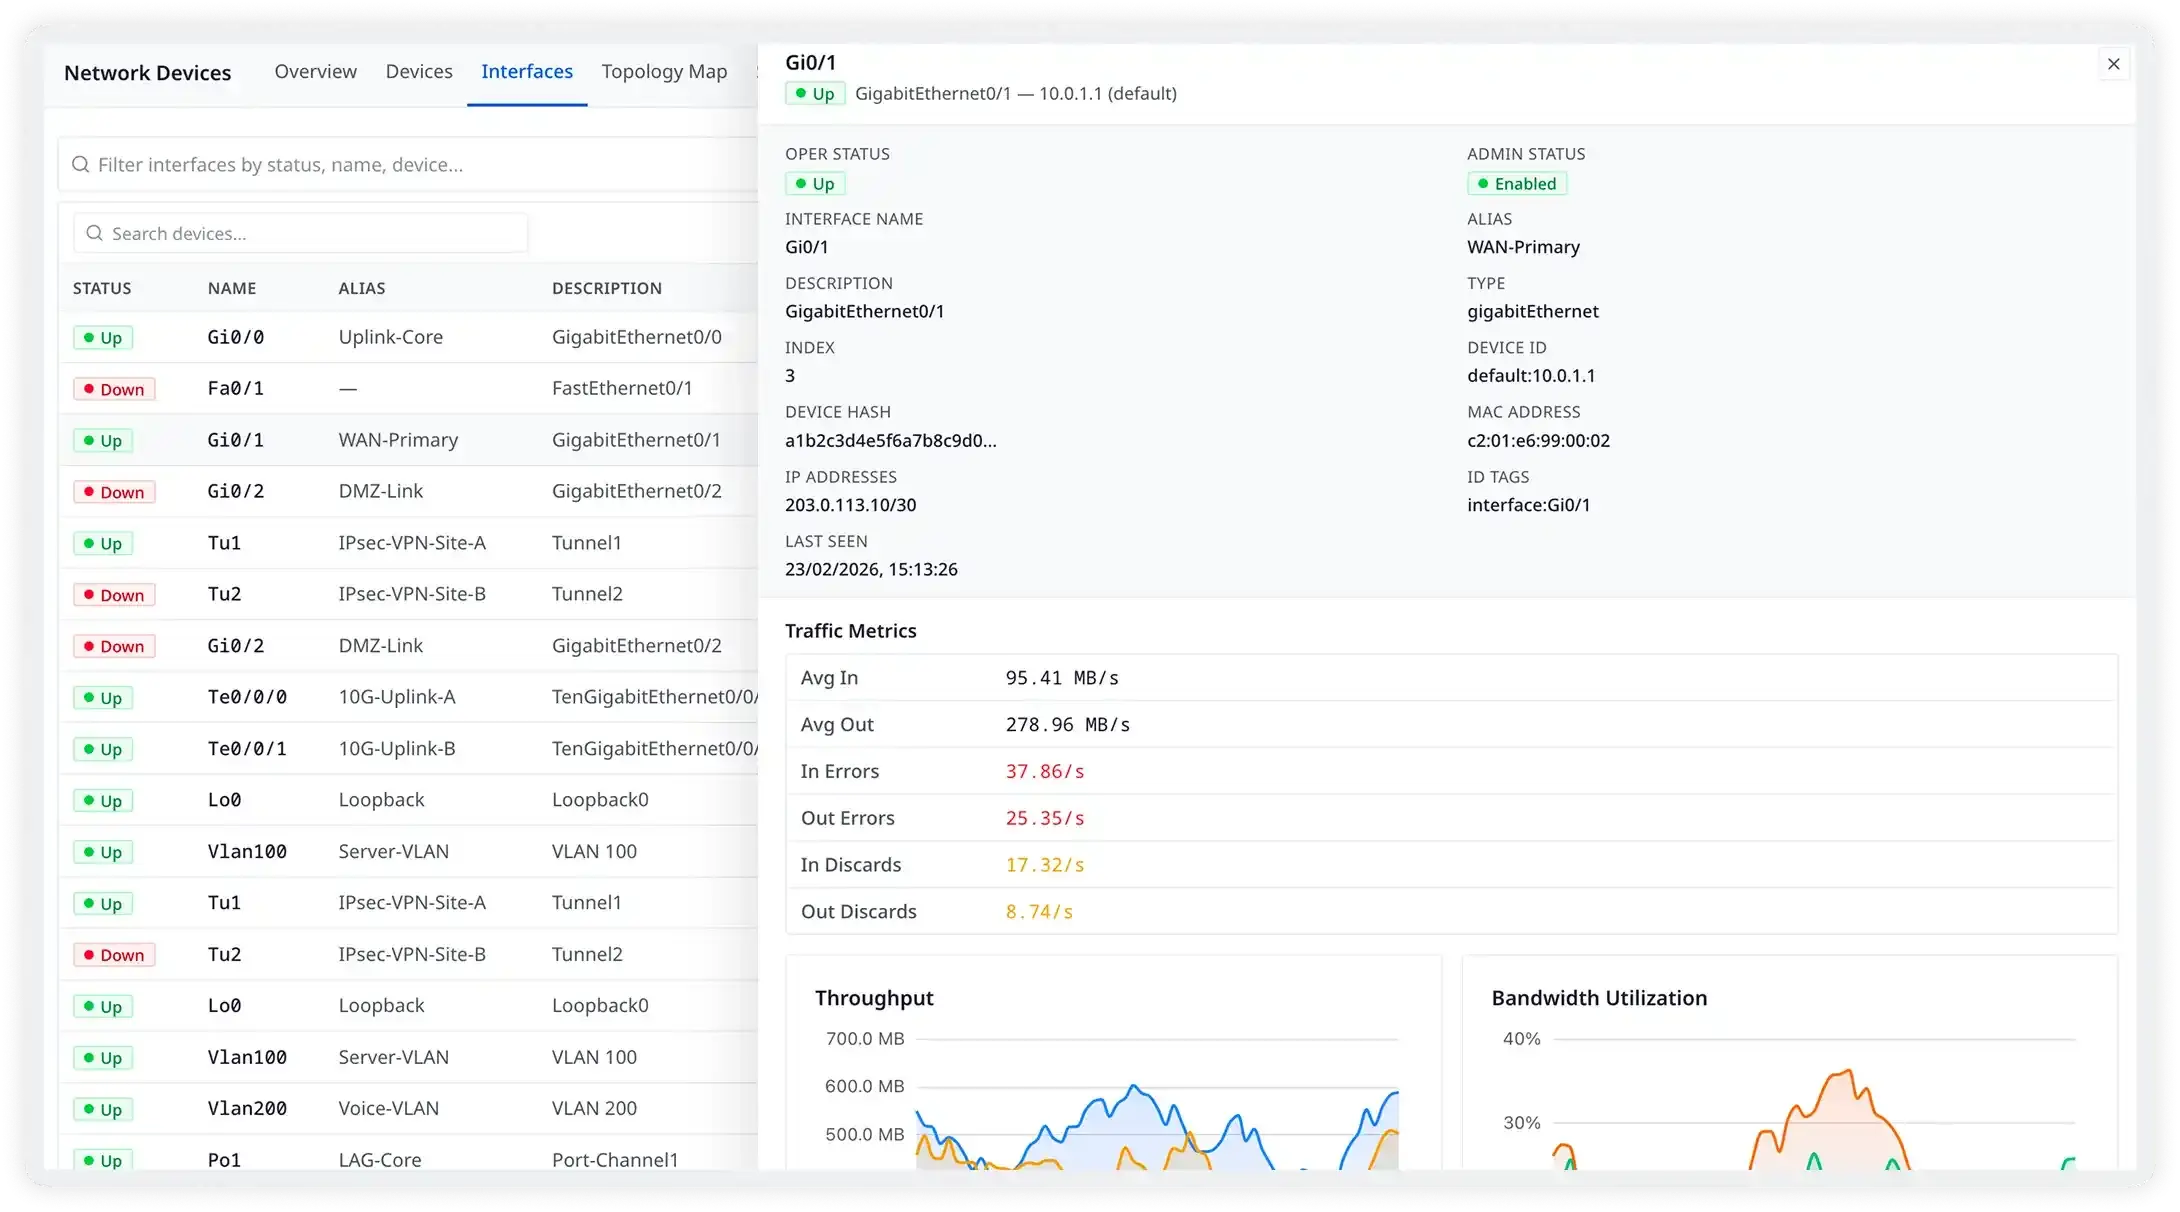
Per-interface visibility across every device in your fleet
Atatus tracks ingress and egress throughput, error rates, discards, and utilization for every interface across all your devices. When a link starts approaching capacity or throwing errors, you'll see it in the data — before it becomes an outage.
- Track in/out throughput in Mbps per interface as continuous time-series
- Monitor error rates, input discards, and CRC errors per interface
- Set per-interface bandwidth utilization thresholds for proactive alerts
- View 48 ports of a switch at once — spot the saturated one instantly
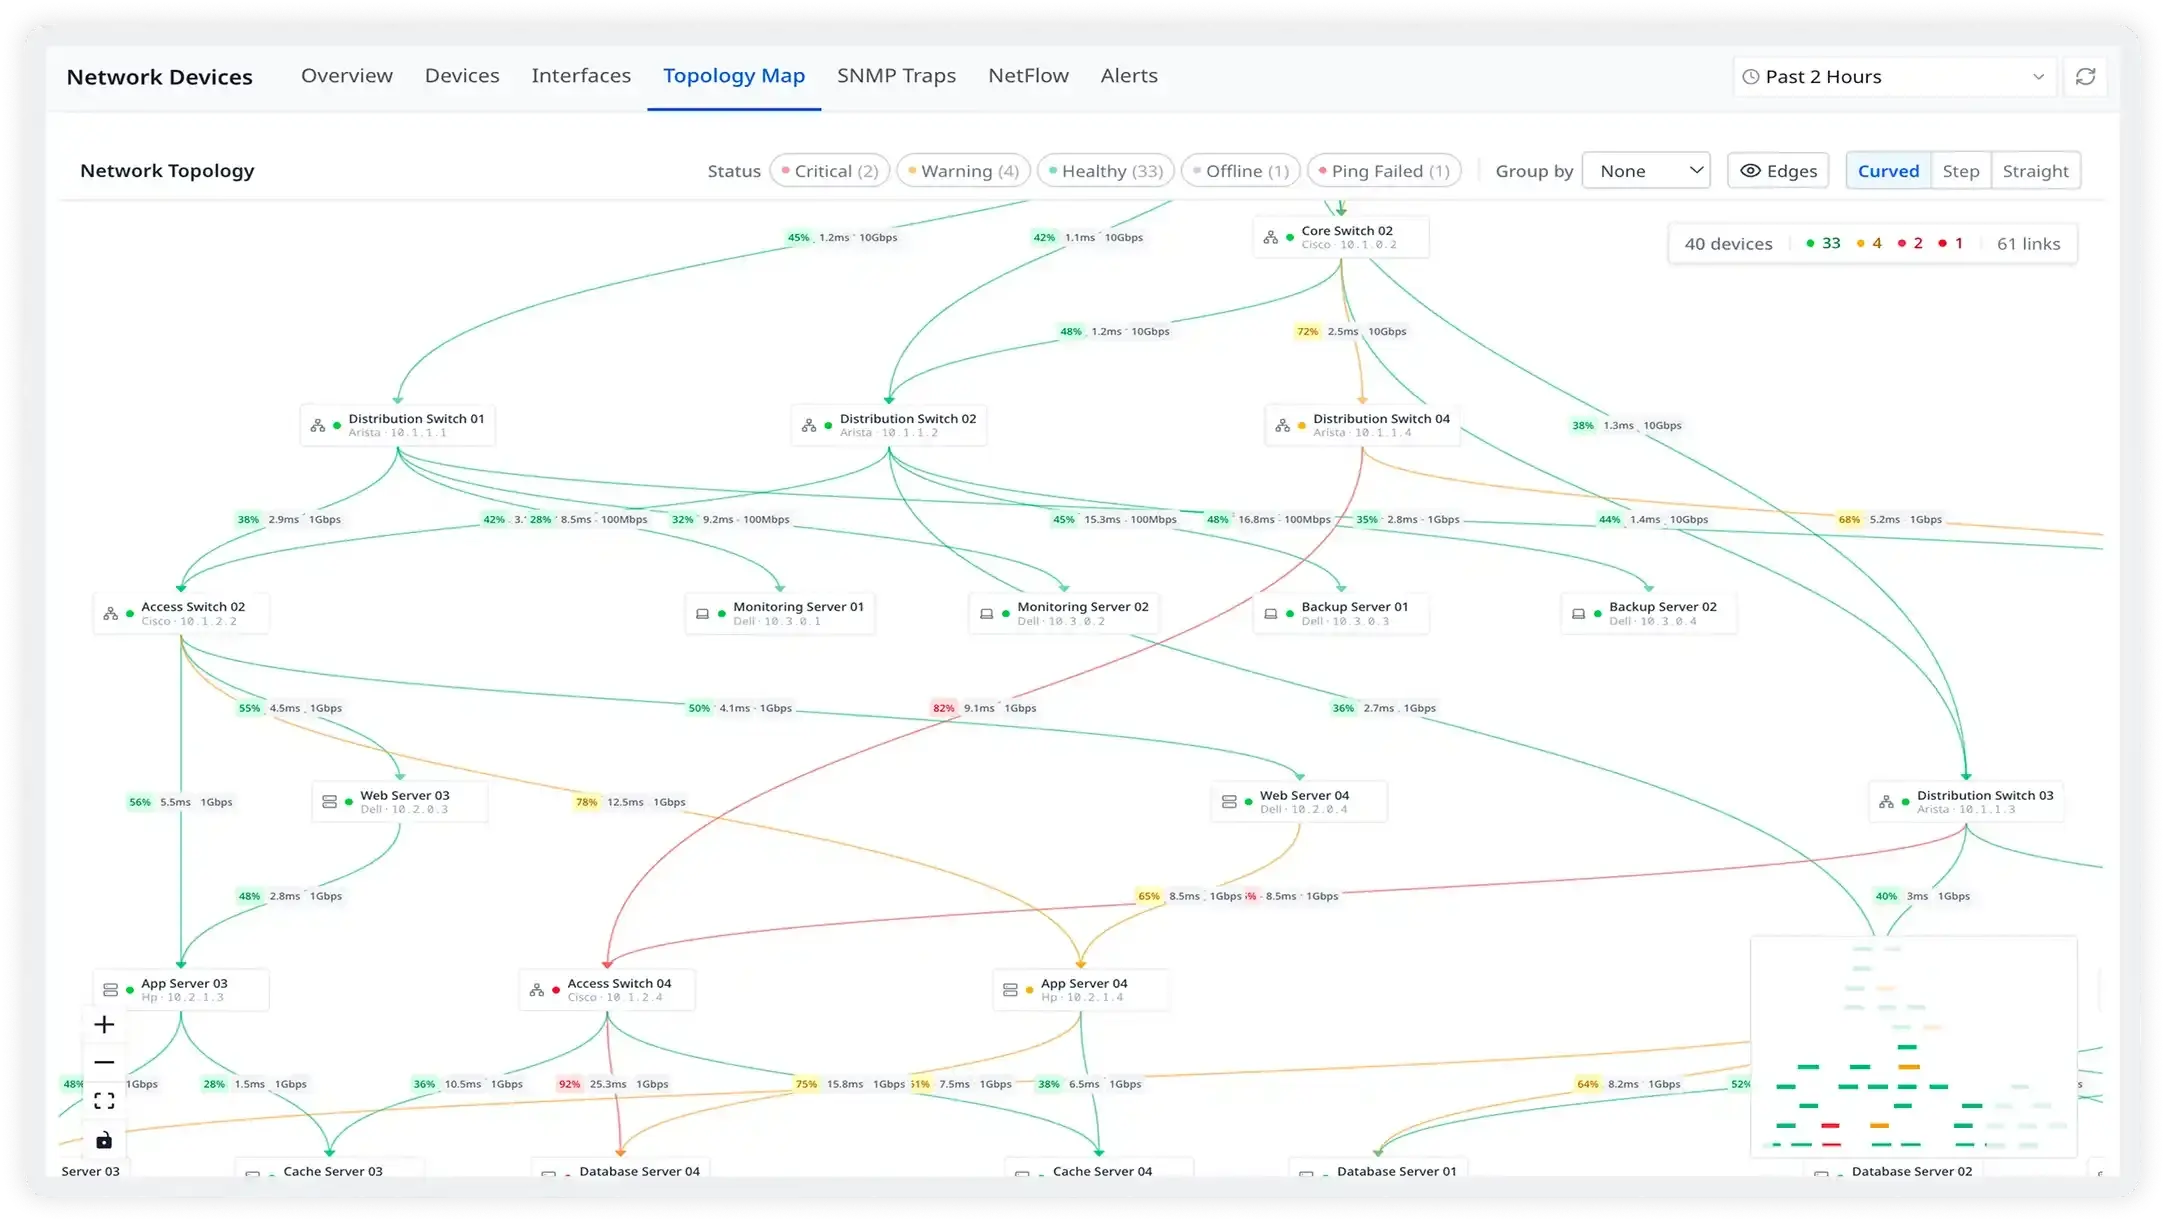
A bird's-eye view of your physical network fabric
Atatus reads LLDP and CDP neighbor tables to automatically build a live topology map — showing every device, its connections, and the health of each link. Drill down into any device with a single click to investigate interface performance, SNMP traps, NetFlow traffic, and syslogs — all in one place.
- Auto-discover physical connections via LLDP and CDP neighbor discovery
- Understand upstream and downstream impact of any device going down
- Color-coded nodes instantly show healthy, degraded, and offline devices
- Detect and resolve issues faster with real-time anomaly highlighting
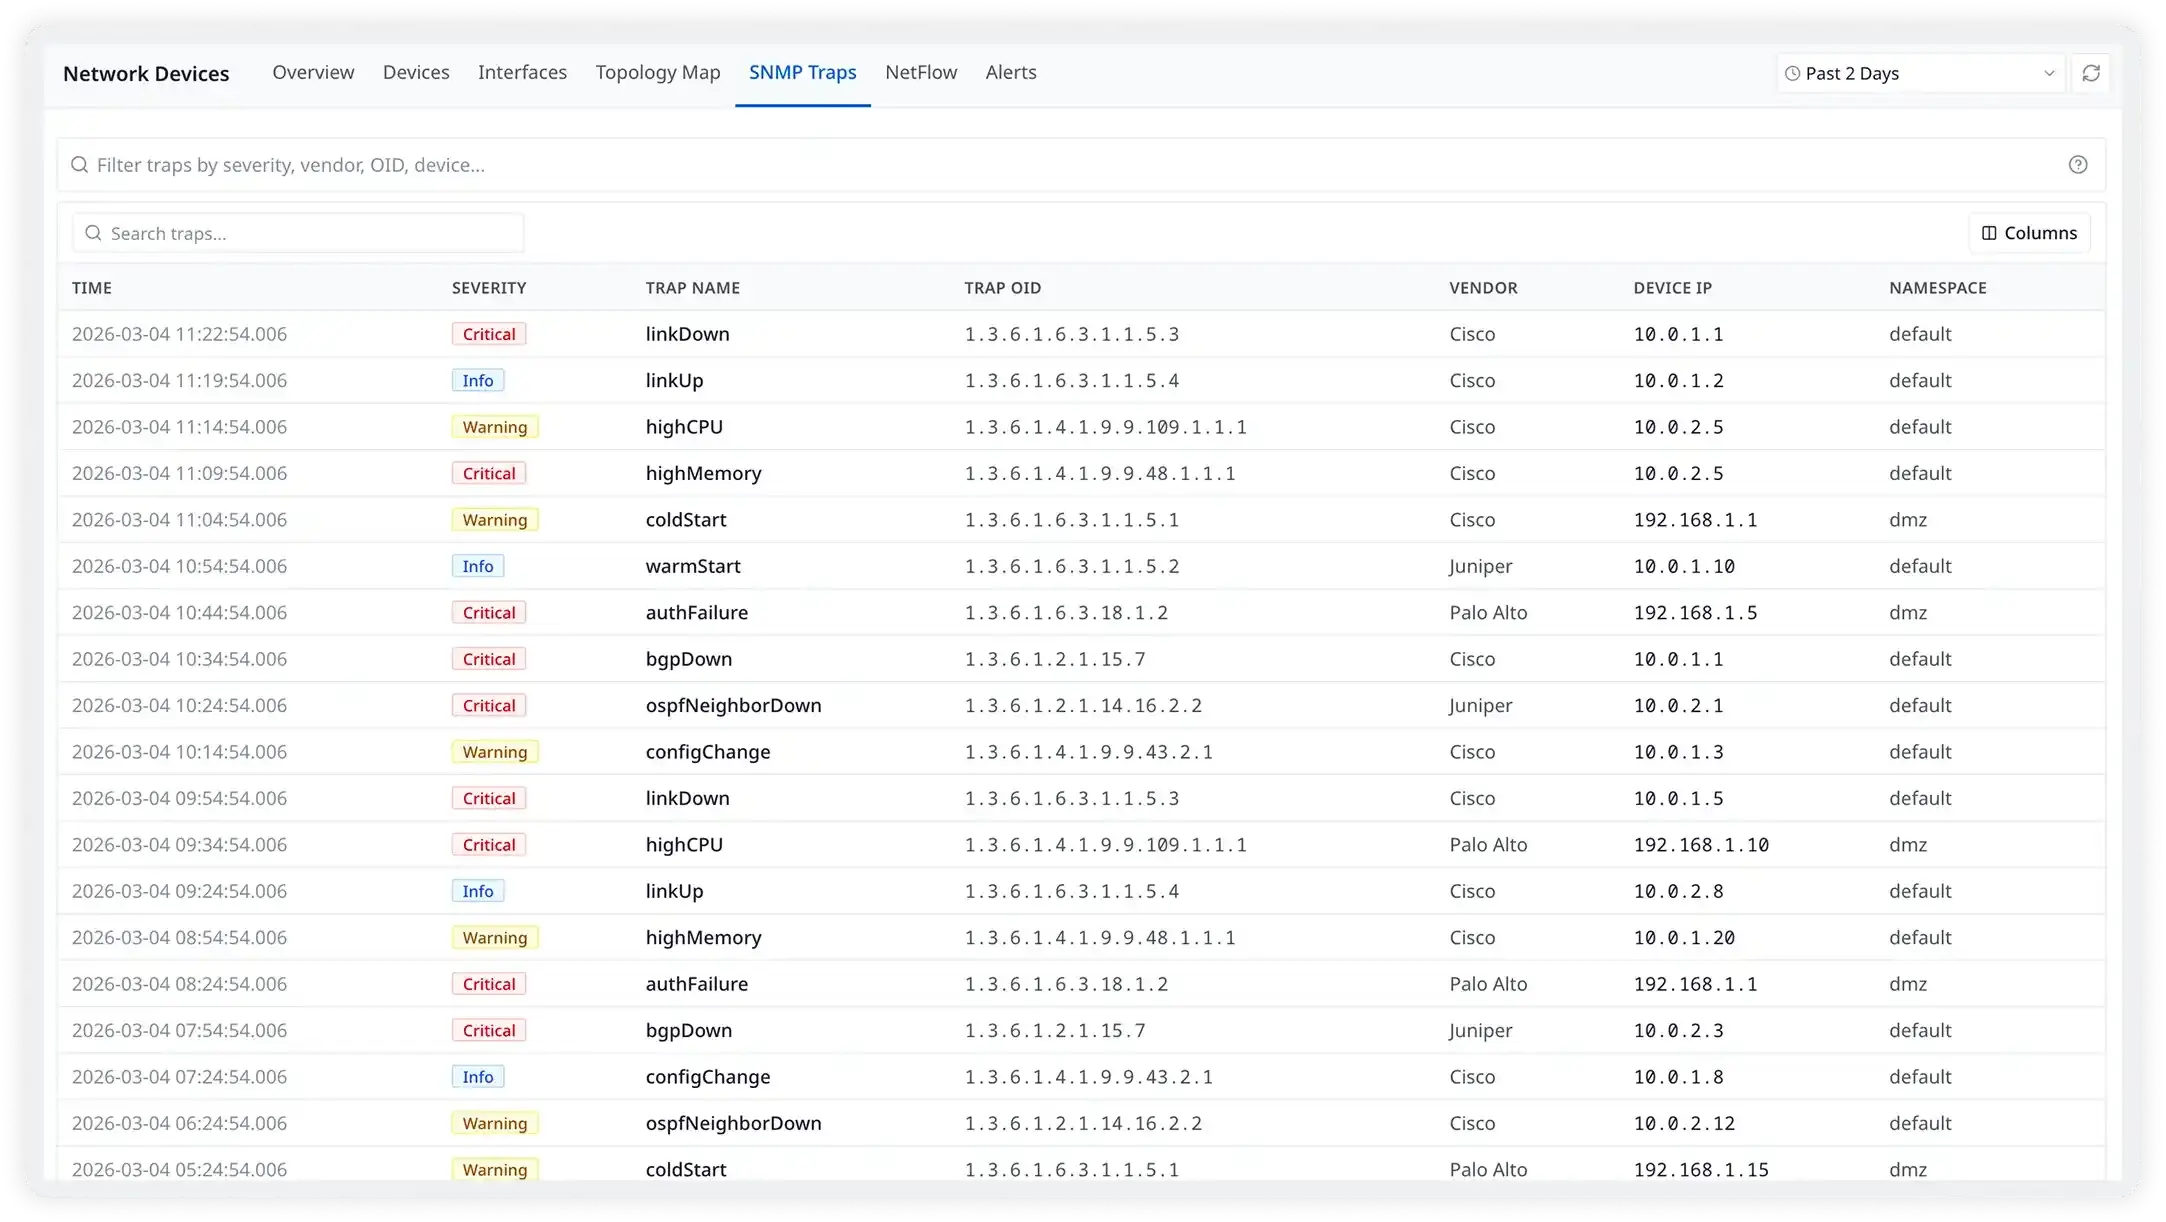
Instant event notifications, the moment they happen
Atatus acts as your SNMP trap receiver — when a device sends a critical event notification, it arrives in Atatus within seconds, automatically correlated with the device's polling metrics. No more finding out about a switch reboot from a user complaint.
- Receive linkDown, linkUp, coldStart, warmStart events instantly
- Capture BGP session state changes and routing table anomalies
- Process custom enterprise-specific traps from any vendor
- Correlate trap events with live polling data for complete incident context
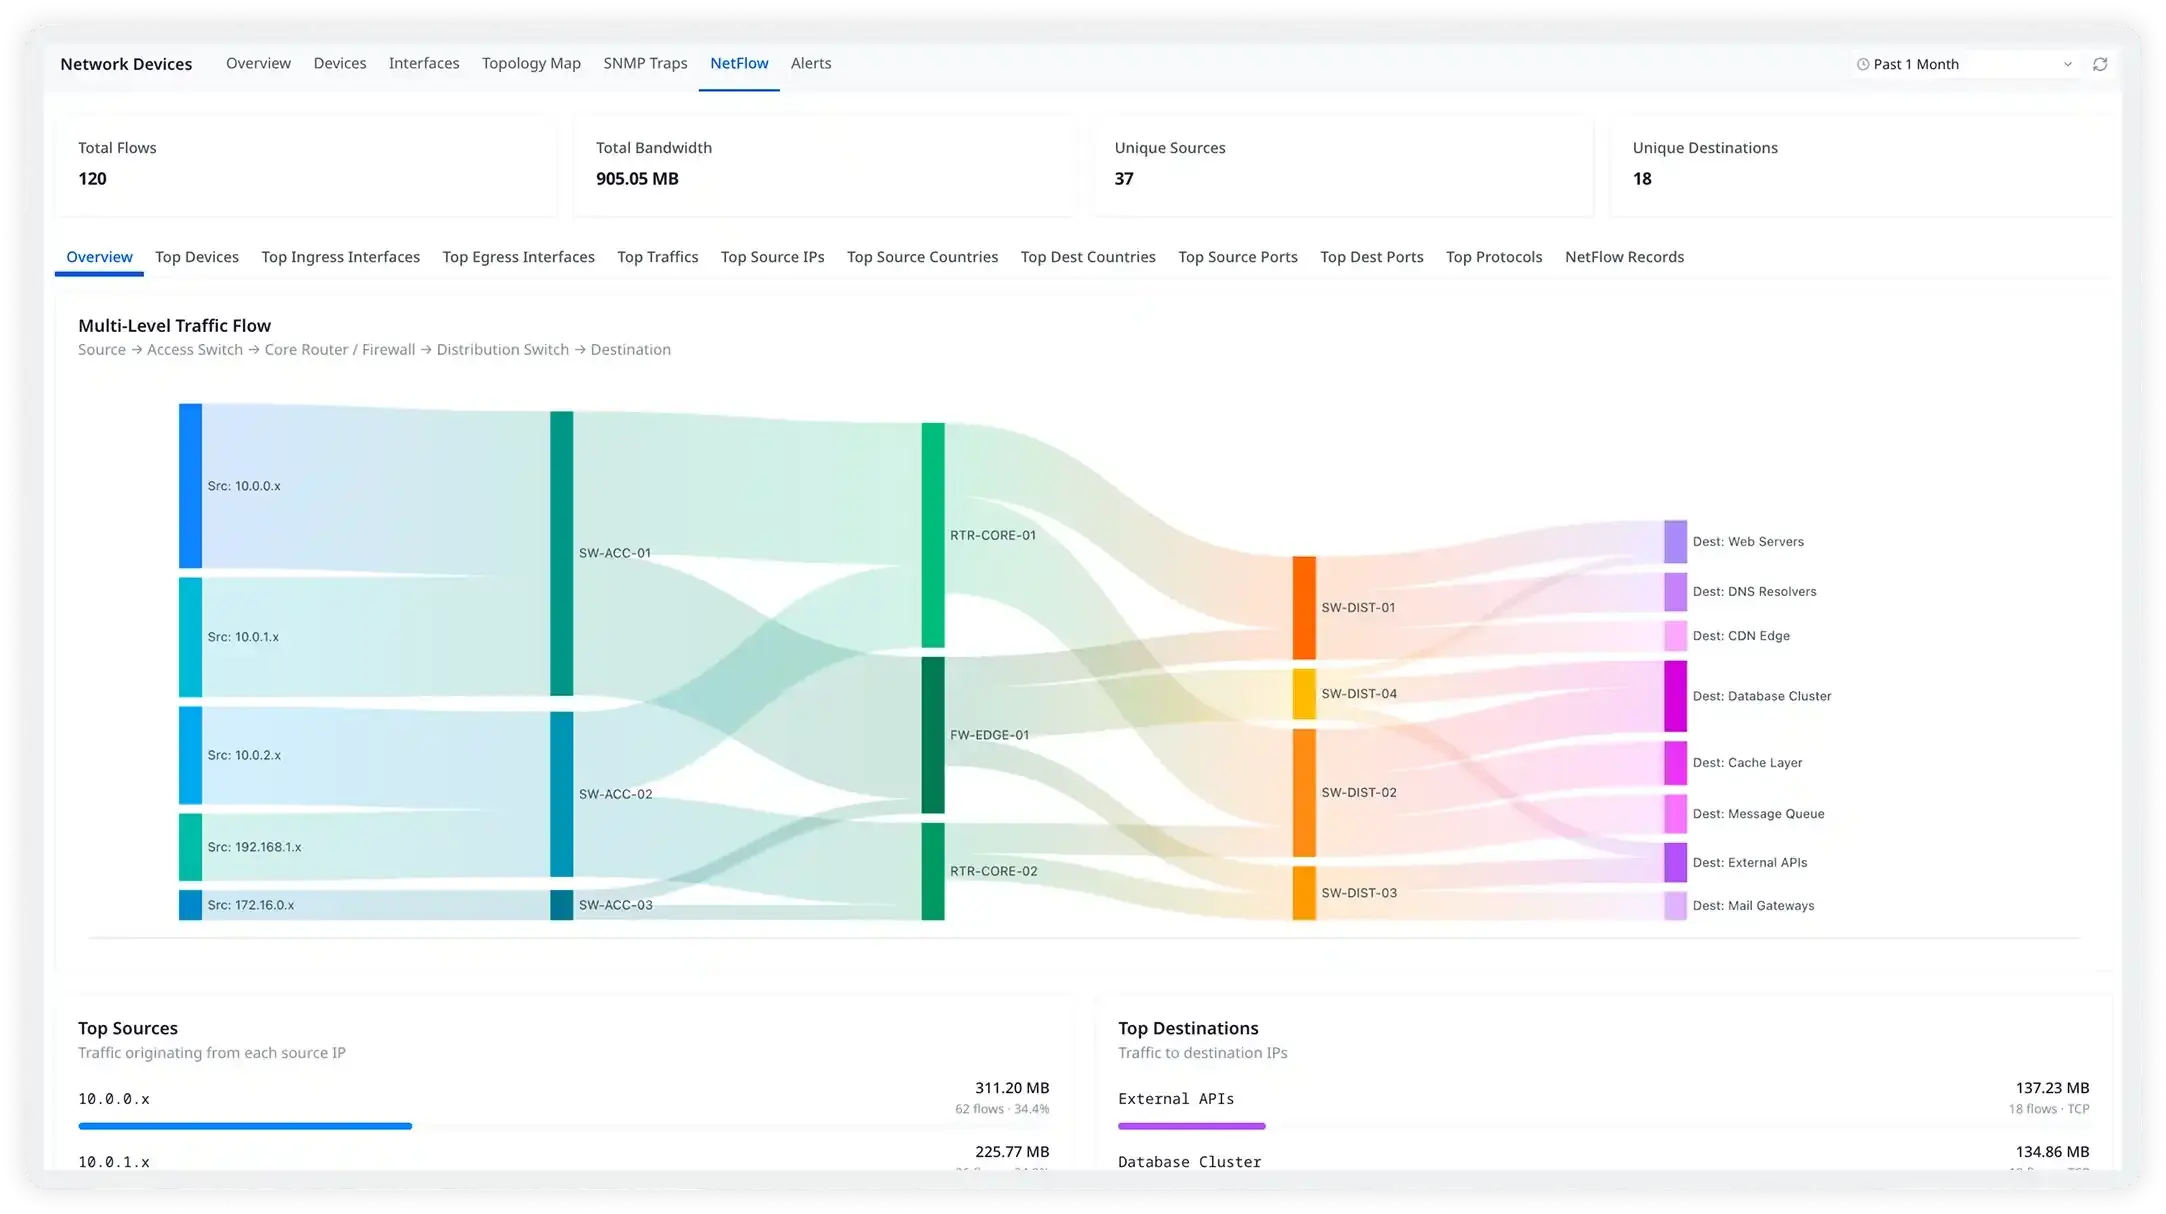
Take action with high context traffic flow visibility
Atatus collects NetFlow and sFlow records from your devices to give you deep traffic flow visibility — identify which source IPs, destination ports, applications, and cloud providers are consuming your bandwidth, and correlate this with host and application data for the full picture.
- Identify top contributors of network congestion and bandwidth bottlenecks
- Verify legitimacy of traffic and detect unusual network patterns by geography or cloud provider
- Slice and dice flows by source, destination, port, protocol, and application
- Support for NetFlow v5, v9, IPFIX, sFlow, and jFlow from any vendor
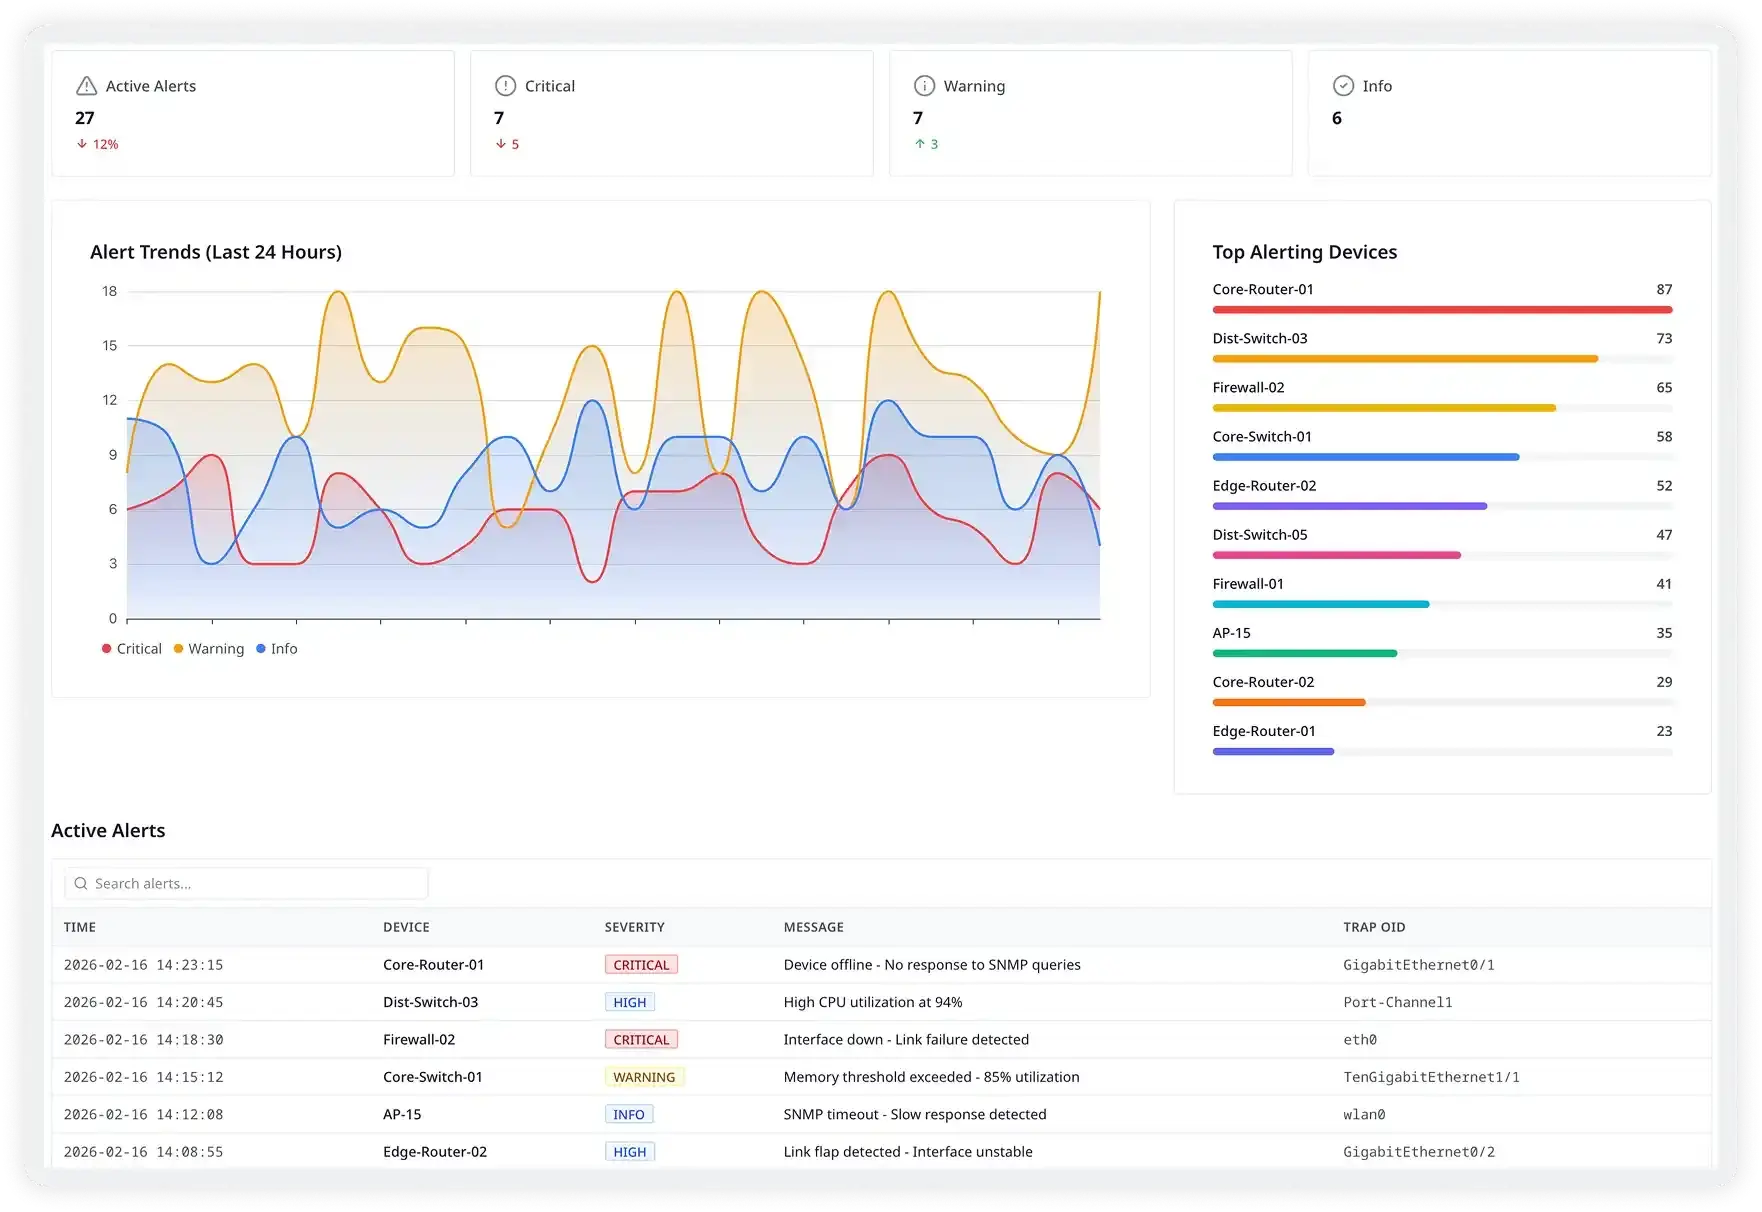
Detect problems across your stack before users do
Atatus lets you define alert policies on any device metric, interface threshold, or SNMP trap type. Get notified through PagerDuty, Slack, or any webhook — with full device context embedded, so your on-call engineer knows exactly what's wrong the moment they're paged.
- Alert on interface utilization above threshold (e.g. >90% for 5 min)
- Trigger on CPU or memory spikes sustained beyond a defined window
- Fire instantly on any SNMP trap type — linkDown, BGP drops, hardware faults
- Route alerts to PagerDuty, Slack, OpsGenie, or any custom webhook
Built for the hardest network problems
Interface Saturation & Capacity Planning
Track interface throughput trends over weeks to proactively upgrade links before users notice slowdowns or packet drops.
Hardware Fault Detection
A failing PSU or overheating linecard shows up as a metric trend before it crashes. Atatus alerts your team before the hardware gives out.
BGP Session Monitoring
Track BGP peer states and receive instant trap alerts the moment a session drops or the route table changes unexpectedly.
Config Change Audit
Correlate config-change SNMP traps with interface metric shifts to link performance degradation to a recent change.
Multi-Site Network Health
Monitor devices across data centers and branch offices from one pane — roll-up views with drill-down to any device.
Works with your existing network hardware
IOS · IOS-XE · NX-OS Catalyst · Nexus · ASR · ASA
SNMP v2c / v3Junos OS MX · EX · QFX · SRX
SNMP v2c / v3EOS 7000 · 7200 · 7500 Series
SNMP v2c / v3PAN-OS PA-3000 · PA-5200 Series
SNMP v2c / v3BIG-IP TMOS LTM · iSeries
SNMP v2c / v3ArubaOS · CX Series 2930 · 5400 Switches
SNMP v2c / v3FortiOS FortiGate · FortiSwitch
SNMP v2c / v3Custom / Generic
Any SNMP-compatible device Custom OID profiles
Custom Profile