See Exactly Where Your Traffic Slows Down
Atatus continuously probes every network hop between your services. When something degrades, you see exactly which hop is responsible, not just that something is wrong.
Every Hop
Per-hop latency, jitter, and packet loss
<10ms
Probe resolution for path measurements
Real-time
Path topology map with live health status
No agents
Works across cloud, WAN, and on-premises
Everything in Network Path Monitoring
Visual Path Topology
Real-time topology map of every router and segment from source to destination, color-coded by health status.
Per-Hop Latency Breakdown
RTT measured at every intermediate hop — isolate whether slowdowns are in cloud, WAN, or on-premises.
Packet Loss Detection
Sub-1% packet loss caught per hop before TCP retransmissions and application timeouts surface."
Path Change Detection
Automatic detection of BGP rerouting and ECMP failover with before/after path diffs.
Historical Path Replay
Replay hop-by-hop latency from any point in time to understand root cause after an incident.
Smart Alerting
Threshold-based alerts on per-hop latency, end-to-end RTT, or packet loss — routed to PagerDuty or Slack.
Everything your network team needs, in one place
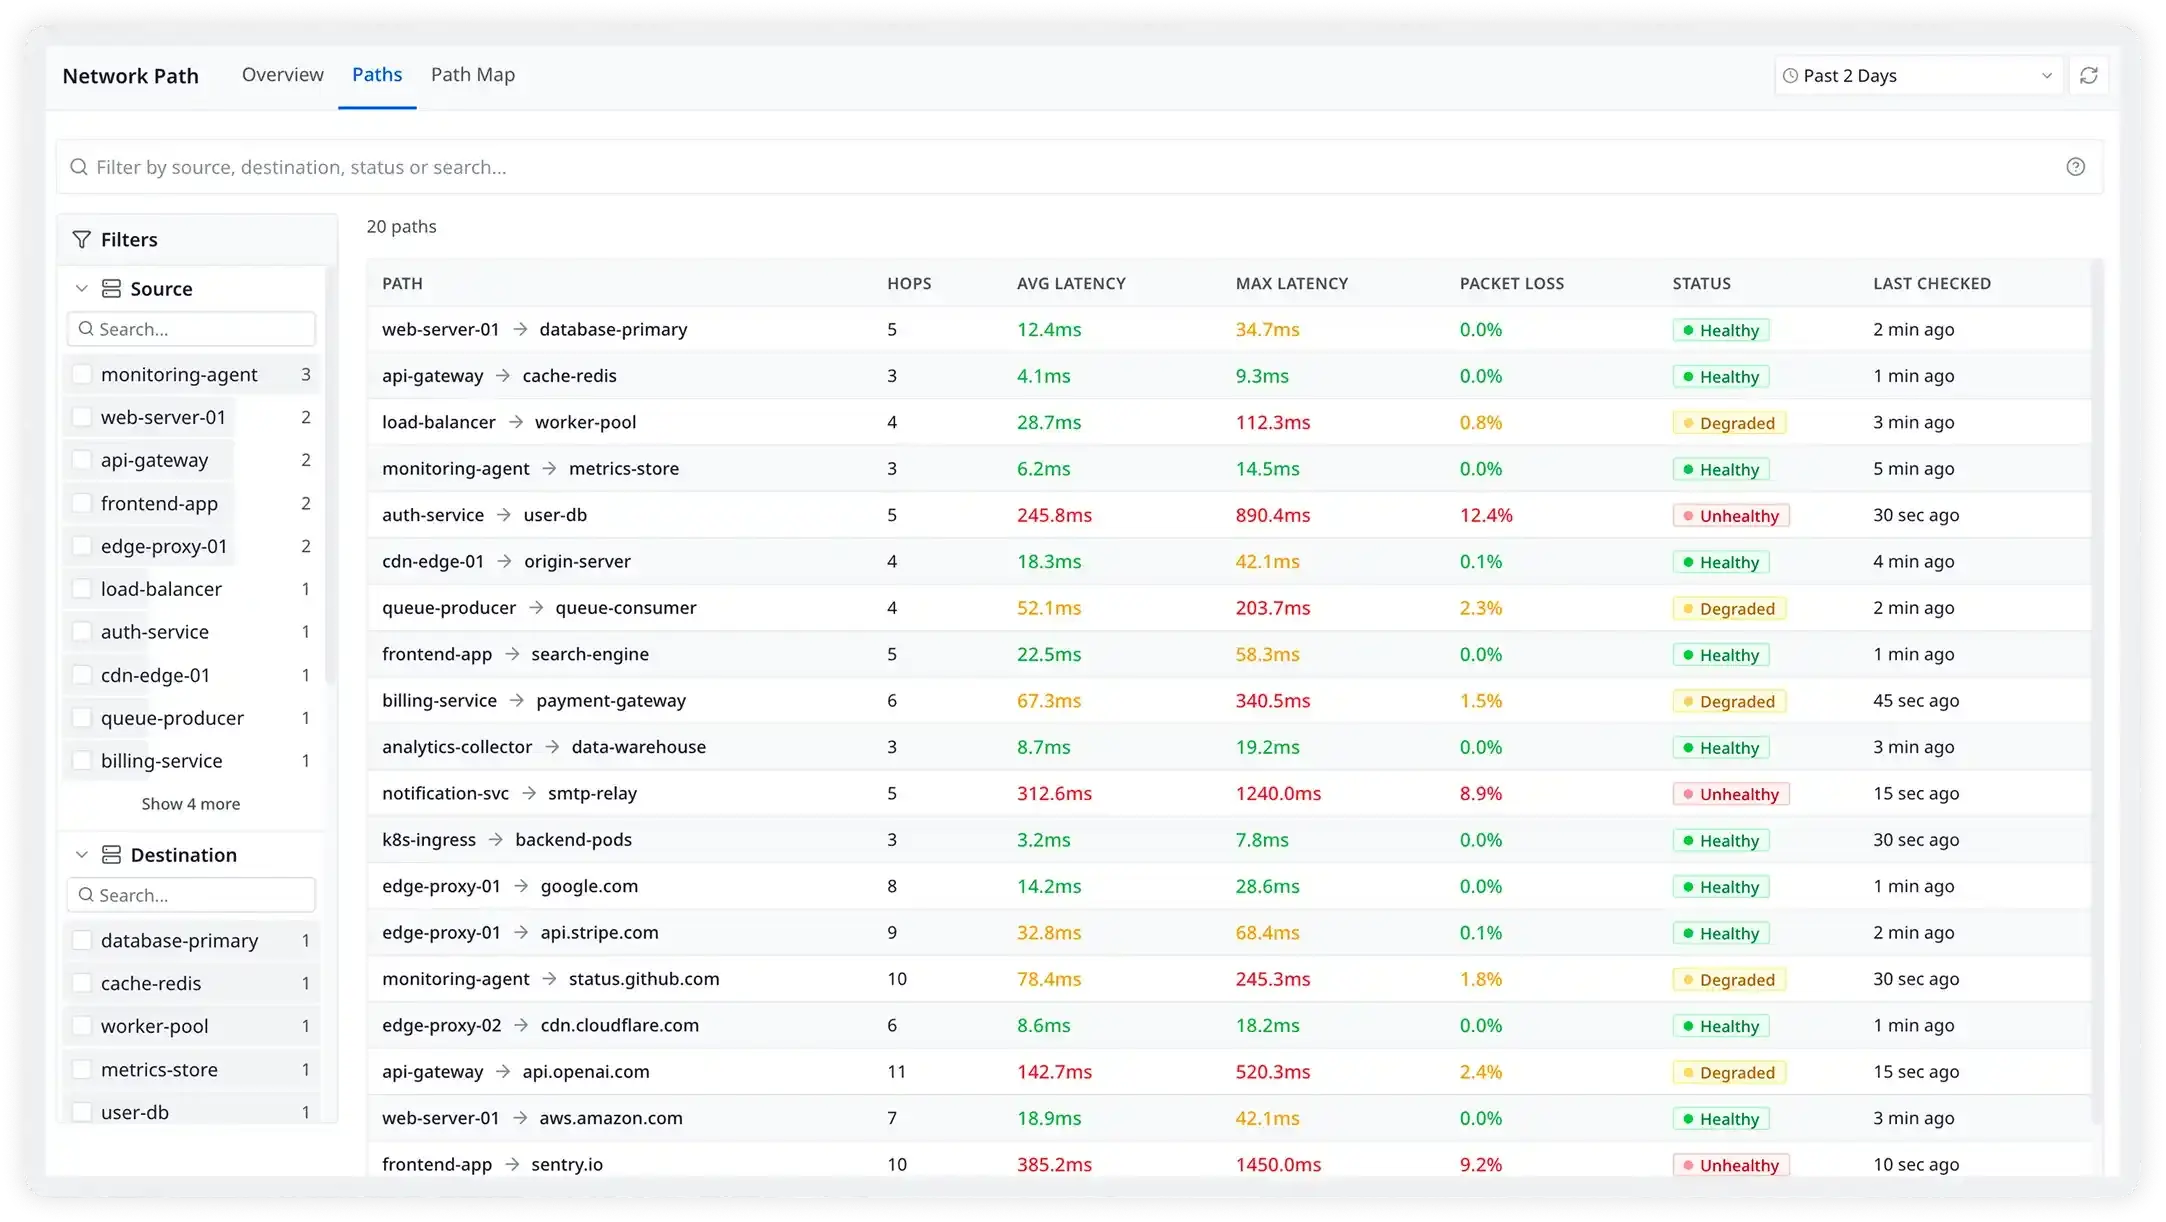
Traceroute-based probing at every hop, continuously
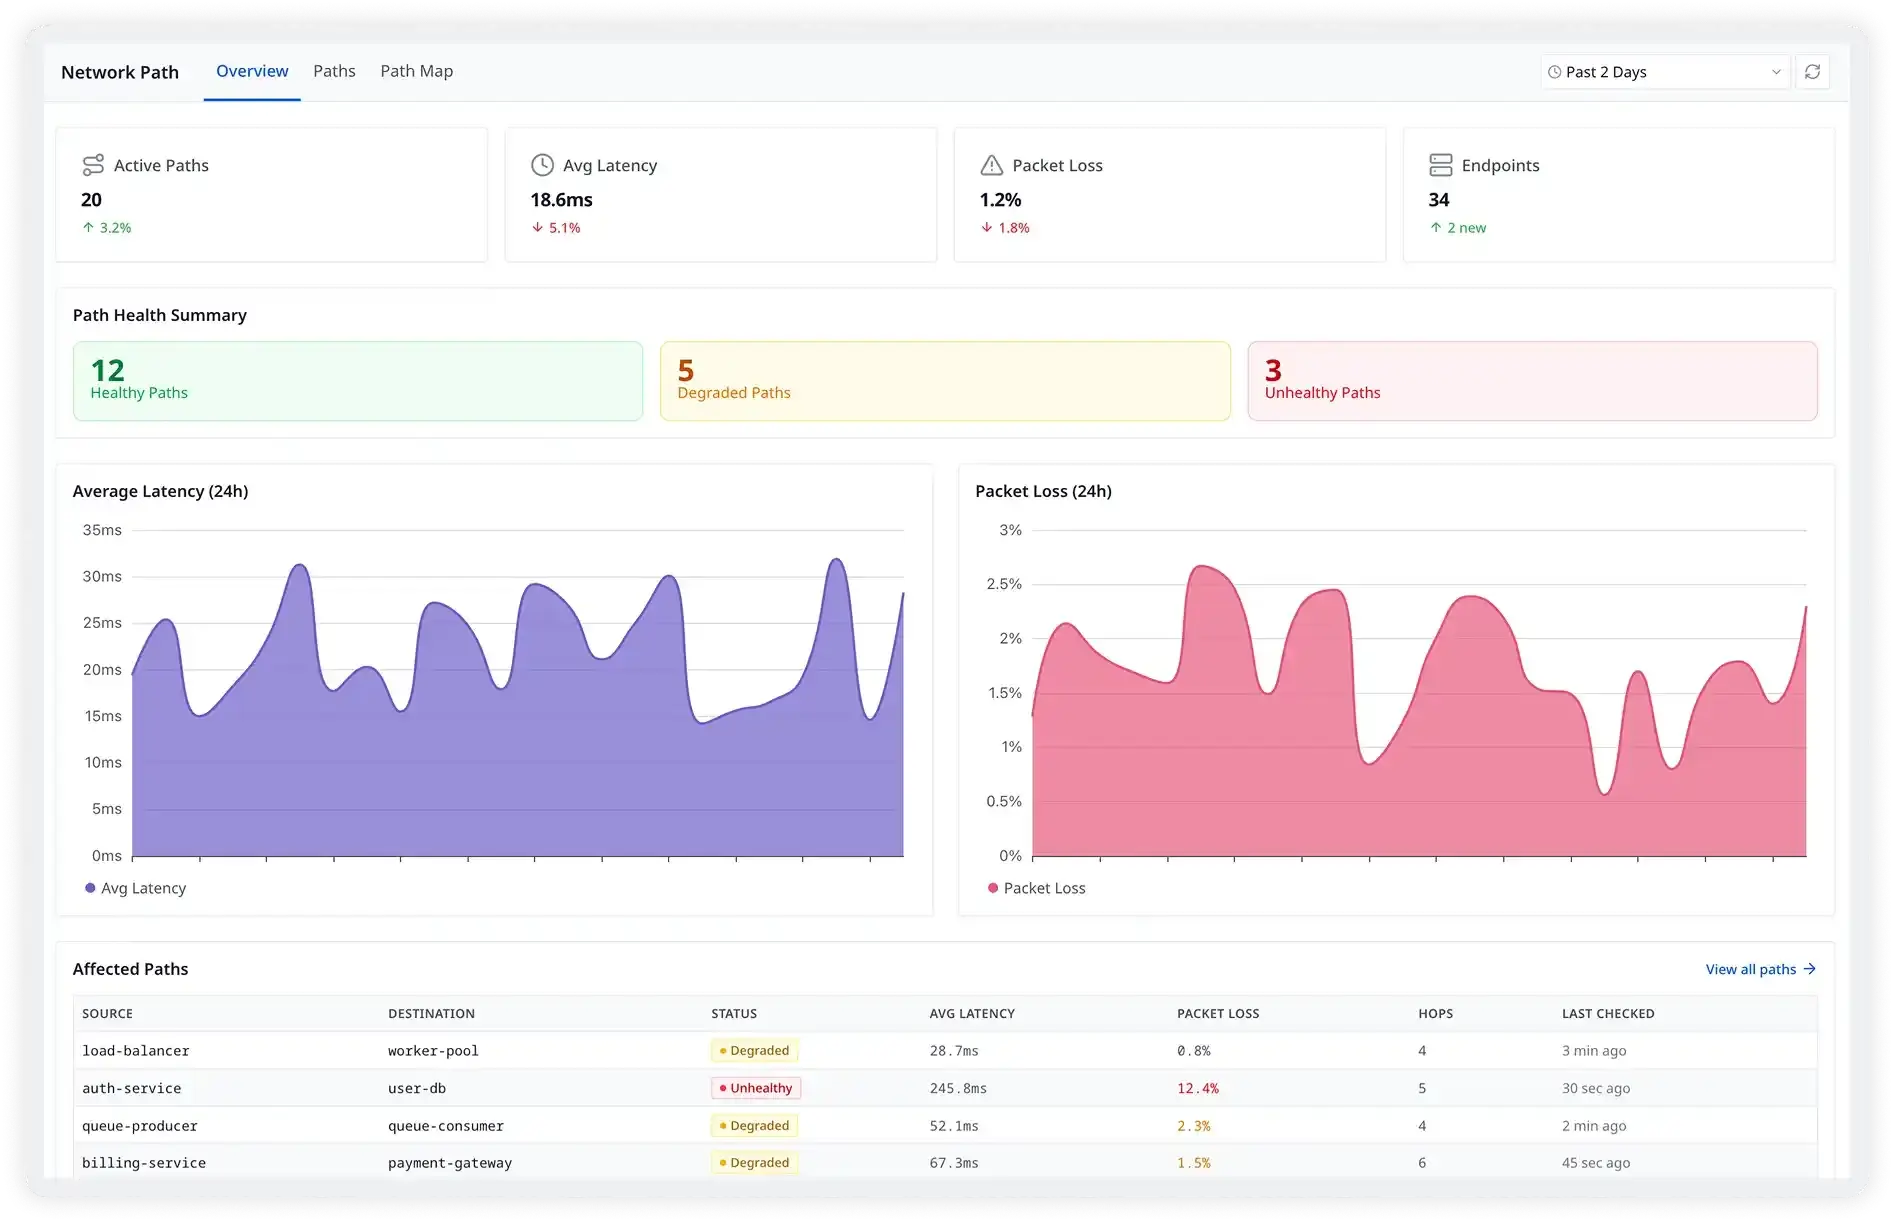
Atatus uses lightweight ICMP/UDP probes to map every network hop between your services in real time — measuring per-hop latency, jitter, and packet loss across cloud, WAN, and on-premises infrastructure. When your application slows down, you'll know exactly which hop is responsible.
Know exactly which hop is adding latency
Standard monitoring tells you the connection is slow. Atatus tells you it's hop 3 — the WAN edge router — adding 38ms above baseline. Every intermediate router between source and destination is measured individually, so you stop guessing and start fixing
- Measure RTT at every individual hop along the full path
- Identify whether slowdowns originate in cloud VPC, WAN, or on-premises
- View min, avg, and max latency per hop across any time window
- Surface anomalous hops automatically with baseline deviation alerts
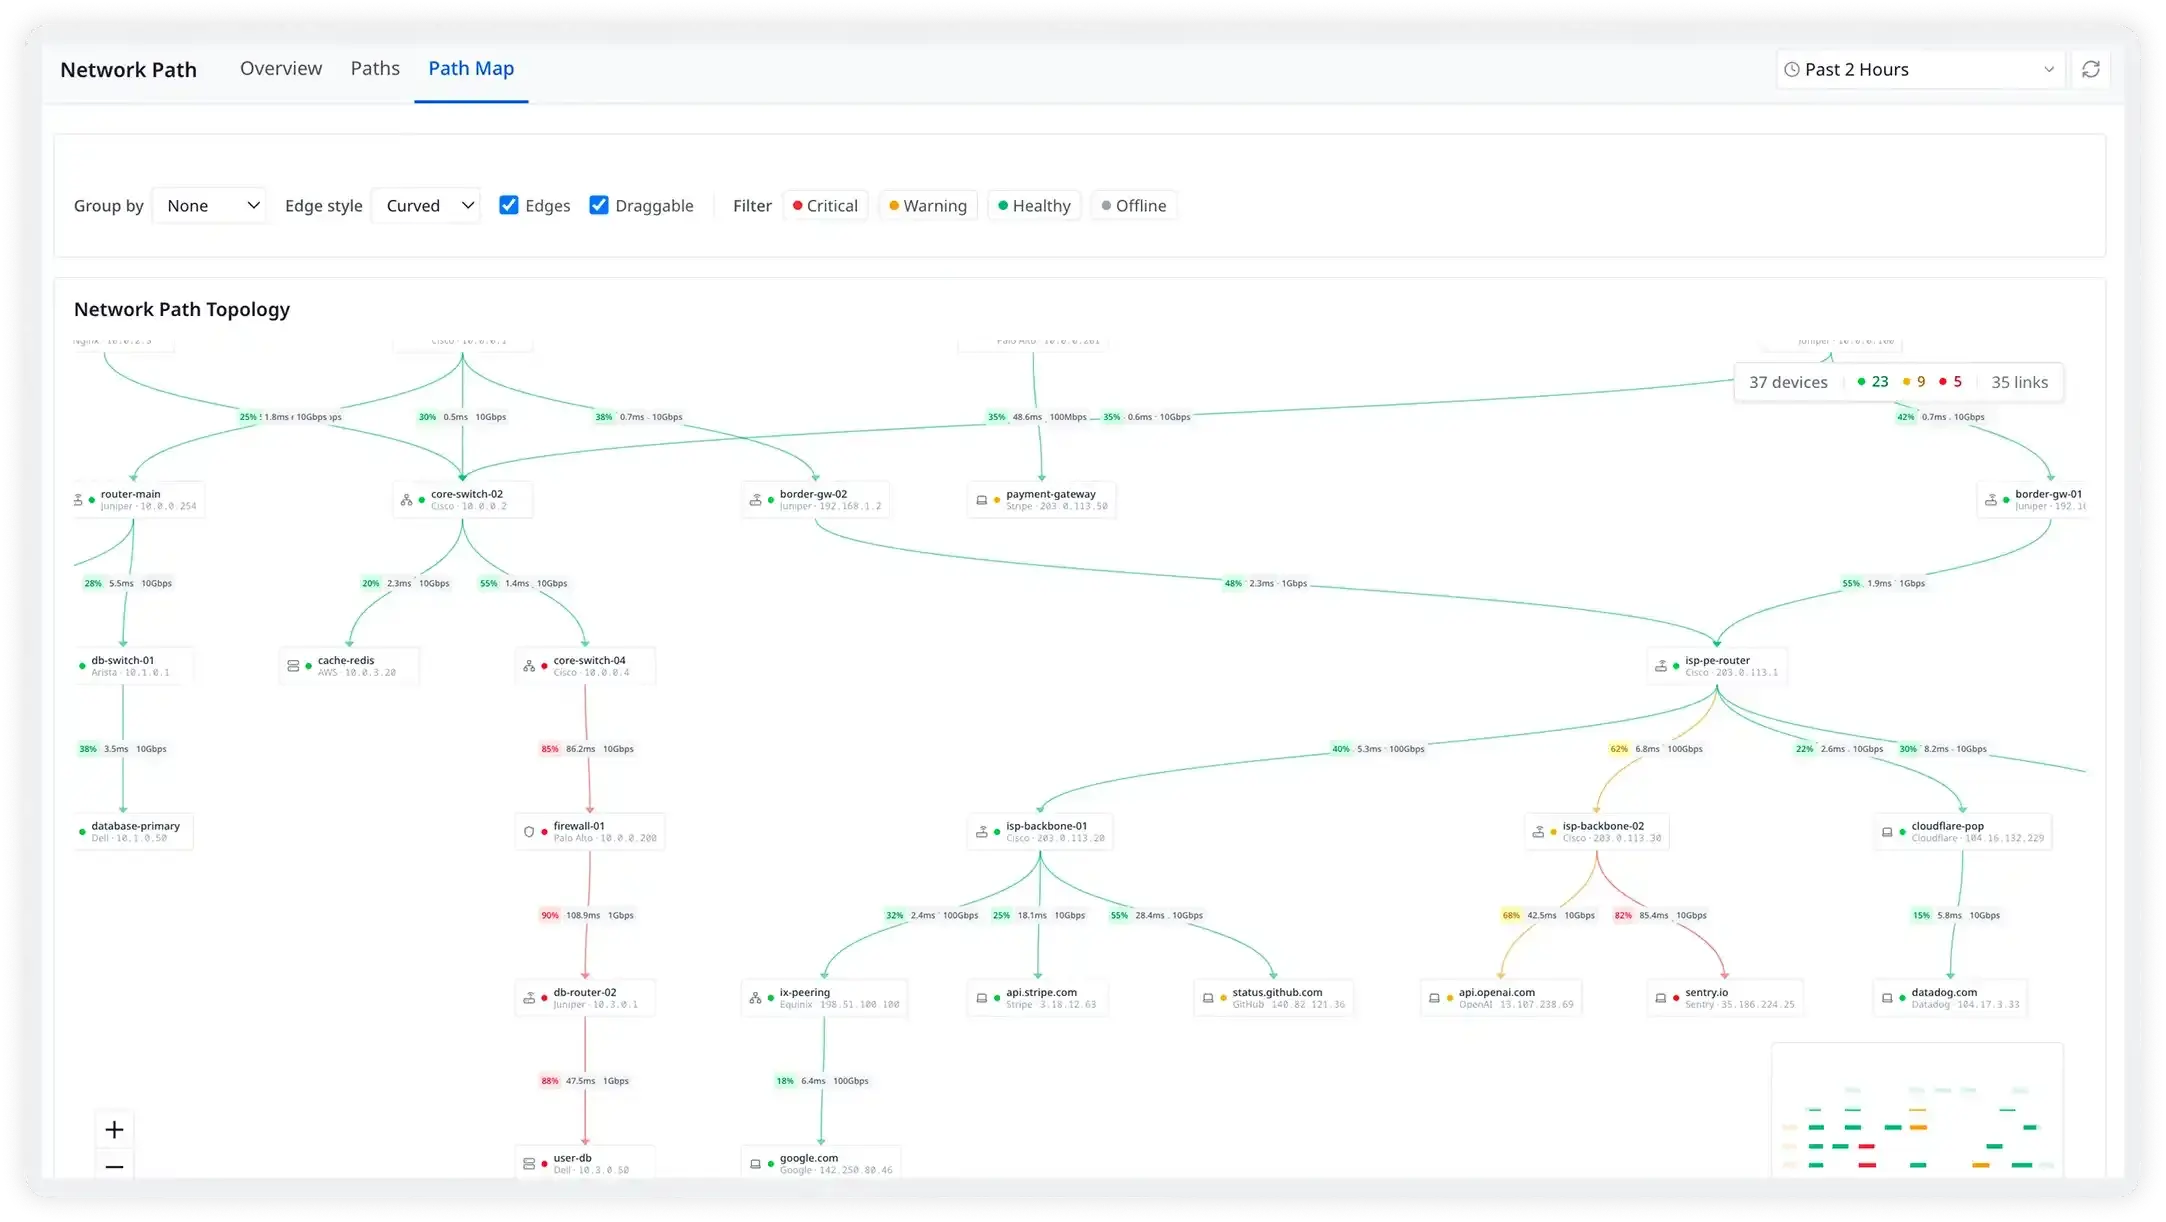
Visualize your network topology in real time
The Atatus Path Map renders a live topology of every active path across your infrastructure. Color-coded nodes show health at a glance — green for healthy, yellow for degraded, red for dropping packets — so your team can immediately see what's affected and where.
- Auto-detect path changes caused by BGP rerouting or ECMP failover
- Compare path topologies before and after an incident with historical replay
- Click any node to drill into that hop's latency and loss history
Built for the hardest network problems
BGP Rerouting & Path Changes
Your ISP silently reroutes traffic through a longer path after maintenance. Atatus detects the topology change in real time and quantifies the latency impact.
Cloud Migration Validation
Baseline network performance before migration and continuously validate after — verifying cloud-based routes perform as expected for every dependent service.
Hybrid Cloud Connectivity
Track the full path across cloud, WAN, and on-premises fabric for applications spanning Direct Connect or VPN.
Intermittent Packet Loss
Prove a router dropped 3% of packets at 2 AM — even after it self-recovered — using continuous historical probe data.
Incident Root Cause Analysis
Replay the exact path topology from the moment a P1 incident started. Was it a routing change or a congested peering point? Answer in minutes.