Introducing Apache Monitoring
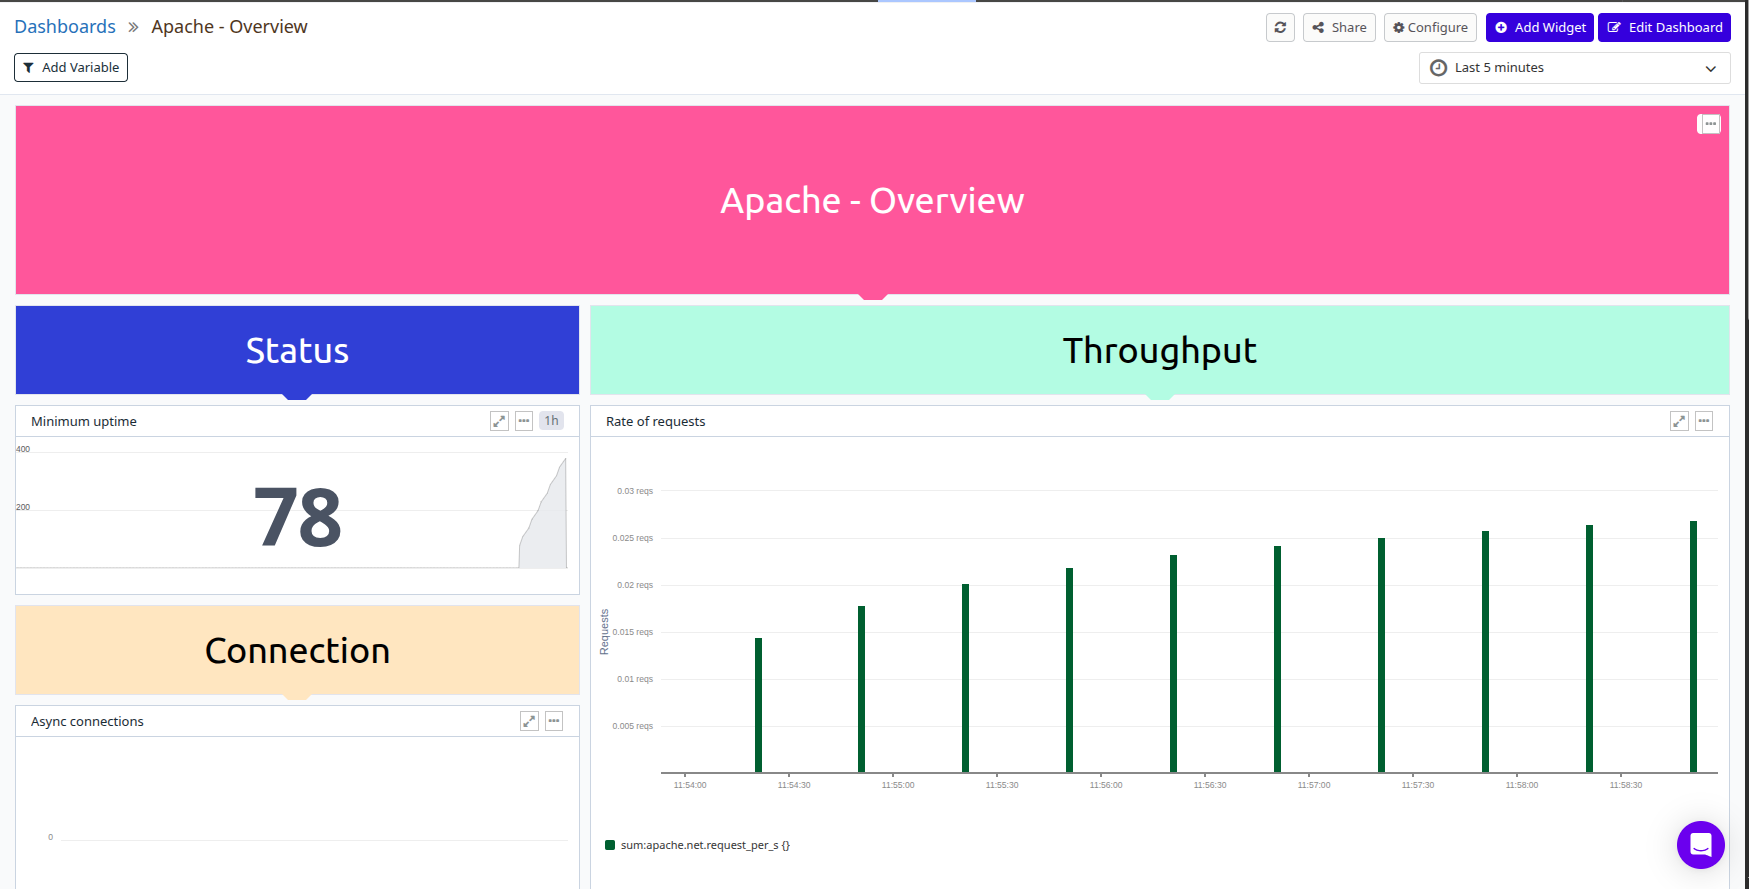
Released on: January 2026Atatus now supports Apache HTTP Server monitoring, providing comprehensive visibility into your web server performance and health. Track request rates, response times, worker utilization, connection metrics, and error rates to ensure your Apache servers deliver reliable, fast web experiences.
With real-time dashboards and proactive alerting, operations teams can identify configuration issues, detect traffic spikes, and optimize Apache performance to handle production workloads efficiently.
Key Benefits of Apache Monitoring in Atatus:
- Request Metrics: Monitor requests per second, response times, and status code distribution to understand traffic patterns and server responsiveness.
- Worker Utilization: Track busy and idle workers, connection states, and thread pool usage to optimize MPM configuration for your workload.
- Error Rate Tracking: Identify 4xx and 5xx error spikes, monitor error logs, and correlate errors with upstream application issues.
- Resource Monitoring: Track CPU, memory, and network usage at the server level to detect resource constraints before they impact performance.
- Virtual Host Insights: Monitor performance metrics per virtual host to identify which sites or applications are consuming the most resources.
Monitor your software stack for free with Atatus.
Start your free trialOR
Request a DemoFree 14-day trial. No credit card required. Cancel anytime.