Atatus Lambda Extension Now Captures Logs and Metrics
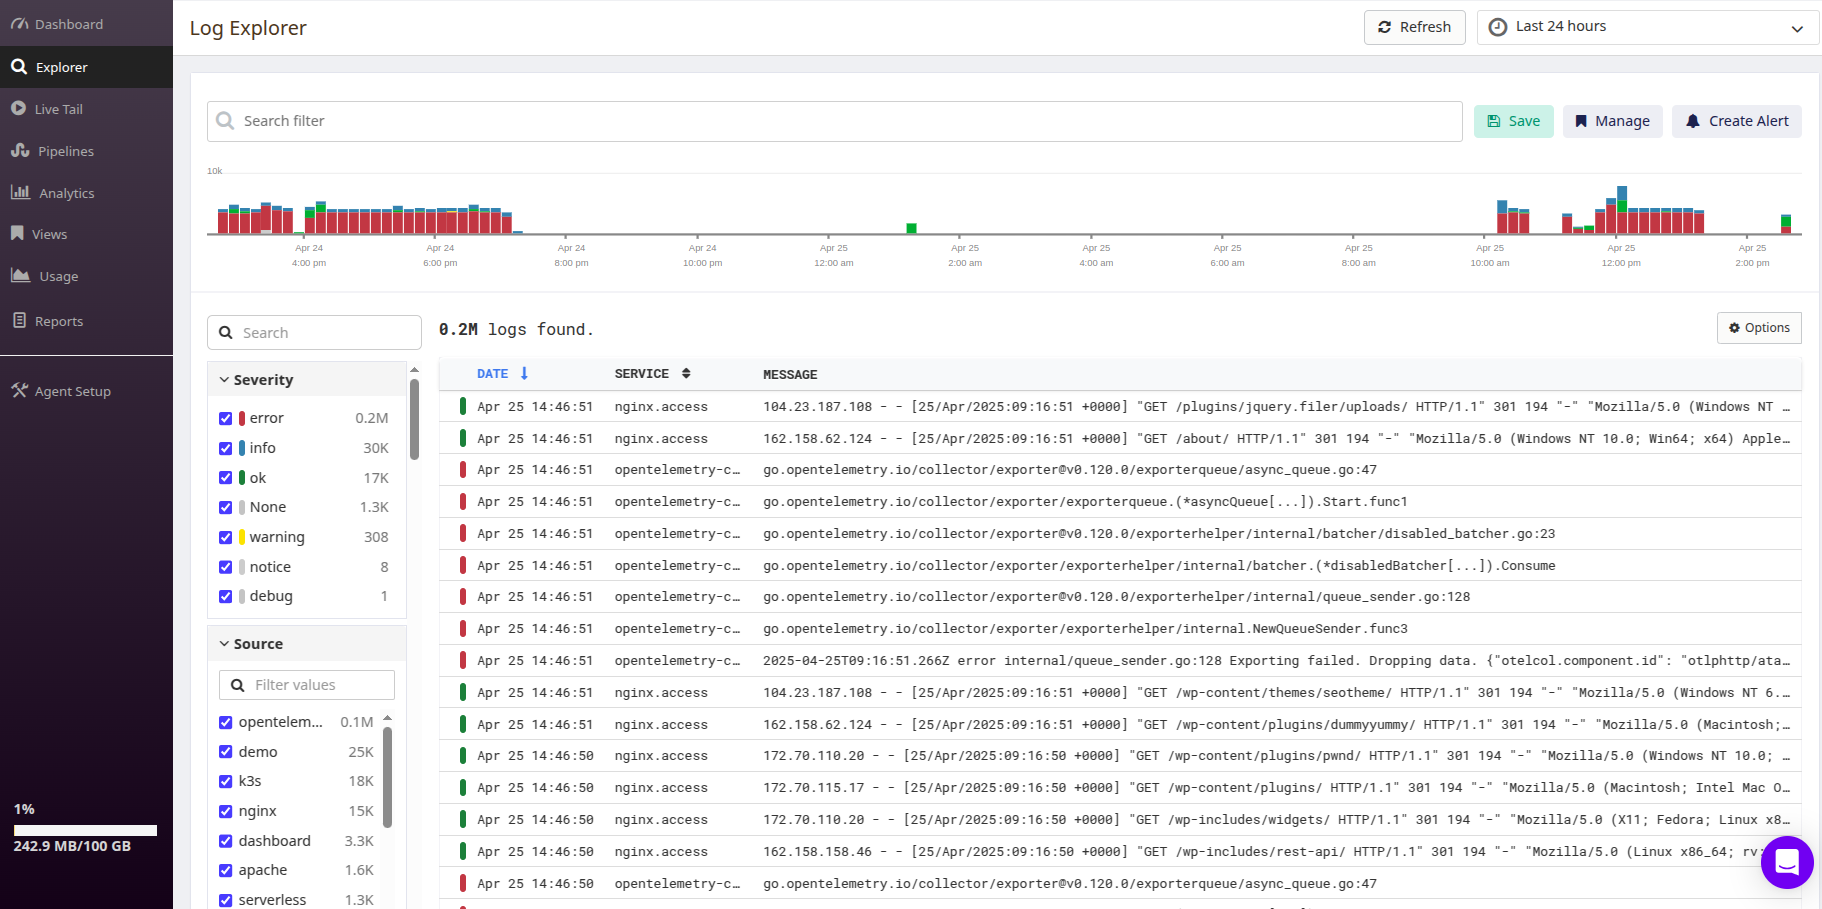
Released on: April 2025Atatus already offers built-in support for traces in AWS Lambda, enabling effective performance monitoring and troubleshooting. With the latest update, we are introducing native log collection and metrics from serverless functions using the new Atatus Lambda Extension. With logs, metrics, and traces unified in a single platform, you get a complete observability stack, making it easier than ever to monitor, debug, and optimize your serverless workloads with speed and precision. For detailed instructions, refer to our AWS Lambda Monitoring with Atatus Extension documentation. Start monitoring your serverless applications more effectively today!

Key Highlights:
- Simplified Setup: Easily integrate the Atatus Lambda Extension by adding it as a layer to your Lambda functions.
- Enhanced Observability: Automatically collect and aggregate metrics, logs, and traces without manual instrumentation.
- Comprehensive Monitoring: Gain insights into execution duration, error rates, resource utilization, and more.
- Real-Time Alerts: Set up alerts based on predefined thresholds or custom conditions to proactively address issues.
- Efficient Data Transmission: The extension aggregates and transmits data in bulk, reducing overhead.
- Resource Optimization: Monitor CPU and memory usage to fine-tune your functions for optimal performance and cost-efficiency.
Monitor your software stack for free with Atatus.
Start your free trialOR
Request a DemoFree 14-day trial. No credit card required. Cancel anytime.